

Conditioned Medium from Malignant Breast Cancer Cells Induces an EMT-Like Phenotype and an Altered N-Glycan Profile in Normal Epithelial MCF10A Cells
- PMID: 28763000
- PMCID: PMC5577993
- DOI: 10.3390/ijms18081528
Conditioned Medium from Malignant Breast Cancer Cells Induces an EMT-Like Phenotype and an Altered N-Glycan Profile in Normal Epithelial MCF10A Cells
Abstract
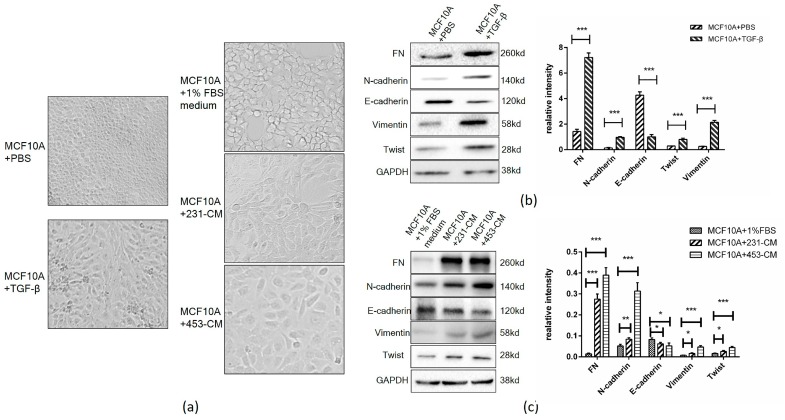
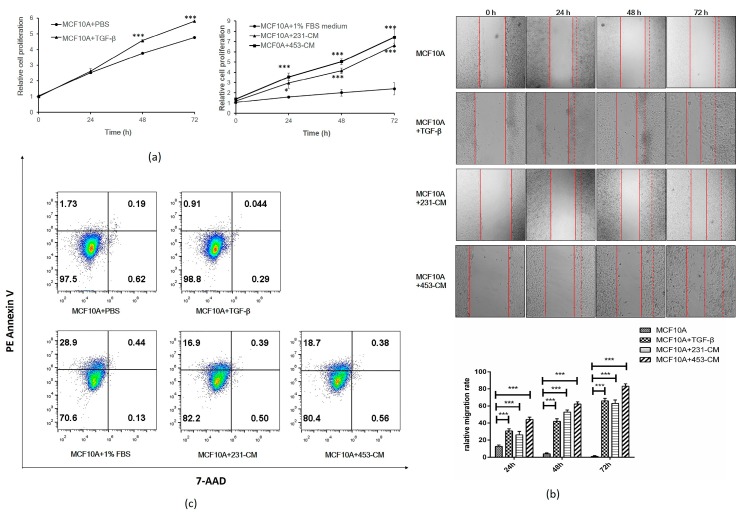
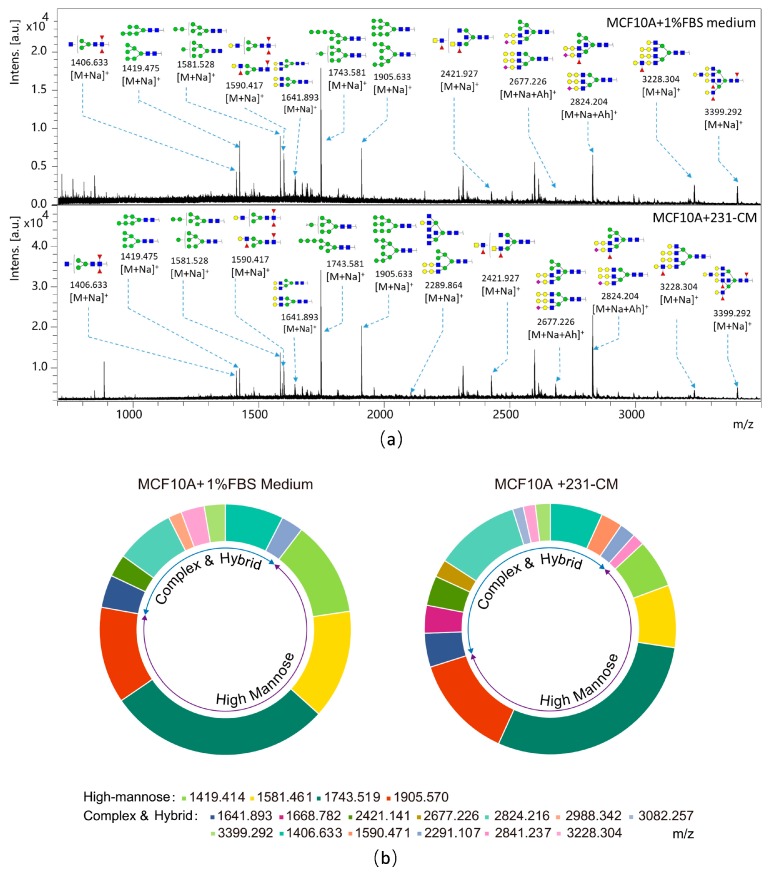
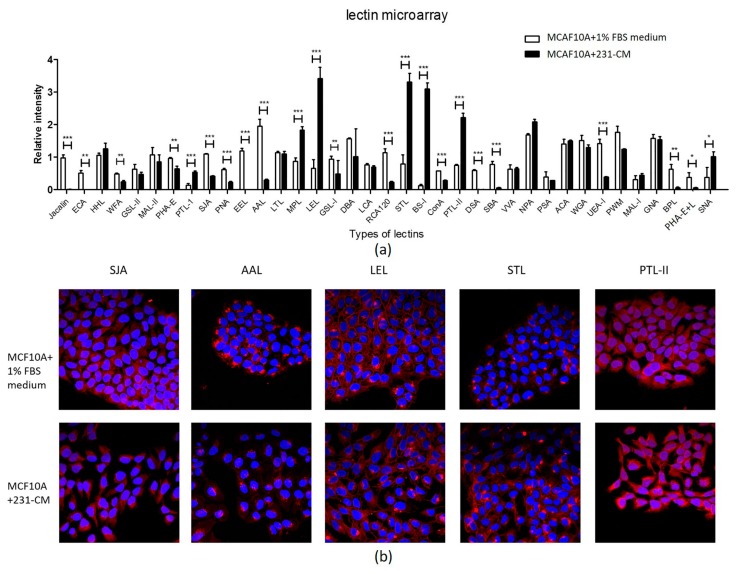
Epithelial-mesenchymal transition (EMT) is a key process in cancer development and progression. Communication (crosstalk) between cancer cells and normal (nonmalignant) cells may facilitate cancer progression. Conditioned medium (CM) obtained from cultured cancer cells contains secreted factors capable of affecting phenotypes and the behaviors of normal cells. In this study, a culture of normal breast epithelial MCF10A cells with CM from malignant breast cancer cells (termed 231-CM and 453-CM) resulted in an alteration of morphology. CM-treated MCF10A, in comparison with control cells, showed a reduced expression of the epithelial marker E-cadherin, increased expression of the mesenchymal markers fibronectin, vimentin, N-cadherin, and TWIST1, meanwhile cell proliferation and migration were enhanced while cell apoptosis was decreased. N-glycan profiles of 231-CM-treated and control MCF10A cells were compared by MALDI-TOF/TOF-MS (Matrix-Assisted Laser Desorption/ Ionization Time of Flight Mass Spectrometry) and a lectin microarray analysis. The treated cells showed lower levels of high-mannose-type N-glycan structures, and higher levels of complex-type and hybrid-type structures. Altered N-glycan profiles were also detected in 453-CM-treated and non-treated MCF10A cells by MALDI-TOF/TOF-MS, and we found that the expression of five fucosylated N-glycan structures (m/z 1406.663, 1590.471, 1668.782, 2421.141, and 2988.342) and one high-mannose structure m/z 1743.722 have the same pattern as 231-CM-treated MCF10A cells. Our findings, taken together, show that CM derived from breast cancer cells induced an EMT-like process in normal epithelial cells and altered their N-glycan profile.
Keywords: EMT; N-glycan; breast cancer; cell migration; conditioned medium.
Conflict of interest statement
The authors declare no conflict of interest.
Figures
Similar articles
-
Alteration of N-glycans and expression of their related glycogenes in the epithelial-mesenchymal transition of HCV29 bladder epithelial cells.Molecules. 2014 Dec 1;19(12):20073-90. doi: 10.3390/molecules191220073. Molecules. 2014. PMID: 25470275 Free PMC article.
-
Conditioned Medium from Adipose-Derived Stem Cells (ADSCs) Promotes Epithelial-to-Mesenchymal-Like Transition (EMT-Like) in Glioma Cells In vitro.Mol Neurobiol. 2016 Dec;53(10):7184-7199. doi: 10.1007/s12035-015-9585-4. Epub 2015 Dec 19. Mol Neurobiol. 2016. PMID: 26687184
-
Transcriptional responses to direct and indirect TGFB1 stimulation in cancerous and noncancerous mammary epithelial cells.Cell Commun Signal. 2024 Oct 28;22(1):522. doi: 10.1186/s12964-024-01821-5. Cell Commun Signal. 2024. PMID: 39468555 Free PMC article.
-
Epithelial Plasticity During Human Breast Morphogenesis and Cancer Progression.J Mammary Gland Biol Neoplasia. 2016 Dec;21(3-4):139-148. doi: 10.1007/s10911-016-9366-3. Epub 2016 Nov 4. J Mammary Gland Biol Neoplasia. 2016. PMID: 27815674 Free PMC article. Review.
-
Cracking the Breast Cancer Glyco-Code through Glycan-Lectin Interactions: Targeting Immunosuppressive Macrophages.Int J Mol Sci. 2021 Feb 17;22(4):1972. doi: 10.3390/ijms22041972. Int J Mol Sci. 2021. PMID: 33671245 Free PMC article. Review.
Cited by
-
Application of Lectin Microarrays for Biomarker Discovery.ChemistryOpen. 2020 Mar 2;9(3):285-300. doi: 10.1002/open.201900326. eCollection 2020 Mar. ChemistryOpen. 2020. PMID: 32154049 Free PMC article. Review.
-
Cancer stem cells as key drivers of tumour progression.J Biomed Sci. 2018 Mar 6;25(1):20. doi: 10.1186/s12929-018-0426-4. J Biomed Sci. 2018. PMID: 29506506 Free PMC article. Review.
-
Unraveling malignant phenotype of peritumoral tissue: transcriptomic insights into early-stage breast cancer.Breast Cancer Res. 2024 Jun 3;26(1):89. doi: 10.1186/s13058-024-01837-2. Breast Cancer Res. 2024. PMID: 38831458 Free PMC article.
-
Metastatic Niches and the Modulatory Contribution of Mesenchymal Stem Cells and Its Exosomes.Int J Mol Sci. 2019 Apr 20;20(8):1946. doi: 10.3390/ijms20081946. Int J Mol Sci. 2019. PMID: 31010037 Free PMC article. Review.
-
Breast cancer stem cells: mechanobiology reveals highly invasive cancer cell subpopulations.Cell Mol Life Sci. 2022 Feb 16;79(3):134. doi: 10.1007/s00018-022-04181-w. Cell Mol Life Sci. 2022. PMID: 35171381 Free PMC article.
References
-
- Taniguchi N., Kizuka Y. Glycans and cancer: Role of N-glycans in cancer biomarker, progression and metastasis, and therapeutics. Adv. Cancer Res. 2015;126:11–51. - PubMed
MeSH terms
Substances
LinkOut - more resources
Full Text Sources
Other Literature Sources
Medical
Research Materials
