

Remodeling of ER-exit sites initiates a membrane supply pathway for autophagosome biogenesis
- PMID: 28754694
- PMCID: PMC5579361
- DOI: 10.15252/embr.201744559
Remodeling of ER-exit sites initiates a membrane supply pathway for autophagosome biogenesis
Abstract
Autophagosomes are double-membrane vesicles generated during autophagy. Biogenesis of the autophagosome requires membrane acquisition from intracellular compartments, the mechanisms of which are unclear. We previously found that a relocation of COPII machinery to the ER-Golgi intermediate compartment (ERGIC) generates ERGIC-derived COPII vesicles which serve as a membrane precursor for the lipidation of LC3, a key membrane component of the autophagosome. Here we employed super-resolution microscopy to show that starvation induces the enlargement of ER-exit sites (ERES) positive for the COPII activator, SEC12, and the remodeled ERES patches along the ERGIC A SEC12 binding protein, CTAGE5, is required for the enlargement of ERES, SEC12 relocation to the ERGIC, and modulates autophagosome biogenesis. Moreover, FIP200, a subunit of the ULK protein kinase complex, facilitates the starvation-induced enlargement of ERES independent of the other subunits of this complex and associates via its C-terminal domain with SEC12. Our data indicate a pathway wherein FIP200 and CTAGE5 facilitate starvation-induced remodeling of the ERES, a prerequisite for the production of COPII vesicles budded from the ERGIC that contribute to autophagosome formation.
Keywords: COPII; ER‐exit sites; FIP200; autophagosome; autophagy.
© 2017 The Authors.
Figures
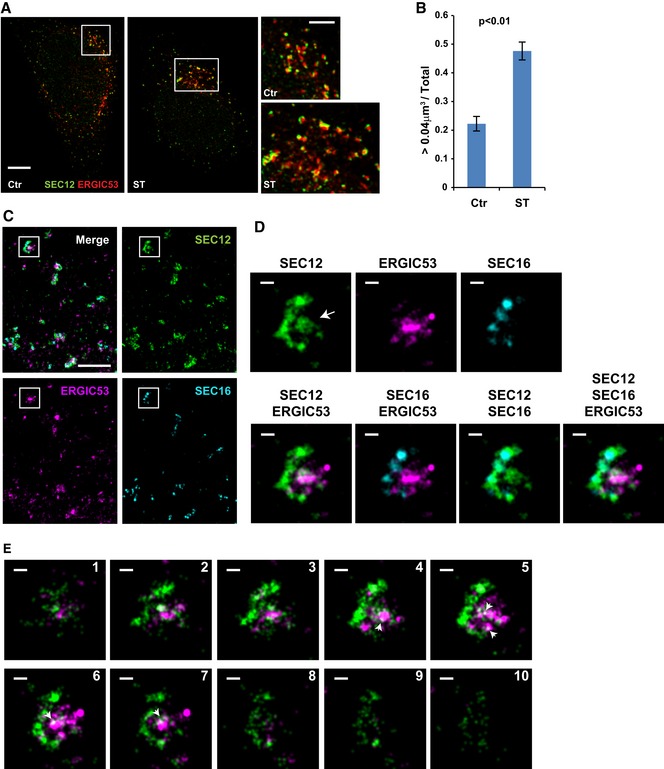
HeLa cells were incubated in nutrient‐rich medium (Ctr) or starved in EBSS (ST) for 1 h. Structured illumination microscopy (SIM) was performed to analyze the structure and relation of SEC12 and ERGIC compartments. Scale bars are 5 μm (original image) and 2 μm (zoomed in image), respectively.
Quantification of the fraction of SEC12 compartments larger than 0.04 μm3 in volume analyzed in (A). Error bars represent standard deviations. P‐value was obtained from two‐tailed t‐test. Five experiments were performed for the statistics.
HeLa cells were starved in EBSS for 1 h. Immunofluorescence and 3D‐STORM were performed to resolve the structure of SEC12 and ERGIC compartments. Scale bar: 1 μm.
Zoomed in images of the boxed areas in (C). Arrows indicate the SEC12 localized on the ERGIC area. Scale bar: 100 nm.
Virtual Z‐sections (50 nm thickness and 40 nm per step) of (D) with SEC12 and ERGIC. Of the total, 10 of 13 sections are shown. Arrows indicate the ERGIC‐localized SEC12 (D). Scale bar: 100 nm.
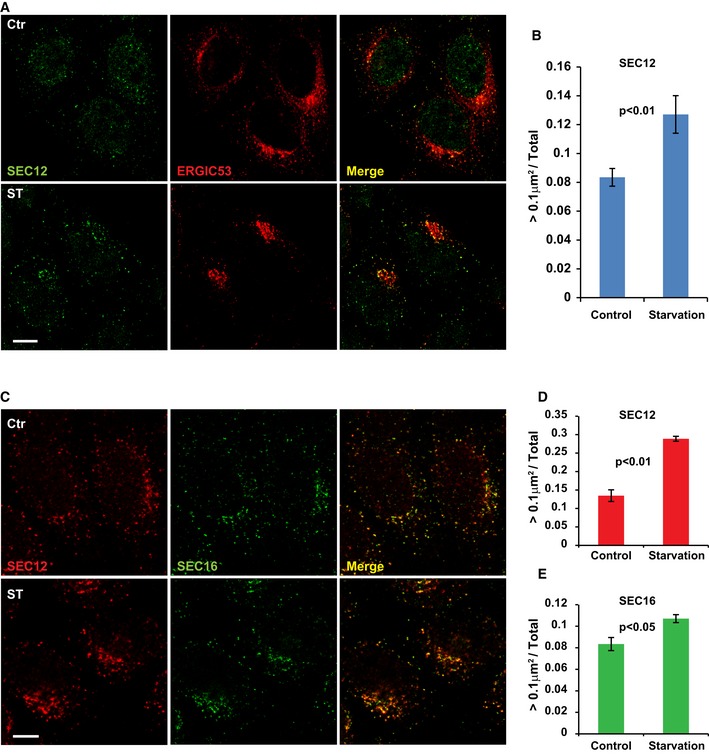
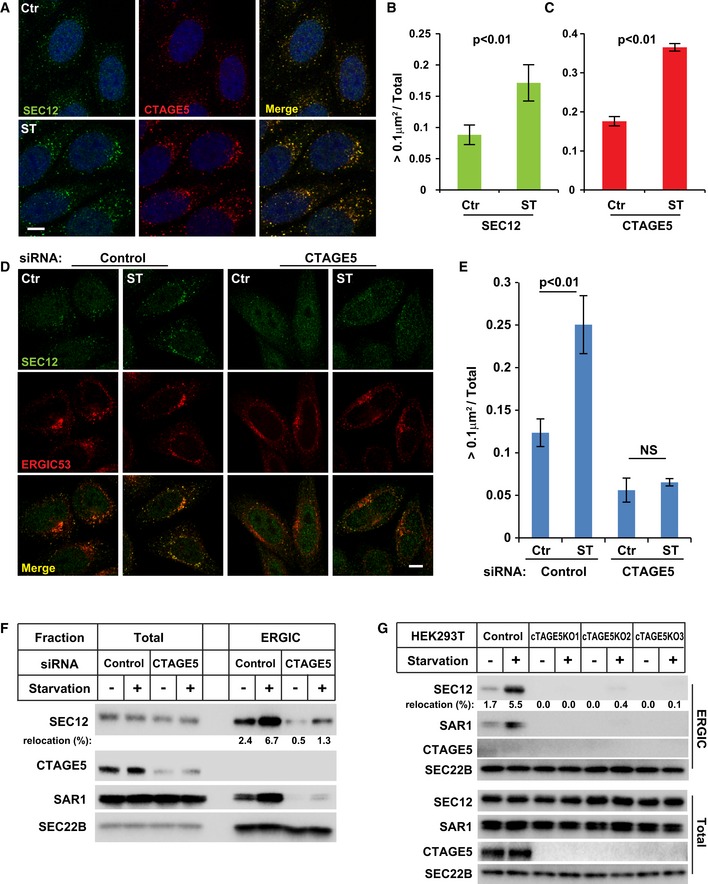
HeLa cells were incubated in nutrient‐rich medium (Ctr) or starved in EBSS (ST) for 1 h. Immunofluorescence and confocal microscopy were performed to visualize SEC12 and ERGIC53. Scale bar: 10 μm
Quantification of the fraction of SEC12 compartments larger than 0.1 μm2 in area analyzed in (A). Error bars represent standard deviations. P‐value was obtained from two‐tailed t‐test. Five experiments (50–100 cells/experiment) were performed for the statistics.
HeLa cells were incubated in nutrient‐rich medium (Ctr) or starved in EBSS (ST) for 1 h. Immunofluorescence and confocal microscopy were performed to visualize SEC12 and SEC16 compartments. Scale bar: 10 μm
Quantification of the percentage of SEC12 compartments larger than 0.1 μm2 in area analyzed in (C). Error bars represent standard deviations. P‐value was obtained from two‐tailed t‐test. Five experiments (50–100 cells/experiment) were performed for the statistics.
Quantification of the percentage of SEC16 compartments larger than 0.1 μm2 in area analyzed in (C). Error bars represent standard deviations. P‐value was obtained from two‐tailed t‐test. Five experiments (50–100 cells/experiment) were performed for the statistics.
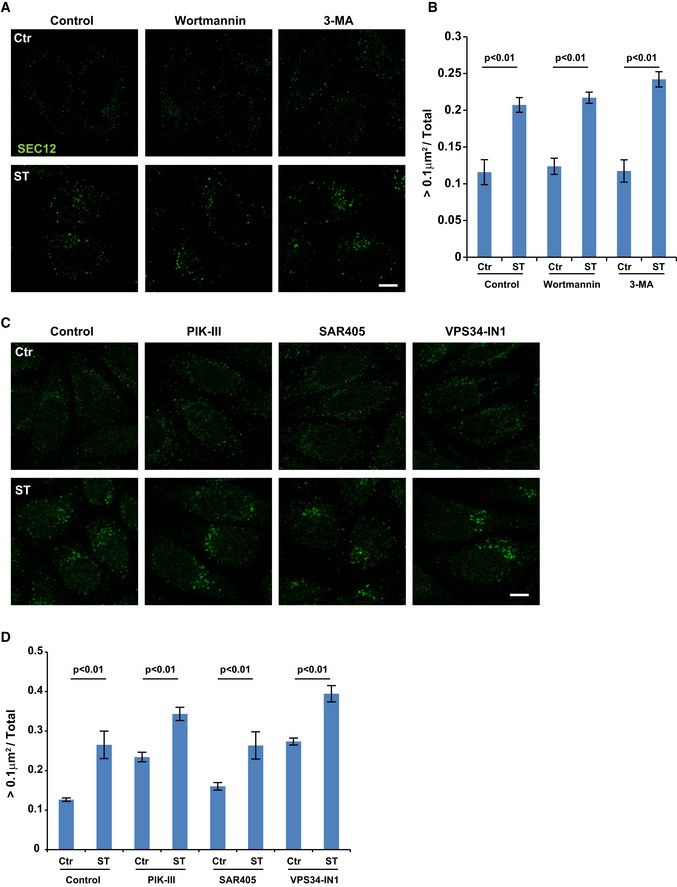
HeLa cells were incubated in nutrient‐rich medium (Ctr) or starved in EBSS (ST) with control, wortmannin (10 nM) or 3‐methyladenine (3‐MA, 10 mM) for 1 h. Immunofluorescence and confocal microscopy were performed to visualize SEC12 compartments. Scale bar: 10 μm
Quantification of the fraction of SEC12 compartments larger than 0.1 μm2 in area analyzed in (A). Error bars represent standard deviations. P‐value was obtained from two‐tailed t‐test. Five experiments (50–100 cells/experiment) were performed for the statistics.
HeLa cells were incubated in nutrient‐rich medium (Ctr) or starved in EBSS (ST) with control, PIK‐III, SAR405, or VPS34‐IN1 (20 μM each) for 1 h. Immunofluorescence and confocal microscopy were performed to visualize SEC12 compartments. Scale bar: 10 μm
Quantification of the fraction of SEC12 compartments larger than 0.1 μm2 in area analyzed in (C). Error bars represent standard deviations. P‐value was obtained from two‐tailed t‐test. Five experiments (50–100 cells/experiment) were performed for the statistics.
- A
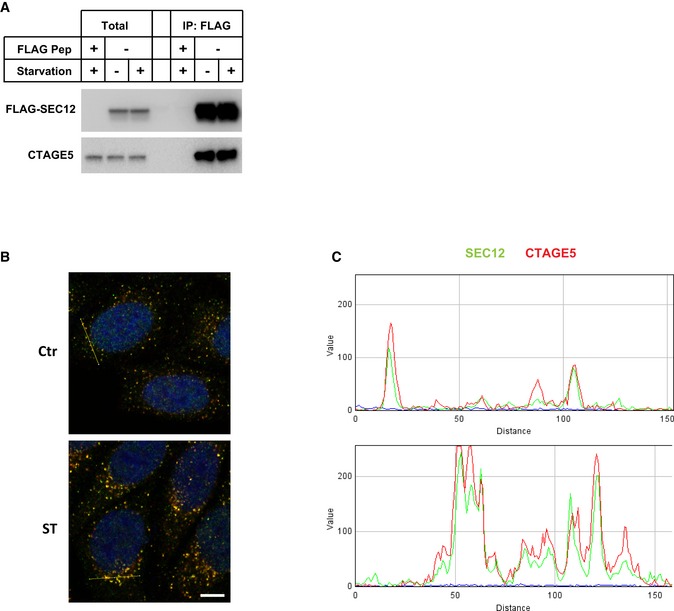
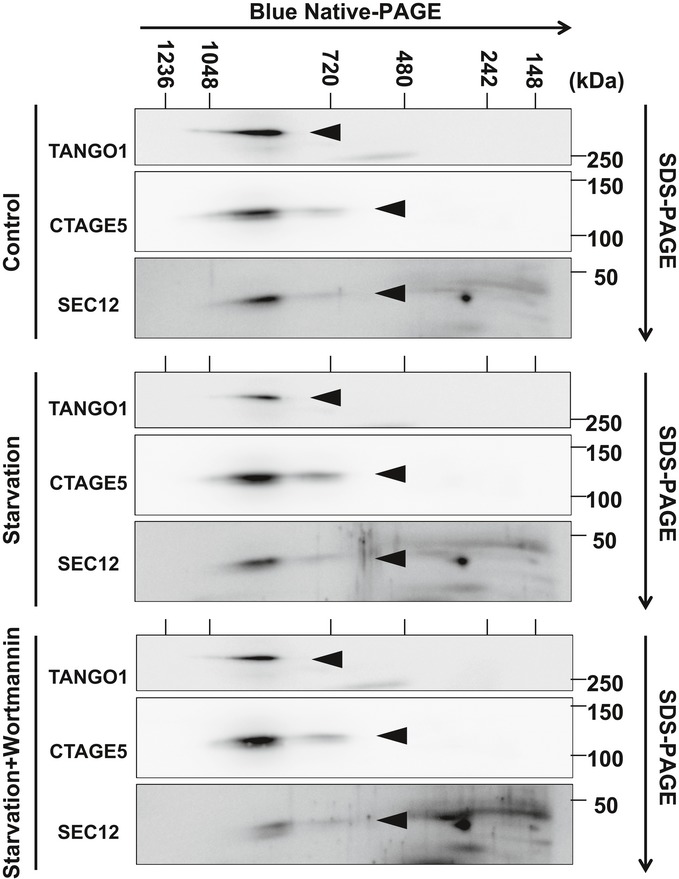
HEK293T cells were transfected with control plasmids or plasmids encoding FLAG‐SEC12. After 24 h, the cells were incubated in nutrient‐rich medium or starved in EBSS for 1 h. Immunoprecipitation of FLAG‐SEC12 was performed, and the levels of indicated proteins from indicated fractions were determined by immunoblot.
- B, C
RGB profile plots showing the colocalization of SEC12 (green) and CTAGE5 (red) through the lines drawn on the merged images shown in Fig 2A (yellow lines in panel B).
- A
HeLa cells were incubated in nutrient‐rich medium (Ctr) or starved in EBSS (ST) for 1 h. Immunofluorescence and confocal microscopy were performed to visualize SEC12 and CTAGE5. Scale bar: 10 μm.
- B, C
Quantification of the fraction of SEC12 or CTAGE5 compartments larger than 0.1 μm2 in area analyzed in (A). Error bars represent standard deviations. P‐value was obtained from two‐tailed t‐test. Five experiments (50–100 cells/experiment) were performed for the statistics.
- D
HeLa cells were transfected with control and siRNAs against cTAGE5. After 72 h, the cells were incubated in nutrient‐rich medium (Ctr) or starved in EBSS (ST) for 1 h. Immunofluorescence and confocal microscopy were performed to visualize SEC12 and ERGIC53. Scale bar: 10 μm.
- E
Quantification of the fraction of SEC12 or CTAGE5 compartments larger than 0.1 μm2 in area analyzed in (D). Error bars represent standard deviations. P‐value was obtained from two‐tailed t‐test. Five experiments (50–100 cells/experiment) were performed for the statistics.
- F
HEK293T cells were transfected with control and siRNAs against cTAGE5. After 72 h, the cells were incubated in nutrient‐rich medium or starved in EBSS for 1 h. The cell lysates and the ERGIC membrane fractions were analyzed by immunoblot to determine the levels of indicated proteins. Quantification shows the percentage of SEC12 relocation to the ERGIC under the indicated conditions.
- G
cTAGE5 knockout (KO) cell lines were established using CRISPR/Cas9 in HEK293T cells. Control cells as well as three KO cell lines were incubated in nutrient‐rich medium or starved in EBSS for 1 h. The cell lysates and the ERGIC membrane fractions were analyzed by immunoblot to determine the levels of indicated proteins. Quantification shows the percentage of SEC12 relocation to the ERGIC under the indicated conditions.
- A
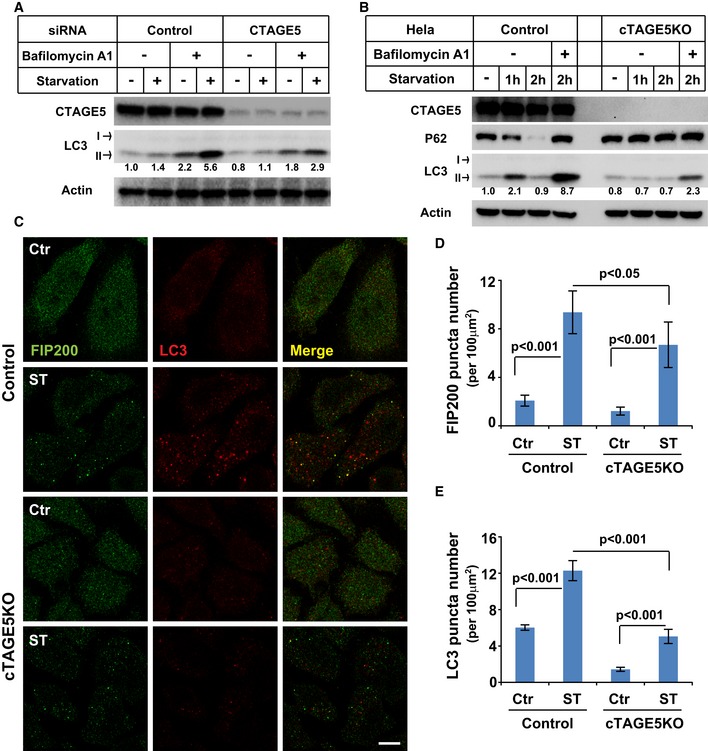
HeLa cells were transfected with control and siRNAs against cTAGE5. After 72 h, the cells were incubated in nutrient‐rich medium or starved in EBSS in the absence or presence of 500 nM bafilomycin A1 for 1 h. Immunoblots was performed to determine the levels of indicated proteins. Quantification shows the relative level of LC3 lipidation to the control (control siRNA and before starvation in the absence of bafilomycin A1).
- B
Control and cTAGE5 knockout (KO) cells were incubated in nutrient‐rich medium or starved in EBSS for 1 and 2 h in the absence or presence of bafilomycin A1. Immunoblot was performed to determine the levels of indicated proteins. Quantification shows the relative level of LC3 lipidation to the control (control cell and before starvation).
- C
Control cells and cTAGE5 knockout (KO) cells shown in (B) were incubated in nutrient‐rich medium or starved in EBSS for 1 h. Immunofluorescence and confocal microscopy were performed to visualize FIP200 and LC3. Scale bar: 10 μm.
- D, E
Quantification of the FIP200 (D) and LC3 (E) puncta number analyzed in (C). Error bars represent standard deviations. P‐value was obtained from two‐tailed t‐test. Five experiments (50–100 cells/experiment) were performed for the statistics.
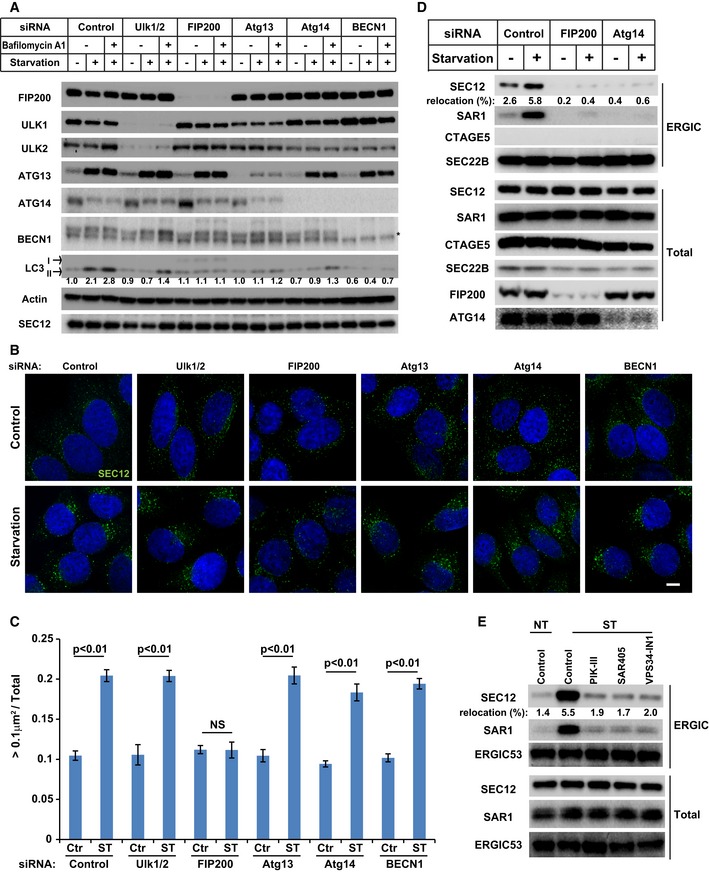
HeLa cells were transfected with control or siRNAs against the indicated autophagic factors. After 72 h, the cells were incubated in nutrient‐rich medium or starved in EBSS for 1 h in the absence or presence of bafilomycin A1. Immunoblot was performed to determine the levels of indicated proteins. Quantification shows the relative level of LC3 lipidation to the control (control siRNA and before starvation in the absence of bafilomycin A1).
HeLa cells transfected with the indicated siRNAs were incubated in nutrient‐rich medium (Control) or starved in EBSS (Starvation) for 1 h. Immunofluorescence and confocal microscopy were performed to visualize SEC12. Scale bar: 10 μm
Quantification of the fraction of SEC12 compartments larger than 0.1 μm2 in area analyzed in (A). Error bars represent standard deviations. P‐value was obtained from two‐tailed t‐test. Five experiments (50–100 cells/experiment) were performed for the statistics.
HEK293T cells transfected with indicated siRNAs were incubated in nutrient‐rich medium or starved in EBSS for 1 h. Immunoblot was performed to determine the levels of indicated proteins from the total cell lysates and the ERGIC fractions. Quantification shows the percentage of SEC12 relocation to the ERGIC under the indicated conditions.
HEK293T cells were incubated in nutrient‐rich medium or starved in EBSS without or with the indicated PI3K inhibitors for 1 h. Immunoblot was performed to determine the levels of indicated proteins from the total cell lysates and the ERGIC fractions. Quantification shows the percentage of SEC12 relocation to the ERGIC under the indicated conditions.
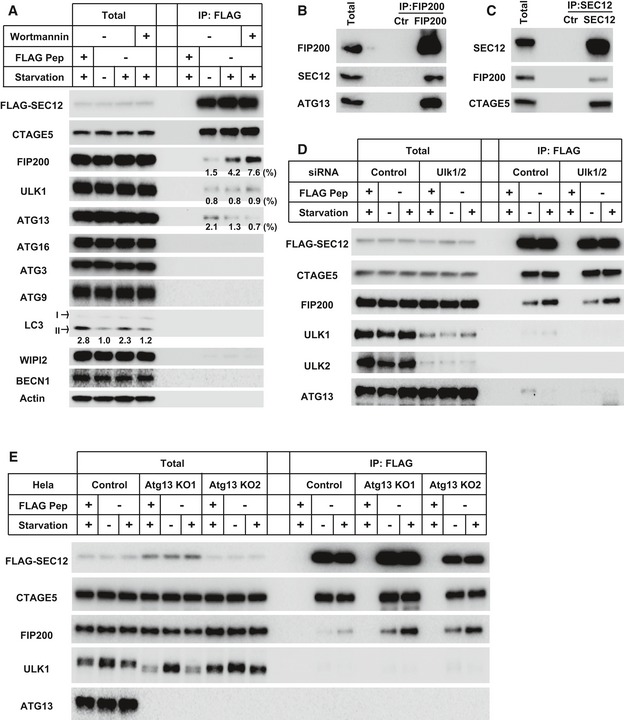
- A
HEK293T cells were transfected with plasmids encoding FLAG‐SEC12. After 24 h, the cells were incubated in nutrient‐rich medium or starved in EBSS for 1 h in the absence or presence of 10 nM wortmannin. Immunoprecipitation of FLAG‐SEC12 was performed and the levels of indicated proteins from indicated fractions were determined by immunoblot. Quantification of co‐IP shows the percentage of co‐precipitated FIP200, ULK1, or ATG13 under the indicated conditions. Quantification of LC3 lipidation shows the relative level of LC3 lipidation to the control (before starvation).
- B, C
HeLa cells were starved in EBSS for 1 h. Immunoprecipitation of endogenous FIP200 (B) or SEC12 (C) was performed, and the levels of indicated proteins from indicated fractions were determined by immunoblot.
- D
HEK293T cells were transfected with control or siRNAs against Ulk1 and Ulk2. After 48 h, the cells were transfected with plasmids encoding FLAG‐SEC12. After another 24 h, the cells were incubated in nutrient‐rich medium or starved in EBSS for 1 h. Immunoprecipitation of FLAG‐SEC12 was performed and the levels of indicated proteins from indicated fractions were determined by immunoblot.
- E
HeLa cells of control and Atg13 KO generated by CRISPR/Cas9 were transfected with plasmids encoding FLAG‐SEC12. After 24 h, the cells were incubated in nutrient‐rich medium or starved in EBSS for 1 h. Immunoprecipitation of FLAG‐SEC12 was performed, and the levels of indicated proteins from indicated fractions were determined by immunoblot.
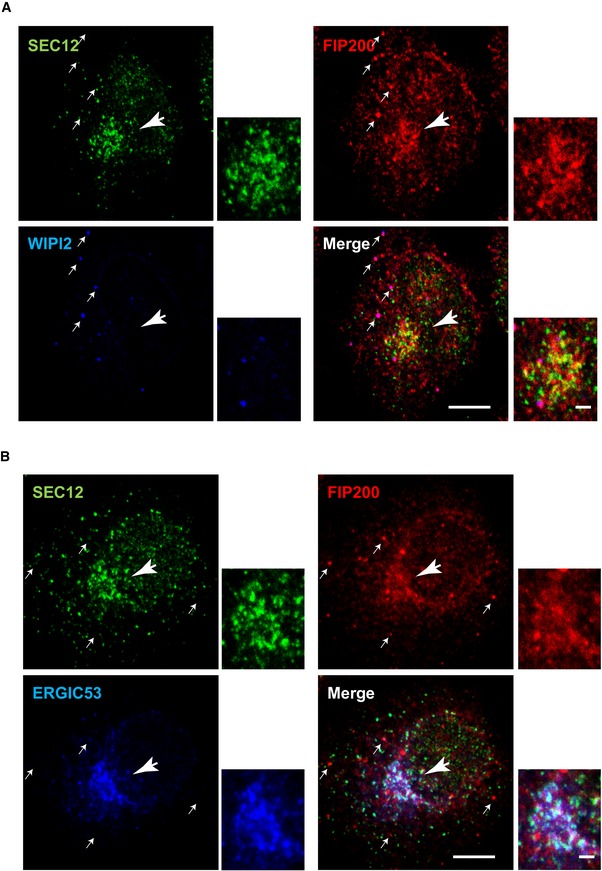
- A, B
HeLa cells were starved for 1 h. Immunofluorescence was performed to analyze the localization of SEC12, FIP200, and WIPI2 (A) and SEC12, FIP200 and ERGIC53 (B). Scale bar: 10 μm (2 μm in the magnified view).
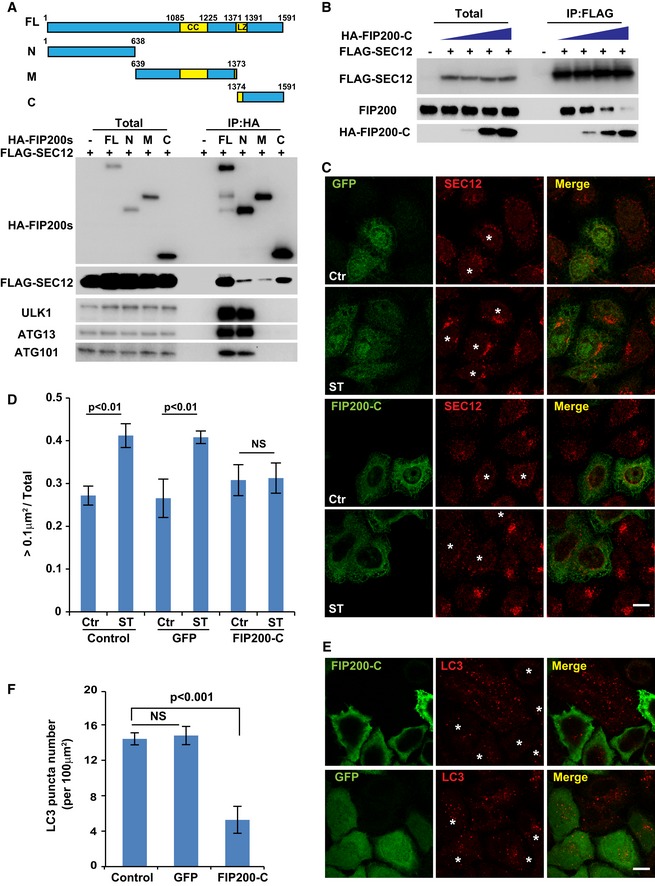
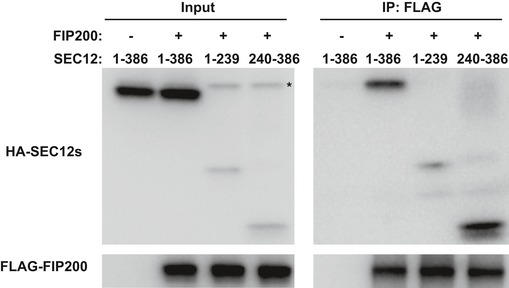
HEK293T cells were transfected with plasmids encoding FLAG‐SEC12 or together with plasmids encoding HA‐FIP200 variants. After 24 h, the cells were starved in EBSS for 1 h. Immunoprecipitation of HA‐FIP200 was performed, and the levels of indicated proteins from indicated fractions were determined by immunoblot. Schematic view of the FIP200 truncations is shown on the top.
HEK293T cells were transfected with increasing amounts of plasmids encoding HA‐FIP200 C‐terminus together with plasmids encoding FLAG‐SEC12. After 24 h, the cells were starved in EBSS for 1 h. Immunoprecipitation of FLAG‐SEC12 was performed, and the levels of indicated proteins from indicated fractions were determined by immunoblot.
HeLa cells were transfected with plasmids encoding GFP or the HA‐FIP200 C‐terminus. After 24 h, the cells were incubated in nutrient‐rich medium or starved in EBSS for 1 h. Immunofluorescence and confocal microscopy were performed to visualize SEC12 (asterisks mark the cells with GFP or FIP200‐C), GFP, and HA‐FIP200 C‐terminus. Scale bar: 10 μm.
Quantification of the fraction of SEC12 compartments larger than 0.1 μm2 in area analyzed in (C). Error bars represent standard deviations. P‐value was obtained from two‐tailed t‐test. Five experiments (50–100 cells/experiment) were performed for the statistics. Control: cells without expression of GFP or HA‐FIP200 C‐terminus; GFP: cells with GFP expression; FIP200‐C: cells with HA‐FIP200 C‐terminus expression.
HeLa cells were transfected with plasmids encoding GFP or the HA‐FIP200 C‐terminus. After 24 h, the cells were starved in EBSS for 1 h. Immunofluorescence and confocal microscopy were performed to visualize LC3 (asterisks mark the cells with GFP or FIP200‐C), GFP, and HA‐FIP200 C‐terminus. Scale bar: 10 μm.
Quantification of the LC3 puncta number analyzed in (E). Error bars represent standard deviations. P‐value was obtained from two‐tailed t‐test. Five experiments (50–100 cells/experiment) were performed for the statistics. Control: cells without expression of GFP or HA‐FIP200 C‐terminus; GFP: cells with GFP expression; FIP200‐C: cells with HA‐FIP200 C‐terminus expression.
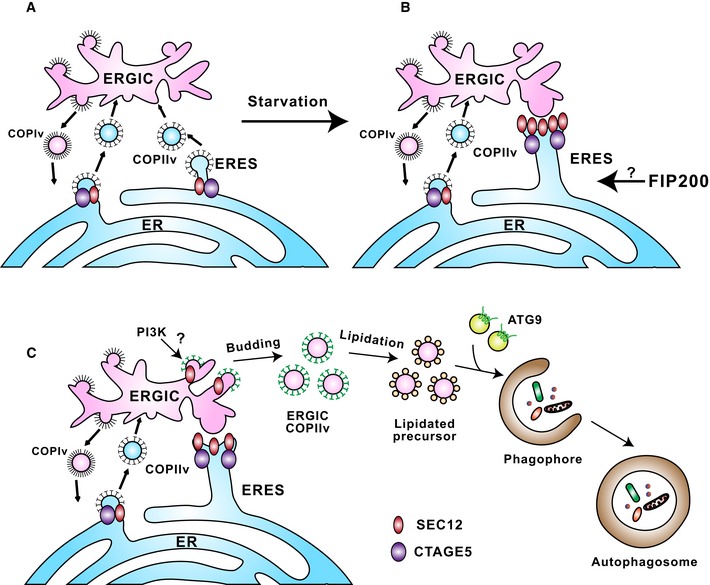
In steady‐state conditions, SEC12 (dark red oval) is enriched in the ERES, dependent on association with CTAGE5 (purple oval), for protein cargo transport by packaging COPII vesicles.
Upon starvation, SEC12‐ERES is enlarged and surrounds the ERGIC, dependent on FIP200 and CTAGE5.
The remodeling of SEC12‐ERES leads to the relocation of SEC12 to the ERGIC (dependent on the autophagic PI3K) to trigger the assembly of ERGIC‐COPII vesicles as a membrane template for LC3 lipidation, a potential vesicular pool for the assembly of the pre‐autophagosomal membrane.
Comment in
-
Endomembrane remodeling in autophagic membrane formation.Autophagy. 2018;14(5):918-920. doi: 10.1080/15548627.2018.1425053. Epub 2018 Apr 3. Autophagy. 2018. PMID: 29368983 Free PMC article.
Similar articles
-
A new type of membrane contact in the ER-Golgi system regulates autophagosome biogenesis.Autophagy. 2021 Dec;17(12):4499-4501. doi: 10.1080/15548627.2021.1972406. Epub 2021 Oct 13. Autophagy. 2021. PMID: 34643464 Free PMC article.
-
A new type of ERGIC-ERES membrane contact mediated by TMED9 and SEC12 is required for autophagosome biogenesis.Cell Res. 2022 Feb;32(2):119-138. doi: 10.1038/s41422-021-00563-0. Epub 2021 Sep 24. Cell Res. 2022. PMID: 34561617 Free PMC article.
-
Endomembrane remodeling in autophagic membrane formation.Autophagy. 2018;14(5):918-920. doi: 10.1080/15548627.2018.1425053. Epub 2018 Apr 3. Autophagy. 2018. PMID: 29368983 Free PMC article.
-
Biogenesis of autophagosomal precursors for LC3 lipidation from the ER-Golgi intermediate compartment.Autophagy. 2015;11(12):2372-4. doi: 10.1080/15548627.2015.1105422. Autophagy. 2015. PMID: 26565421 Free PMC article. Review.
-
COPII-mediated trafficking at the ER/ERGIC interface.Traffic. 2019 Jul;20(7):491-503. doi: 10.1111/tra.12654. Epub 2019 May 30. Traffic. 2019. PMID: 31059169 Free PMC article. Review.
Cited by
-
Palmitoylation of ULK1 by ZDHHC13 plays a crucial role in autophagy.Nat Commun. 2024 Aug 21;15(1):7194. doi: 10.1038/s41467-024-51402-w. Nat Commun. 2024. PMID: 39169022 Free PMC article.
-
The ULK1-FBXW5-SEC23B nexus controls autophagy.Elife. 2018 Dec 31;7:e42253. doi: 10.7554/eLife.42253. Elife. 2018. PMID: 30596474 Free PMC article.
-
A guide to membrane atg8ylation and autophagy with reflections on immunity.J Cell Biol. 2022 Jul 4;221(7):e202203083. doi: 10.1083/jcb.202203083. Epub 2022 Jun 14. J Cell Biol. 2022. PMID: 35699692 Free PMC article.
-
Proximity-dependent proteomics of the Chlamydia trachomatis inclusion membrane reveals functional interactions with endoplasmic reticulum exit sites.PLoS Pathog. 2019 Apr 3;15(4):e1007698. doi: 10.1371/journal.ppat.1007698. eCollection 2019 Apr. PLoS Pathog. 2019. PMID: 30943267 Free PMC article.
-
Mammalian ATG8 proteins maintain autophagosomal membrane integrity through ESCRTs.EMBO J. 2023 Jul 17;42(14):e112845. doi: 10.15252/embj.2022112845. Epub 2023 Jun 5. EMBO J. 2023. PMID: 37272163 Free PMC article.
References
MeSH terms
Substances
Grants and funding
LinkOut - more resources
Full Text Sources
Other Literature Sources
