. 2018 Jan:38:6-16.
doi: 10.1016/j.mito.2017.07.008. Epub 2017 Jul 25.

Mitochondrial function requires NGLY1

Affiliations

Mitochondrial function requires NGLY1

Jianping Kong et al. Mitochondrion. 2018 Jan.

Abstract

Mitochondrial respiratory chain (RC) diseases and congenital disorders of glycosylation (CDG) share extensive clinical overlap but are considered to have distinct cellular pathophysiology. Here, we demonstrate that an essential physiologic connection exists between cellular N-linked deglycosylation capacity and mitochondrial function. Following identification of altered muscle and liver mitochondrial amount and function in two children with a CDG subtype caused by NGLY1 deficiency, we evaluated mitochondrial physiology in NGLY1 disease human fibroblasts, and in NGLY1-knockout mouse embryonic fibroblasts and C. elegans. Across these distinct evolutionary models of cytosolic NGLY1 deficiency, a consistent disruption of mitochondrial physiology was present involving modestly reduced mitochondrial content with more pronounced impairment of mitochondrial membrane potential, increased mitochondrial matrix oxidant burden, and reduced cellular respiratory capacity. Lentiviral rescue restored NGLY1 expression and mitochondrial physiology in human and mouse fibroblasts, confirming that NGLY1 directly influences mitochondrial function. Overall, cellular deglycosylation capacity is shown to be a significant factor in mitochondrial RC disease pathogenesis across divergent evolutionary species.

Keywords: C. Elegans; Fibroblasts; Glycosylation; Mitochondria; N-glycanase.


Conflict of interest statement

Conflicts of interest

The authors declare that they have no conflicts of interest with the contents of this article.

Figures

Fig. 1.
Fig. 1.. NGLY1 deficiency reduces C. elegans lifespan and human fibroblast survival with RC inhibition.
(A) Lifespan plot of RB1452 (png-1−/−) relative to N2 Bristol (wild-type) C. elegans strains at 20 °C. Animal number studied per strain is indicated in legend. Median lifespan was significantly reduced by 53% in RB1452 relative to N2 Bristol (p < 0.0001). Results of biological replicate lifespan analysis are shown in File S2. (B)NGLY1 disease patient fibroblasts (FCL-M1 and FCL-M2) displayed reduced cell viability relative to that of two healthy subject control human fibroblast lines (FCL-C1 and FCL-C2) after 72 h exposure to 25 nM rotenone. 1000 cells were studied per well in triplicate per condition, with 3 biological replicate experiments performed. *, p < 0.05.
Fig. 2.
Fig. 2.. NGLY1 expression and activity are reduced in human fibroblasts and MEF cells with NGLY1 mutations.
(A)NGLY1 relative gene expression was tested by qRT-PCR analysis in 2 healthy subject and 4 NGLY1 disease subject human fibroblast lines, with β32M used as endogenous control. ***, p < 0.001, n = 3 biological replicate experiments performed. (B) NGLY1 activity in MEF cells was evaluated with the ddVenus (deglycosylation-dependent Venus) Fluorescent substrate. NGLY1 enzyme activity was readily detected in wild-type (WT) MEF cells that microscopically displayed GFP signal, but no GFP signal was present in NGLY1-knockout (PK) fibroblasts. Results are representative of 3 independent experiments.
Fig. 3.
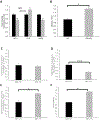
Fig. 3.. Mitochondrial physiologic parameters relative quantitation in NGLY1-deficient C. elegans, MEFs, and human fibroblasts.
(A) In vivo fluorescence microscopic analysis of relative mitochondrial content (MTG), mitochondrial membrane potential (TMRE), and mitochondrial oxidative burden (MitoSox) in NGLY1 deficient mutant (RB1542) and wild-type (N2 Bristol) C. elegans. n = 3 biological replicate experiments performed. (B) MitoSOX fluorescence was normalized to total mitochondrial content in RB1542 and wild-type C. elegans. n = 3 biological replicate experiments performed. (C–F) FACS analysis of mitochondrial physiology in NGLY1-deficient and wild-type (WT) MEFs, in 100,000 cells per condition. MEF-WT and MEF-PK mitochondrial content (MTG) (C), mitochondrial membrane potential (TMRE) (D) and mitochondrial superoxide burden (MitoSOX) (E) are shown, as well as relative superoxide burden normalized to mitochondrial content (F). n = 3 biological replicate experiments performed per condition. (G–J) FACS analysis of mitochondrial physiology in NGLY1-deficient and healthy control human fibroblasts, in 100,000 cells per condition. Human fibroblast line mitochondrial content (MTG) (G), mitochondrial membrane potential normalized to mitochondrial content (TMRE/MTG) (H), mitochondrial superoxide burden (I), and mitochondrial superoxide burden normalized to mitochondrial content (MitoSOX/MTG) (J) are shown, with individual cell line identified by labels detailed in Table 1. Bars in all panels represent mean and standard error of mean fluorescence intensities in three biological replicate experiments normalized to the average fluorescence measured in the control cell line. Differences between groups were statistically analyzed by Student’s t-test (two-way, unequal variance). *, p < 0.05; **, p < 0.01; ***, p < 0.001.
Fig. 4.
Fig. 4.. NGLY1 deficient MEF and human fibroblast cells have reduced mitochondrial respiratory capacity.
Mean oxygen consumption rates (OCR) were quantified in intact cells corresponding to basal (routine, representing complex I–V integrated respiratory capacity), leak (oligomycin-inhibited, representing non-mitochondrial oxygen consumption), and maximal (FCCP-uncoupled, representing complex I-IV respiratory capacity of the electron transport system) states. Bar graphs convey mean and standard error for oxygen (O2) consumption rate per cell across 3 biological experiments performed. (A)NGLY1 deficient MEFs (MEF-PK) had 16.5% reduced maximal oxygen consumption capacity relative to MEF-WT control cells. *, p < 0.05. (B) NGLY1 disease human fibroblasts (FCL-M2) had 25.7% reduced basal and 22.6% reduced maximal oxygen consumption capacity relative to wild-type control (FCL–C2). *, p < 0.05.
Fig. 5.
Fig. 5.. NGLY1 expression in lentiviral-rescued MEF Ngly1−/− cells.
MEF-PK and MEF-WT cells were each Infected with either NGLY1-cDNA or control empty lentiviral cDNA vector, with puromycln resistance and GFP fluorescence used to monitor viral Infection and gene expression. (A) GFP expression of lentiviral vectors In MEF-WT (left panel) and MEF-PK (right panel) cell lines. FACS-sorted cells were collected in groups representing dim (D, blue line) and bright (B, red line) fluorescent populations based on their relative GFP signal intensity. (B) NGLY1 expression level determined by qRT-PCR and expressed as fold-change relative to non-transfected control line in empty vector (V) pLenti-NGLY1-GFP (PK-N-D = dim; PK-N-B = bright) cells, n = 3 biological replicate experiments performed. ***, p < 0.001. (For interpretation of the references to colour in this figure legend, the reader is referred to the web version of this article.)
Fig. 6.
Fig. 6.. Ectopic NGLY1 expression rescued mitochondrial physiology alterations in NGLY1 deficient MEFs and human fibroblasts.
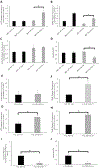
(A–D) FACS analysis of mitochondrial physiology in Ngly1 deficient (MEF-PK) and wild-type (MEF-WT) each transfected with empty vector and pLenti-NGLY1-CMV in 100,000 cells per condition. In all four MEF lines, mitochondrial content (MTR) (A), mitochondrial membrane potential (TMRE) (B), mitochondrial superoxide burden (MitoSOX) (C), and relative mitochondrial superoxide burden normalized to mitochondrial content (MitoSox/MTR) (D) are shown. (E-K) In two different NGLY1 deficient human fibroblast lines (FCL-M1 and FCL-M2), FACS analysis was performed to quantify relative mitochondrial content (MTR) (E, G), mitochondrial membrane potential (TMRE) (F, H), mitochondrial oxidant burden (MitoSOX) (I), and mitochondrial oxidant burden normalized for mitochondrial content (J) in fibroblasts from both subjects with plenti-NGLY1-CMV cDNA vector, empty vector, or non-transfected control cells. Results in all panels are expressed as mean fluorescence intensity ± standard error of the mean. 3 biological replicate experiments were performed per fluorescent dye and cell line. Differences between groups were statistically analyzed by Student’s t-test (two-way, unequal variance). *, p < 0.05.
Fig. 7.
Fig. 7.. Ectopic NGLY1-expression rescued mitochondrial respiratory capacity in NGLY1 deficient human fibroblasts.
Mean oxygen consumption rates (OCR) in basal, leak, and maximal states were quantified by high-resolution respirometry, as detailed in Fig. 4 Legend, for two NGLY1 disease subject human lines (FCL-M1 and FCL-M2, with mutations as detailed in Table 1), comparing empty vector control (panels A and D) transfected cells to pLenti-NGLY1-CMV cDNA vector transfected cells (panels B and E). The bar graphs in panels C and F indicate the mean and standard error oxygen consumption rate across three biological experiments performed per cell line. *, p < 0.05; **, p < 0.01.

Similar articles

Cited by

References

    1. Caglayan AO, Comu S, Baranoski JF, Parman Y, Kaymakcalan H, Akgumus GT, Caglar C, Dolen D, Erson-Omay EZ, Harmanci AS, Mishra-Gorur K, Freeze HH, Yasuno K, Bilguvar K, Gunel M, 2015. NGLY1 mutation causes neuromotor impairment, intellectual disability, and neuropathy. Eur. J. Med. Genet 58, 39–43. - PMC - PubMed
    1. Chantret I, Moore SE, 2008. Free oligosaccharide regulation during mammalian protein N-glycosylation. Glycobiology 18, 210–224. - PubMed
    1. Chantret I, Fasseu M, Zaoui K, Le Bizec C, Yaye HS, Dupre T, Moore SE, 2010. Identification of roles for peptide: N-glycanase and endo-beta-N-acetylglucosaminidase (Engase1p) during protein N-glycosylation in human HepG2 cells. PLoS One 5, e11734. - PMC - PubMed
    1. Dingley S, Polyak E, Lightfoot R, Ostrovsky J, Rao M, Greco T, Ischiropoulos H, Falk MJ, 2010. Mitochondrial respiratory chain dysfunction variably increases oxidant stress in Caenorhabditis Elegans. Mitochondrion 10, 125–136. - PMC - PubMed
    1. Dingley S, Chapman KA, Falk MJ, 2012. Fluorescence-activated cell sorting analysis of mitochondrial content, membrane potential, and matrix oxidant burden in human lymphoblastoid cell lines. Methods Mol. Biol 837, 231–239. - PMC - PubMed

Publication types

MeSH terms

Substances

Supplementary concepts

LinkOut - more resources