

Glycolytic Enzymes Coalesce in G Bodies under Hypoxic Stress
- PMID: 28746874
- PMCID: PMC5586494
- DOI: 10.1016/j.celrep.2017.06.082
Glycolytic Enzymes Coalesce in G Bodies under Hypoxic Stress
Abstract
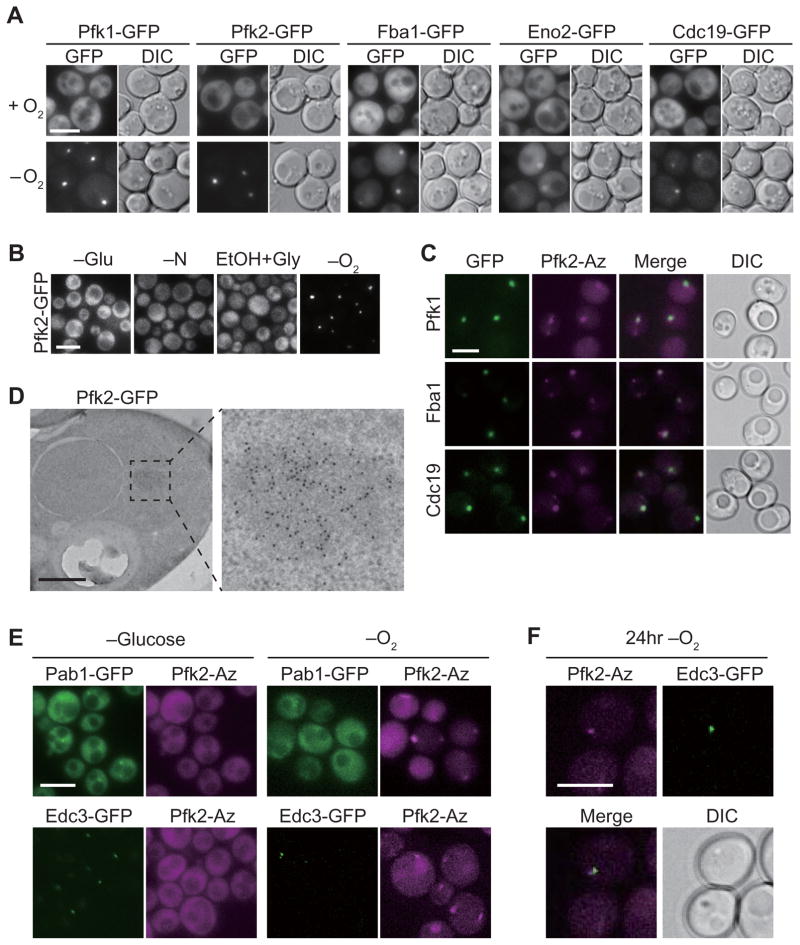
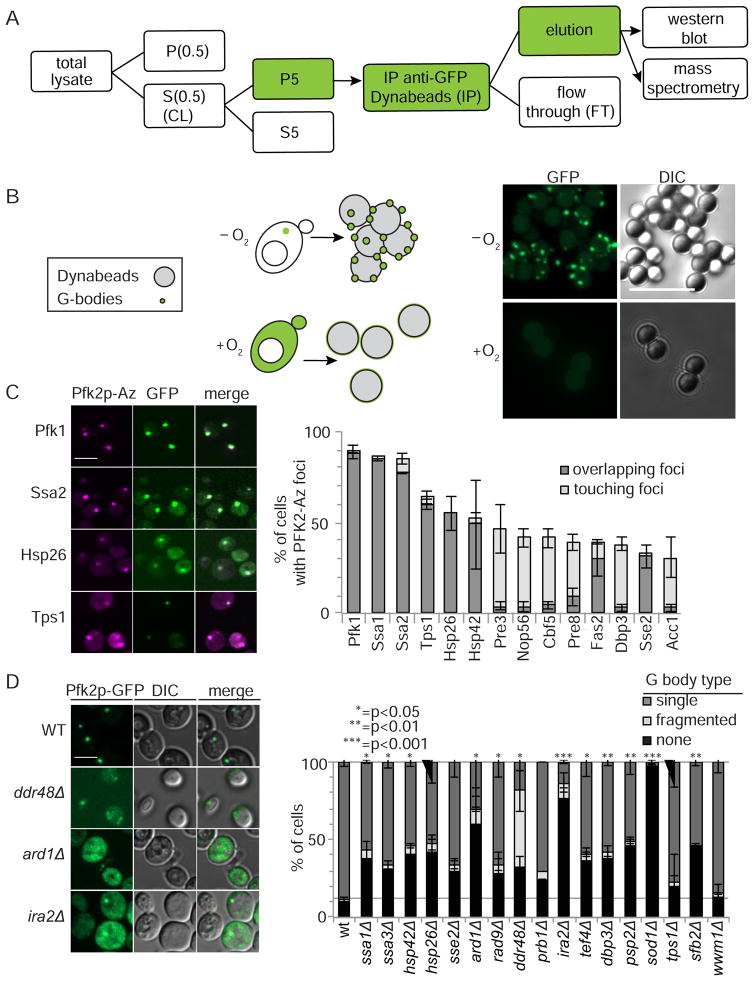
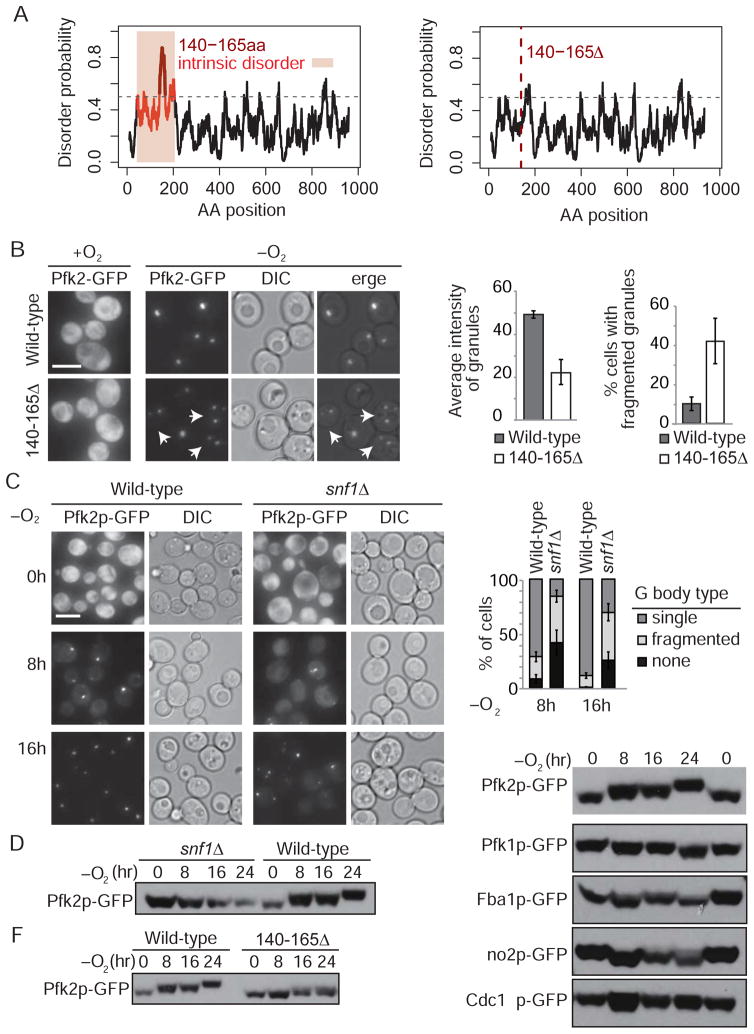
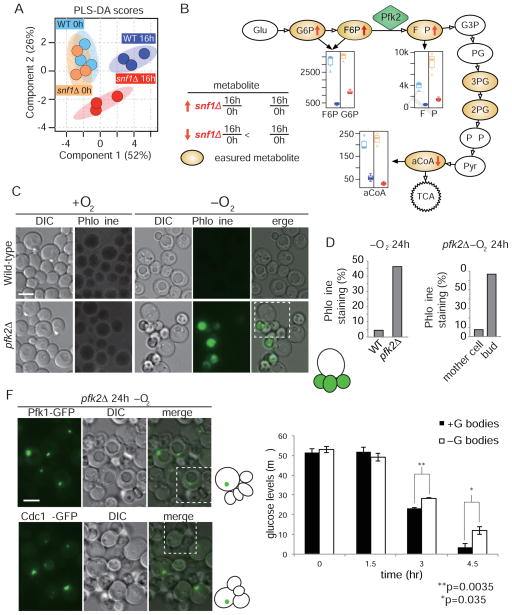
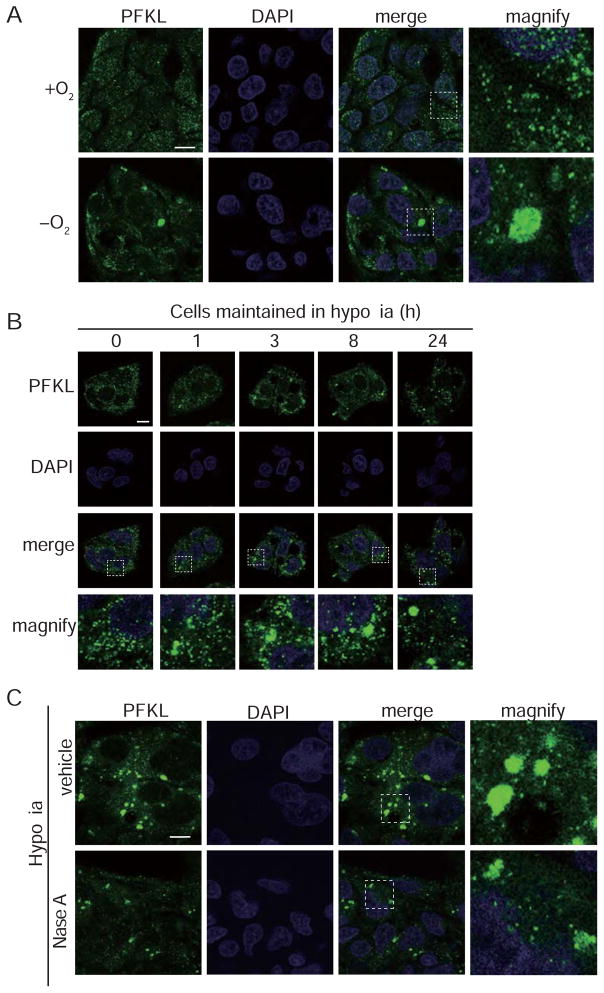
Glycolysis is upregulated under conditions such as hypoxia and high energy demand to promote cell proliferation, although the mechanism remains poorly understood. We find that hypoxia in Saccharomyces cerevisiae induces concentration of glycolytic enzymes, including the Pfk2p subunit of the rate-limiting phosphofructokinase, into a single, non-membrane-bound granule termed the "glycolytic body" or "G body." A yeast kinome screen identifies the yeast ortholog of AMP-activated protein kinase, Snf1p, as necessary for G-body formation. Many G-body components identified by proteomics are required for G-body integrity. Cells incapable of forming G bodies in hypoxia display abnormal cell division and produce inviable daughter cells. Conversely, cells with G bodies show increased glucose consumption and decreased levels of glycolytic intermediates. Importantly, G bodies form in human hepatocarcinoma cells in hypoxia. Together, our results suggest that G body formation is a conserved, adaptive response to increase glycolytic output during hypoxia or tumorigenesis.
Keywords: RNA binding protein; RNA granule; glycolysis; hypoxia; intrinsically disordered region; phase transitions.
Copyright © 2017 The Authors. Published by Elsevier Inc. All rights reserved.
Figures
Similar articles
-
RNA promotes phase separation of glycolysis enzymes into yeast G bodies in hypoxia.Elife. 2020 Apr 16;9:e48480. doi: 10.7554/eLife.48480. Elife. 2020. PMID: 32298230 Free PMC article.
-
Effect of hypoxia on the activity and binding of glycolytic and associated enzymes in sea scorpion tissues.Braz J Med Biol Res. 1998 Aug;31(8):1059-67. doi: 10.1590/s0100-879x1998000800005. Braz J Med Biol Res. 1998. PMID: 9777012
-
Compartmentalization and metabolic regulation of glycolysis.J Cell Sci. 2021 Oct 15;134(20):jcs258469. doi: 10.1242/jcs.258469. Epub 2021 Oct 20. J Cell Sci. 2021. PMID: 34668544 Free PMC article. Review.
-
Resistance to hypoxia-induced necroptosis is conferred by glycolytic pyruvate scavenging of mitochondrial superoxide in colorectal cancer cells.Cell Death Dis. 2013 May 2;4(5):e622. doi: 10.1038/cddis.2013.149. Cell Death Dis. 2013. PMID: 23640464 Free PMC article.
-
Analysis of hypoxia-induced metabolic reprogramming.Methods Enzymol. 2014;542:425-55. doi: 10.1016/B978-0-12-416618-9.00022-4. Methods Enzymol. 2014. PMID: 24862279 Review.
Cited by
-
TGF-β-Upregulated Lnc-Nr6a1 Acts as a Reservoir of miR-181 and Mediates Assembly of a Glycolytic Complex.Noncoding RNA. 2022 Sep 15;8(5):62. doi: 10.3390/ncrna8050062. Noncoding RNA. 2022. PMID: 36136852 Free PMC article.
-
A novel viral strategy for host factor recruitment: The co-opted proteasomal Rpn11 protein interaction hub in cooperation with subverted actin filaments are targeted to deliver cytosolic host factors for viral replication.PLoS Pathog. 2021 Jun 23;17(6):e1009680. doi: 10.1371/journal.ppat.1009680. eCollection 2021 Jun. PLoS Pathog. 2021. PMID: 34161398 Free PMC article.
-
Core Fermentation (CoFe) granules focus coordinated glycolytic mRNA localization and translation to fuel glucose fermentation.iScience. 2021 Jan 19;24(2):102069. doi: 10.1016/j.isci.2021.102069. eCollection 2021 Feb 19. iScience. 2021. PMID: 33554071 Free PMC article.
-
Hypoxia-inducible factor-driven glycolytic adaptations in host-microbe interactions.Pflugers Arch. 2024 Sep;476(9):1353-1368. doi: 10.1007/s00424-024-02953-w. Epub 2024 Apr 4. Pflugers Arch. 2024. PMID: 38570355 Free PMC article. Review.
-
LncRNA and Protein Expression Profiles Reveal Heart Adaptation to High-Altitude Hypoxia in Tibetan Sheep.Int J Mol Sci. 2023 Dec 27;25(1):385. doi: 10.3390/ijms25010385. Int J Mol Sci. 2023. PMID: 38203557 Free PMC article.
References
-
- An S, Kumar R, Sheets ED, Benkovic SJ. Reversible compartmentalization of de novo purine biosynthetic complexes in living cells. Science. 2008;320:103–106. - PubMed
-
- Anderson P, Kedersha N. RNA granules: post-transcriptional and epigenetic modulators of gene expression. Nature Reviews Molecular Cell Biology. 2009;10:430–436. - PubMed
-
- Atsumi T, Chesney J, Metz C, Leng L, Donnelly S, Makita Z, Mitchell R, Bucala R. High expression of inducible 6-phosphofructo-2-kinase/fructose-2,6-bisphosphatase (iPFK-2; PFKFB3) in human cancers. Cancer Research. 2002;62:5881–5887. - PubMed
Publication types
MeSH terms
Substances
Grants and funding
LinkOut - more resources
Full Text Sources
Other Literature Sources
Molecular Biology Databases
Research Materials
