. 2017 Aug;19(8):952-961.
doi: 10.1038/ncb3573. Epub 2017 Jul 24.

Tissue-specific CTCF-cohesin-mediated chromatin architecture delimits enhancer interactions and function in vivo

Affiliations

Tissue-specific CTCF-cohesin-mediated chromatin architecture delimits enhancer interactions and function in vivo

Lars L P Hanssen et al. Nat Cell Biol. 2017 Aug.

Abstract

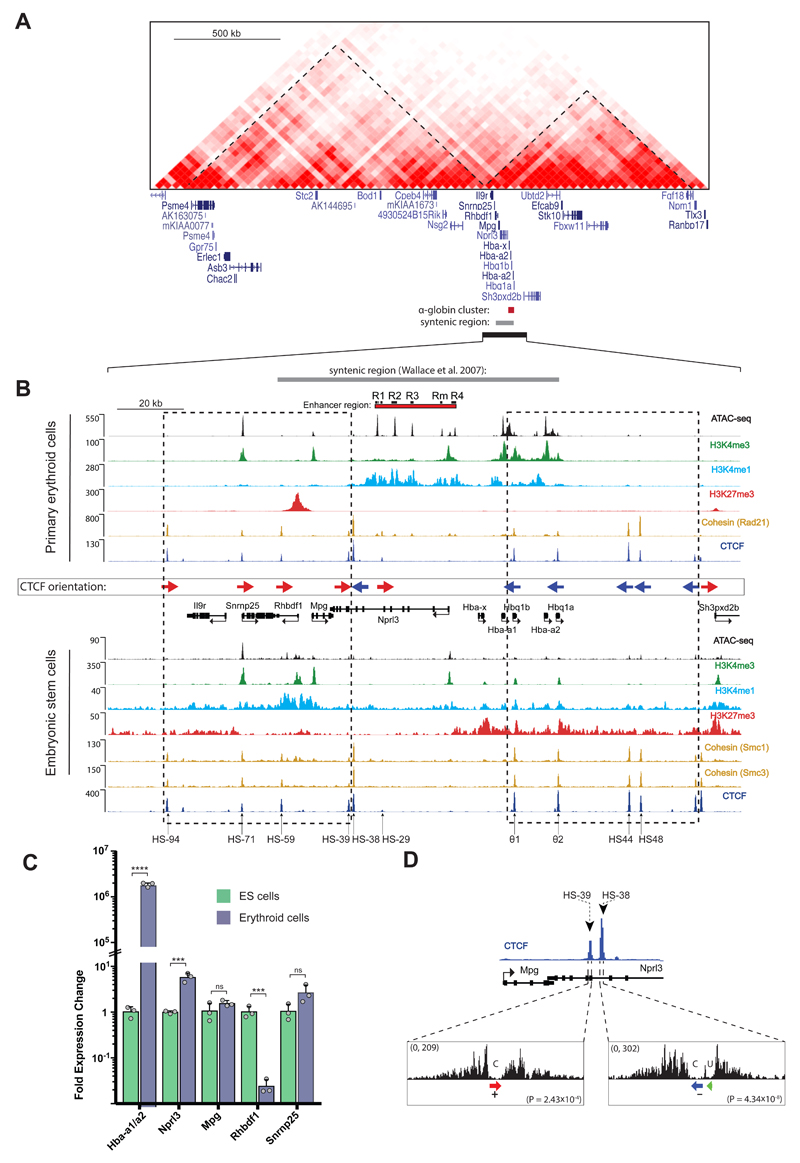
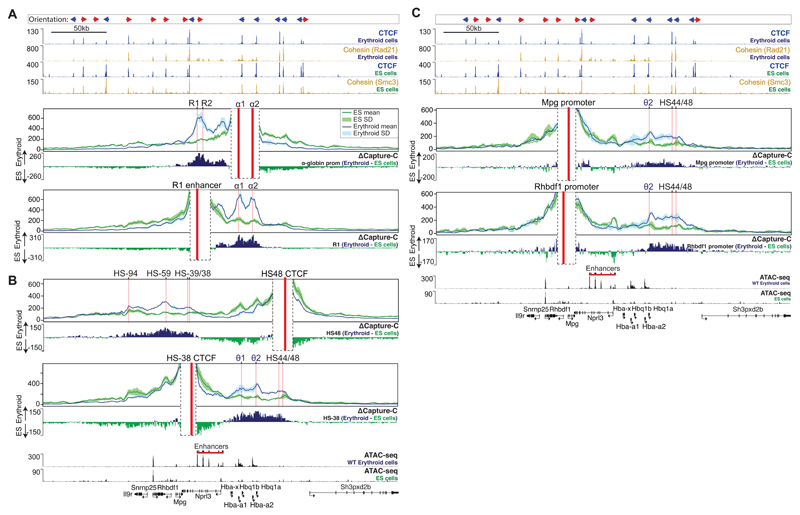
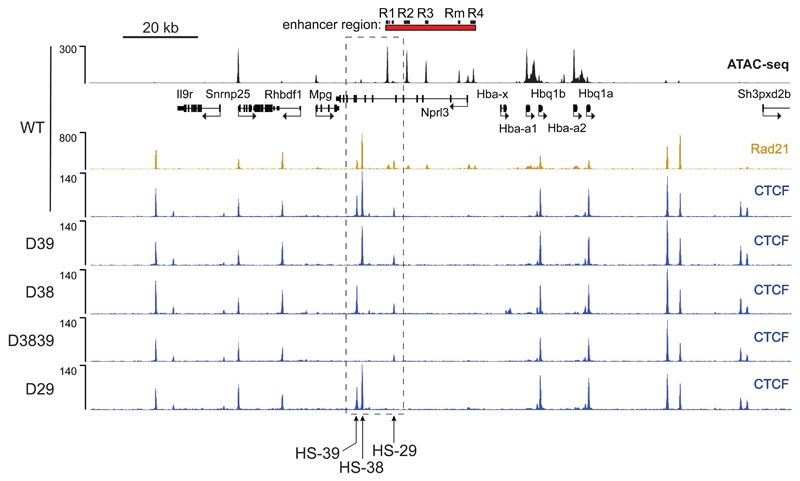
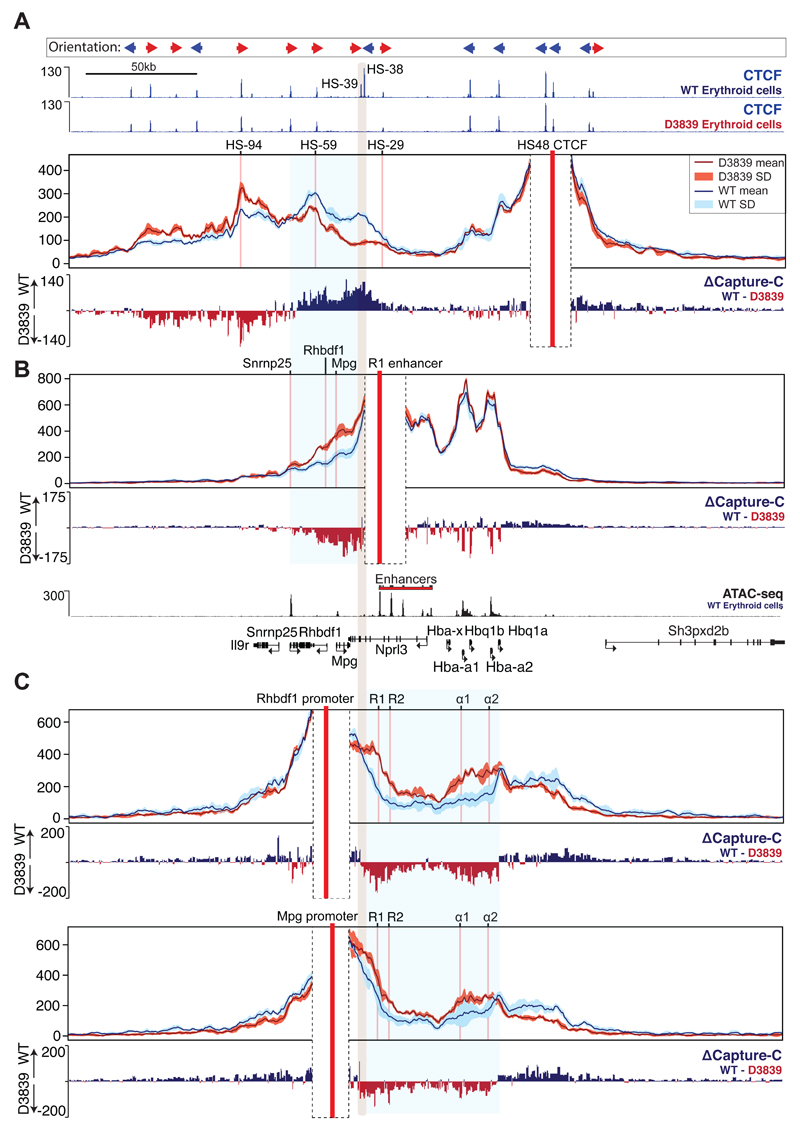
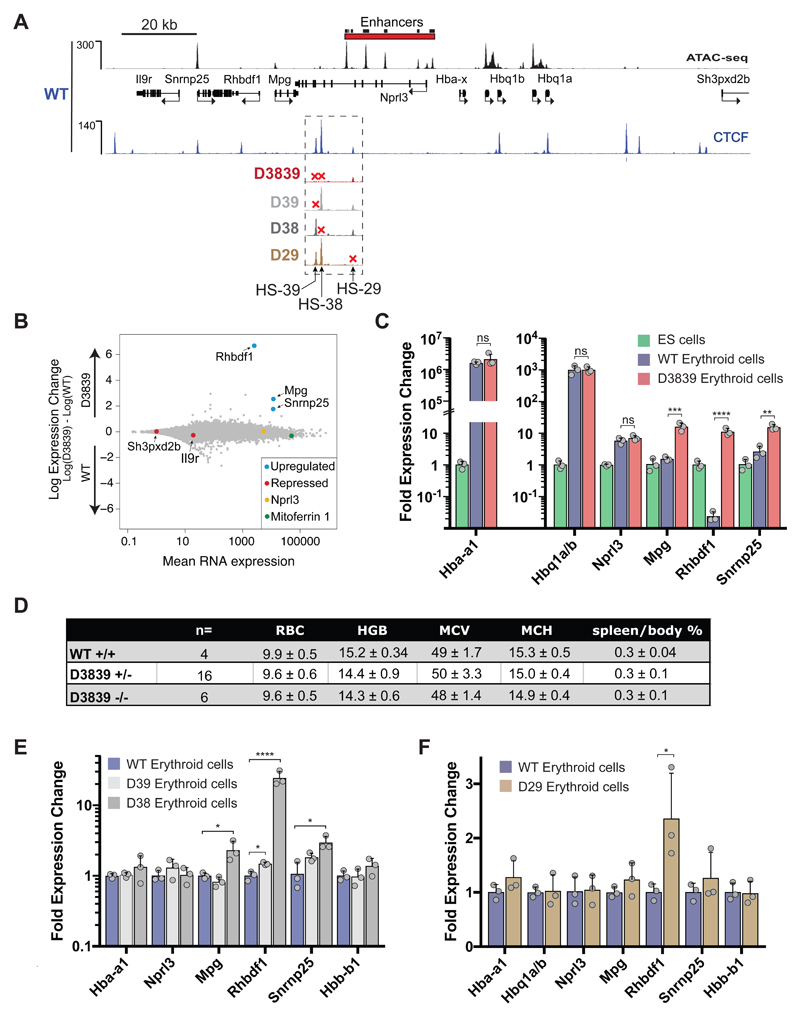
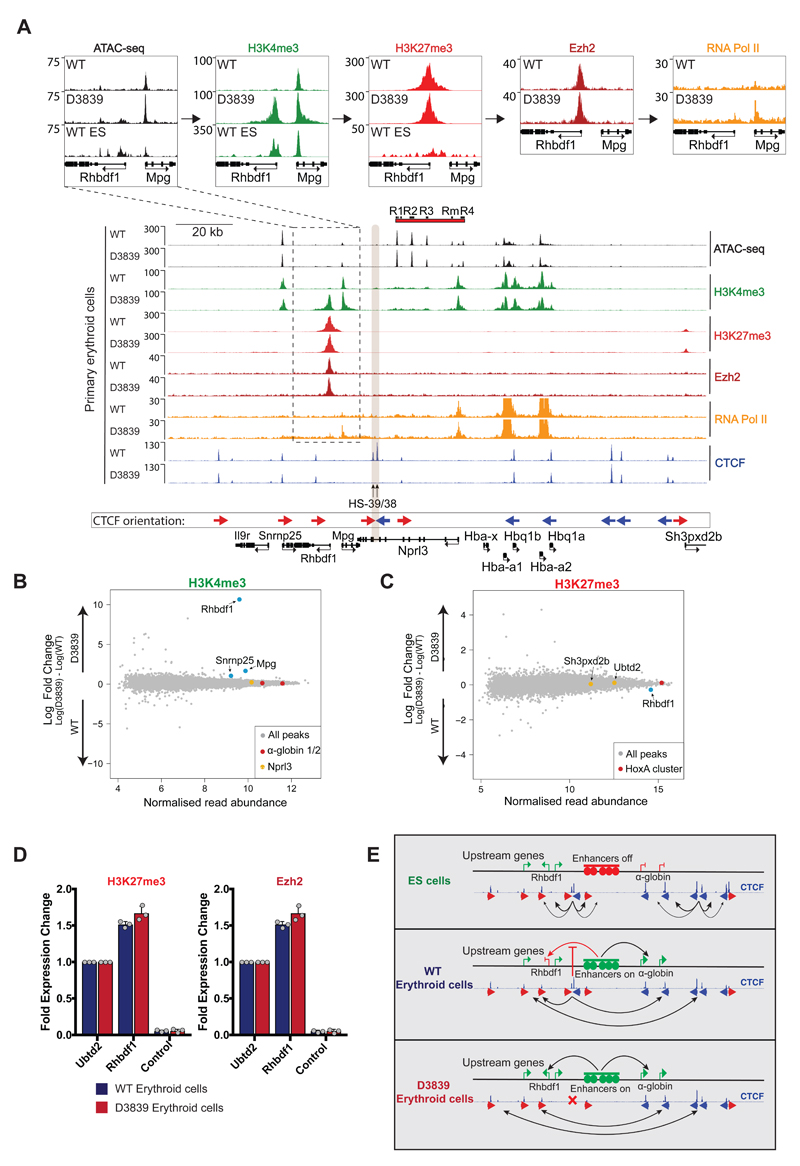
The genome is organized via CTCF-cohesin-binding sites, which partition chromosomes into 1-5 megabase (Mb) topologically associated domains (TADs), and further into smaller sub-domains (sub-TADs). Here we examined in vivo an ∼80 kb sub-TAD, containing the mouse α-globin gene cluster, lying within a ∼1 Mb TAD. We find that the sub-TAD is flanked by predominantly convergent CTCF-cohesin sites that are ubiquitously bound by CTCF but only interact during erythropoiesis, defining a self-interacting erythroid compartment. Whereas the α-globin regulatory elements normally act solely on promoters downstream of the enhancers, removal of a conserved upstream CTCF-cohesin boundary extends the sub-TAD to adjacent upstream CTCF-cohesin-binding sites. The α-globin enhancers now interact with the flanking chromatin, upregulating expression of genes within this extended sub-TAD. Rather than acting solely as a barrier to chromatin modification, CTCF-cohesin boundaries in this sub-TAD delimit the region of chromatin to which enhancers have access and within which they interact with receptive promoters.


Conflict of interest statement

Competing financial interests

The authors have no competing financial interests

Figures

Figure 1
Figure 1. Regulation of the α-globin cluster in mouse ES and primary erythroid cells.
A. Heat map of Hi-C chromatin interactions surrounding the α-globin gene cluster in mouse ES cells. TADs are annotated by dashed lines as defined by Dixon et al. 2012. Gene annotation is Refseq. B. The α-globin locus with enhancer elements (R1, R2, R3, Rm, and R4), gene promoters and CTCF binding sites marked by peaks of open chromatin as indicated by ATAC-seq tracks (RPKM) in mouse ES and primary erythroid cells. All normalised ChIP-seq read-densities (RPKM) represent an average of 2 independent experiments, in which 2 animals (erythroid cells) or 2 biologically independent samples (ES cells) were analysed in total, except for ES and erythroid H3K4me1 which represent single experiments. CTCF binding orientation is annotated with forward (red arrows) and reverse (blue arrows). Dashed boxes indicate clusters of convergent CTCF binding sites. Gene annotation is Refseq. The following datasets were previously published: ES SMC1 and SMC3; erythroid H3K4me3; ES CTCF, H3K27me3, H3K4me1; ES H3K4me3; ES ATAC-seq. C. Relative gene expression of mouse primary erythroid versus ES cells measured by real-time qPCR and representing n=3 independent experiment in which animals (erythroid cells) or n=3 biologically independent samples (ES cells) were analysed in total [AU: OK?]. Bars represent the mean and the error bars represent the standard deviation (S.D.). Grey dots represent individual data points. P-values are obtained via an unpaired, two-tailed student t-test. ns P>0.05, *** P<0.001, **** P<0.0001. D. DNaseI footprints of HS-38 and HS-39 CTCF binding sites. CTCF motifs are indicated by arrows; red arrow: forward core motif, blue arrow: reverse core motif, and green arrow: upstream motif. P-values indicate the significance of the match of the HS-38 and HS-39 sequence to the core consensus motif (derived with the FIMO tool as described41). The DNaseI data was previously published in Hosseini et al (2013).
Figure 2
Figure 2. Differential interactions of α-globin regulatory elements between mouse ES and primary erythroid cells.
A. Panels show overlaid, normalised Capture-C data for the α-globin promoter (α1, α2) and the R1 enhancer viewpoints in mouse ES and primary erythroid cells merged from 3 independent experiments, in which 3 animals (erythroid cells) or 3 biologically independent samples (ES cells) were analysed in total. Each of the α-globin promoters interacts with the enhancers independently, resulting in the expression of both genes (α1, α2),. The mean, plus and minus one standard deviation (S.D.), of sliding 5kb windows are visualised. Differential tracks (ΔCapture-C) show a subtraction (erythroid - ES) of the mean number of meaningful interactions per restriction fragment. Red vertical bars indicate the position of the viewpoint. Also shown are normalised CTCF and Cohesin (Rad21 or Smc3) ChIP-seq (RPKM) and ATAC-seq (RPKM) tracks for both ES and primary erythroid cells, all merged from 2 independent experiments, in which 2 animals were analysed in total. Gene annotation is Refseq. B. Data presented as described in A for HS48 and HS-38 CTCF site viewpoints. C. As described in A, data for Mpg and Rhbdf1 promoter viewpoints.
Figure 3
Figure 3. Disruption of CTCF binding motifs results in loss of CTCF binding at the α-globin locus in primary erythroid cells derived from mutant mice.
ATAC-Seq (RPKM) in wild-type (WT) primary erythroid cells shows chromatin accessibility across the α-globin locus. Local genes (Refseq) and the α-globin enhancers are annotated. Normalised CTCF ChIP-seq reads (RPKM, 2 independent experiments in which 2 animals were analysed in total) across the α-globin locus are shown for WT and each of the generated CTCF binding site mutants; D39: HS-39 mutant, D38: HS-38 mutant, D3839: combined HS-38 and HS-39 mutant, D29: HS-29 mutant. Also shown is normalised Rad21 ChIP-seq (RPKM, 2 independent experiments in which 2 animals were analysed in total) for WT primary erythroid cells. The dashed box indicates the genomic region within which the generated CTCF binding mutations are located.
Figure 4
Figure 4. Differential interactions of α-globin regulatory regions and flanking genes between wild-type and D3839 primary erythroid cells.
Capture-C data for the indicated viewpoints (red vertical bars) in wild-type (WT) and CTCF mutant D3839 primary erythroid cells are shown as described in Fig 2A. Data represent 3 independent experiments in which 3 animals were used in total. Differential tracks (ΔCapture-C) show a subtraction (WT - D3839) of the mean number of normalised meaningful interactions per restriction fragment. Mutated CTCF sites are indicated with a shaded grey vertical bar. Also shown are normalised CTCF ChIP-seq (RPKM) for both WT and D3839 primary erythroid cells and ATAC-seq (RPKM) for WT erythroid cells, all merged from 2 independent experiments in which 2 animals were used in total. Gene annotation is Refseq. A. HS48 CTCF viewpoint. The shaded blue box indicates a chromatin region with altered CTCF-CTCF interactions B. R1 enhancer viewpoint. The shaded blue box indicates altered R1 enhancer interactions. C. Rhbdf1 and Mpg promoter viewpoints. The shaded blue box highlights the chromatin region with altered interactions.
Figure 5
Figure 5. Effects of individual and combined CTCF binding site deletions near the α-globin enhancers on local gene expression in primary erythroid cells.
A. The α-globin locus annotated with enhancer elements and genes (Refseq). Shown are normalised ATAC-seq (RPKM) data for WT and CTCF ChIP-seq (RPKM) for indicated WT and mutant mouse erythroid cells merged from 2 independent experiments in which 2 animals were analysed in total. B. MA plot of RNA-seq data derived from WT and D3839 primary erythroid cells. Data represent n=3 independent experiments in which 3 animals were analysed in total. Mean RNA abundance is plotted on the x-axis and enrichment is plotted on the y-axis. Significant upregulation of local genes in the D3839 mutant is highlighted in blue and was calculated using a Wald test (DEseq2): Snrnp25: P=1.46e-46, Rhbdf1: P<9.99e-99, Mpg: P=6.71e-64. Controls are indicated in different colours: Mitoferrin-1 (Slc25a37, green), a highly expressed erythroid gene; Sh3pxd2b and Il9r (red), repressed in erythroid cells; Nprl3 (yellow), a housekeeping gene within the α-globin locus, unaffected by deletions. C. Relative gene expression in WT and D3839 erythroid cells versus ES cells was measured by real-time qPCR. Data represent n=3 independent experiments in which 3 animals (erythroid cells) or 3 biologically independent samples (ES cells) were analysed in total. Bars represent the mean and the error bars represent the standard deviation (S.D.). Grey dots represent individual data points. P-values are obtained with an unpaired, two-tailed student t-test. ns P>0.05, * P<0.05, ** P<0.01, *** P<0.001, **** P<0.0001. For significance of gene expression changes between ES and WT erythroid cells, see Fig 1C. D. Table summarising the haematological parameters of erythroid cells in WT and D3839 mutant mice. RBC = red blood cell count, HGB = haemoglobin count, MCV = mean corpuscular volume (fL), MCH = mean corpuscular haemoglobin (g/dl), Spleen/body% = spleen weight as a percentage of body weight, WT+/+ = wild-type, D3839+/- = heterozygous for D3839, D3839-/- = homozygous for D3839. E. Relative gene expression in D38 and D39 versus WT erythroid cells (as in Fig. 5C, n=3 independent experiments in which 3 animals were analysed in total). F. Relative gene expression in WT vs D29 erythroid cells (as in Fig. 5C, n=3 independent experiments in which 3 animals were analysed in total). No substantial difference in expression of local genes is detected (Rhbdf1: P=0.03, unpaired, two-tailed student t-test).
Figure 6
Figure 6. Effects of combined deletion of HS-38 and HS-39 on the local chromatin state in primary erythroid cells.
A. Normalised ATAC-seq and ChIP-seq read-densities (RPKM; 2 independent experiments in which 2 animals were analysed in total) for H3K4me3, H3K27me3, Ezh2, RNA Pol II, and CTCF at the α-globin locus, both in WT and D3839 primary erythroid cells. Shaded grey bar indicates the position of HS-38 and HS-39. The dashed box highlights the region over the Rhbdf1 and Mpg genes, magnified in top panels for ease of data visualisation. B. MA plot of H3K4me3 ChIP-seq data derived from WT and D3839 erythroid cells (2 independent experiments in which 2 animals were analysed in total). Mean read abundance is plotted on the x-axis and enrichment on the y-axis. Changes in H3K4me3 detected as indicated on the plot by the genes highlighted in blue: Snrnp25: FDR<0.1, Rhbdf1: FDR<0.05, Mpg: FDR<0.05. Controls are shown in red (α-globin promoters) and yellow (Nprl3, unaffected by the combined disruption of HS-38 and HS-39). The FDR was calculated with the Diffbind package using DEseq2. C. MA plot of H3K27me3 ChIP-seq data (2 independent experiments in which 2 animals were analysed in total) derived from WT and D3839 erythroid cells. Mean read abundance is plotted on the x-axis and enrichment on the y-axis. Highlighted on the plot are Ubtd2 and Sh3pxd2b (yellow), Polycomb-repressed genes directly downstream of the α-globin cluster, and the HoxA cluster (red) as a control. Rhbdf1 (blue) is unchanged (FDR=0.19). The FDR was calculated with the Diffbind package using DEseq2. D. ChIP-qPCR for H3K27me3 and Ezh2 in WT and D3839 primary erythroid cells (n=3 independent experiments in which 3 animals were analysed in total). Grey dots represent individual data points. Data displayed as fold change relative to Ubtd2, a Polycomb-repressed gene within 200kb downstream of the α-globin cluster. An amplicon within the Nprl3 gene is used as an α-globin locus control. No significant changes are detected by two-tailed student t-test. E. Model for α-globin cluster gene regulation. Interactions between clusters of flanking CTCF sites prevent contacts between the α-globin enhancers and upstream genes from forming. Upon deletion of HS-38 and HS-39 CTCF binding sites (D3839), CTCF interactions shift towards more distally located upstream sites, allowing bidirectional α-globin enhancer interactions and upregulation of upstream genes.

Similar articles

Cited by

References

    1. Ghirlando R, Felsenfeld G. CTCF: making the right connections. Genes Dev. 2016;30:881–891. - PMC - PubMed
    1. Nichols MH, Corces VG. A CTCF Code for 3D Genome Architecture. Cell. 2015;162:703–705. - PMC - PubMed
    1. Bonev B, Cavalli G. Organization and function of the 3D genome. Nat Rev Genet. 2016;17:661–678. - PubMed
    1. Weth O, et al. CTCF induces histone variant incorporation, erases the H3K27me3 histone mark and opens chromatin. Nucleic Acids Research. 2014;42:11941–11951. - PMC - PubMed
    1. Cuddapah S, et al. Global analysis of the insulator binding protein CTCF in chromatin barrier regions reveals demarcation of active and repressive domains. Genome Research. 2008;19:24–32. - PMC - PubMed

MeSH terms