. 2017 Jul 21;2(13):eaal5068.
doi: 10.1126/sciimmunol.aal5068.

Helicobacter species are potent drivers of colonic T cell responses in homeostasis and inflammation

Affiliations

Helicobacter species are potent drivers of colonic T cell responses in homeostasis and inflammation

Jiani N Chai et al. Sci Immunol. .

Abstract

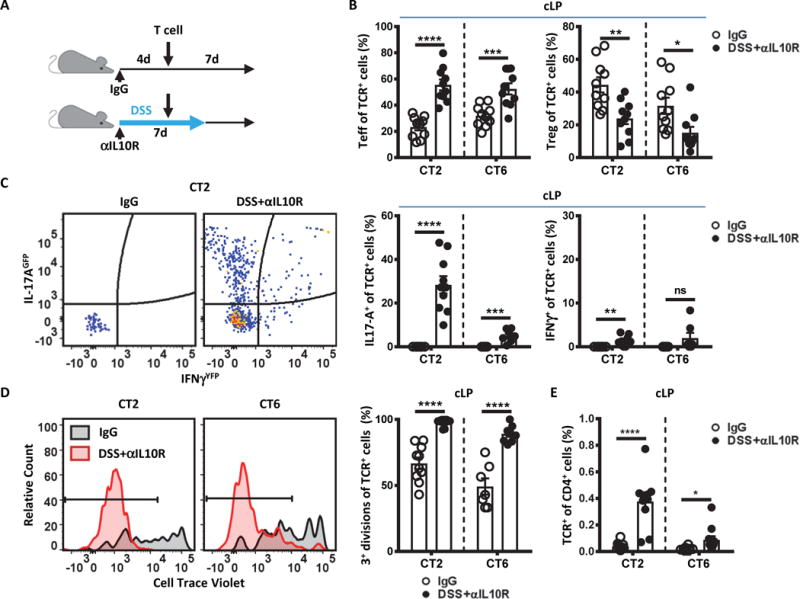
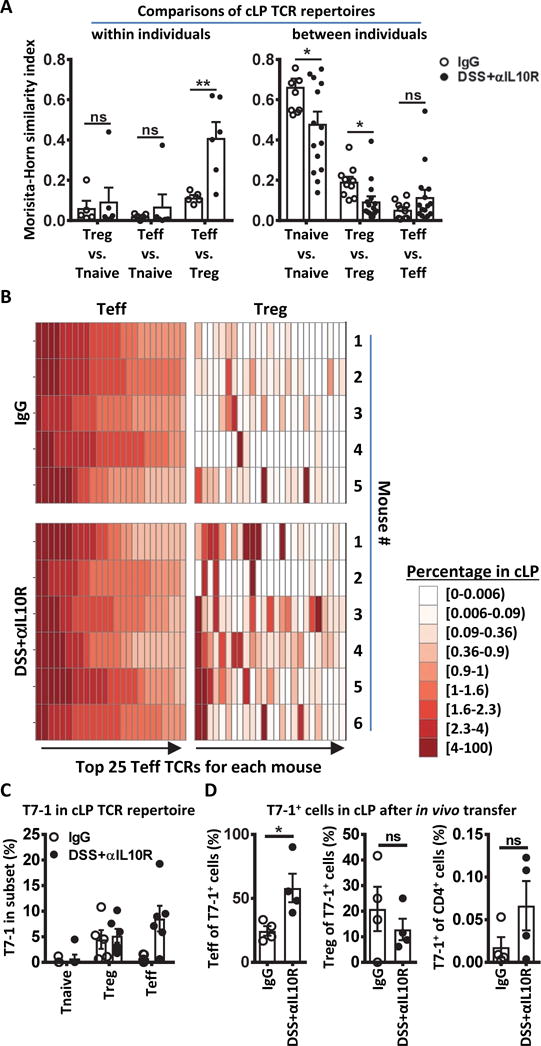
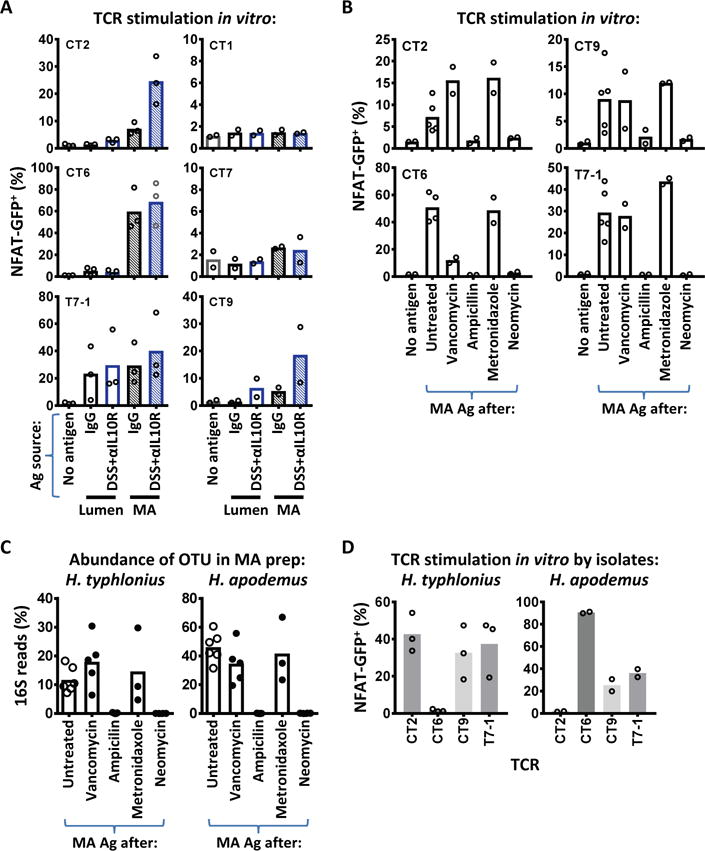
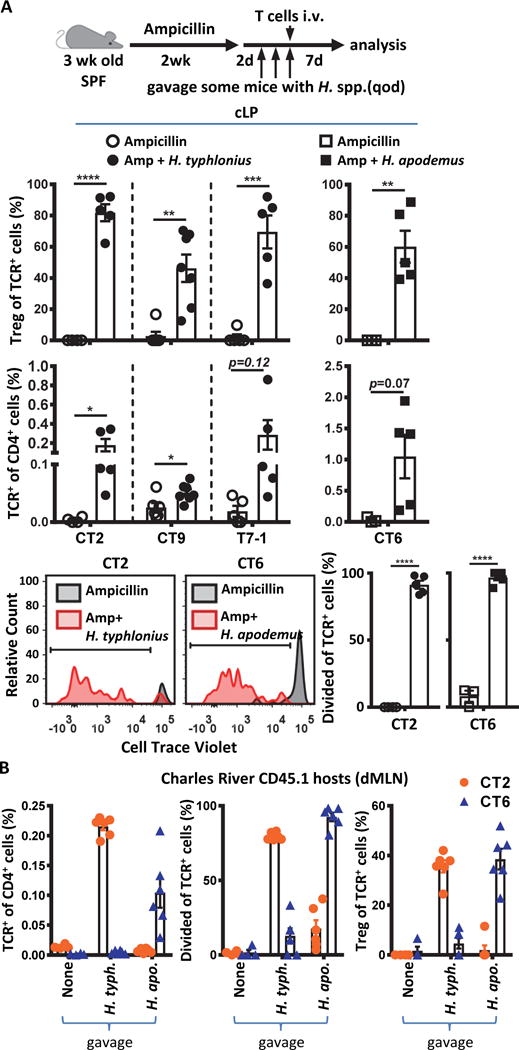
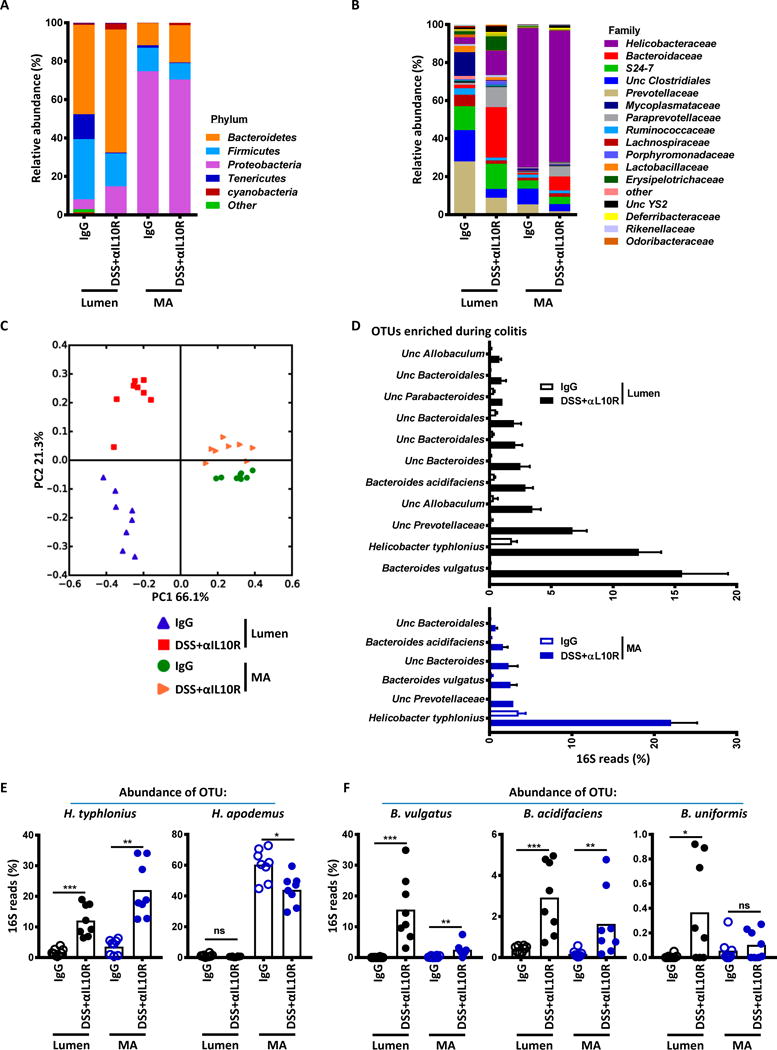
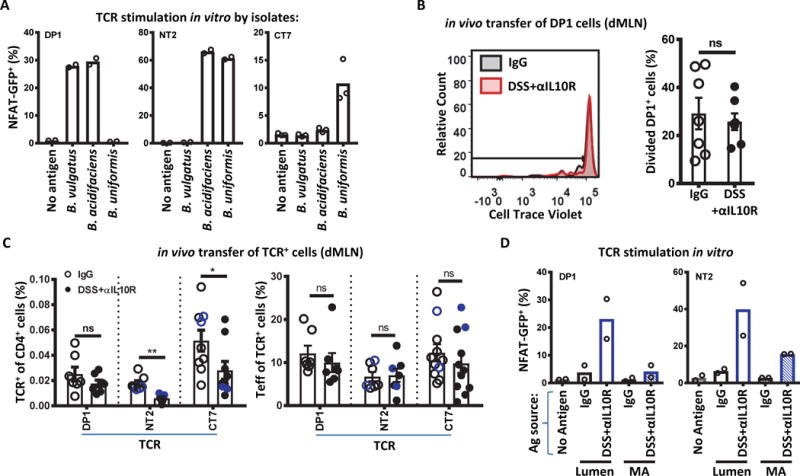
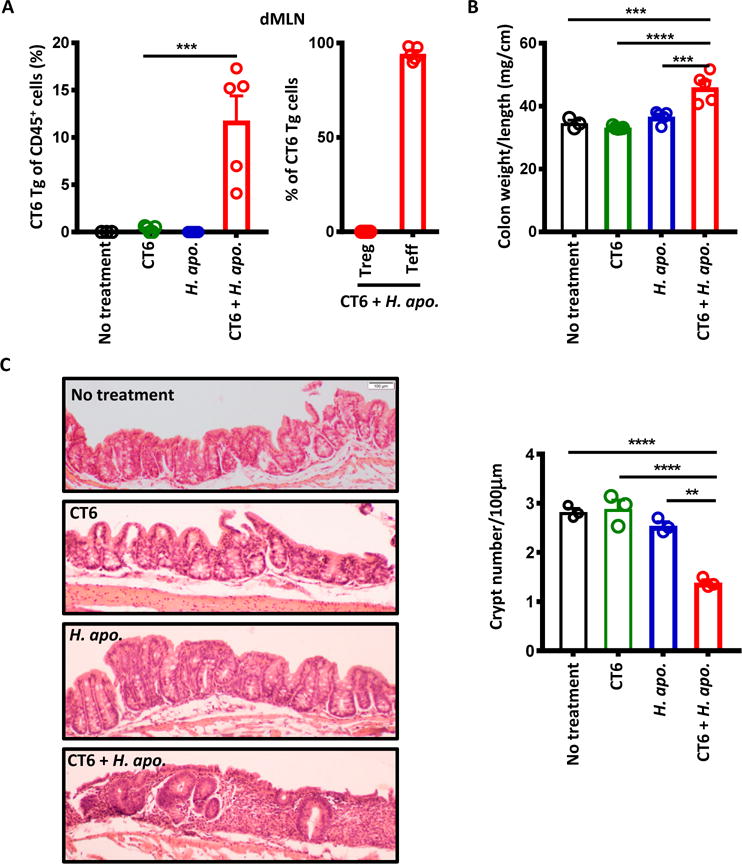
Specific gut commensal bacteria improve host health by eliciting mutualistic regulatory T (Treg) cell responses. However, the bacteria that induce effector T (Teff) cells during inflammation are unclear. We addressed this by analyzing bacterial-reactive T cell receptor (TCR) transgenic cells and TCR repertoires in a murine colitis model. Unexpectedly, we found that mucosal-associated Helicobacter species triggered both Treg cell responses during homeostasis and Teff cell responses during colitis, as suggested by an increased overlap between the Teff/Treg TCR repertoires with colitis. Four of six Treg TCRs tested recognized mucosal-associated Helicobacter species in vitro and in vivo. By contrast, the marked expansion of luminal Bacteroides species seen during colitis did not trigger a commensurate Teff cell response. Unlike other Treg cell-inducing bacteria, Helicobacter species are known pathobionts and cause disease in immunodeficient mice. Thus, our study suggests a model in which mucosal bacteria elicit context-dependent Treg or Teff cell responses to facilitate intestinal tolerance or inflammation.


Conflict of interest statement

Competing interests

The authors declare that they have no competing interests.

Figures

Fig. 1
Fig. 1. Colonic Treg TCRs (CT2 and CT6) drive effector T cell development in inflammation
(A) Experimental model. CD45.1 4–5 week old SPF mice were administered αIL10R (1 mg/mouse) on day 0 and kept on 1% DSS water for 7 days to initiate colitis. Control mice were given isotype IgG (1 mg/mouse) on day 0. Four days after initiation of colitis, congenically marked naïve CT2/CT6 Tg cells (105) were intravenously transferred and analyzed 7 days later. (B to D) Effector cell induction and expansion with colitis. Transferred TCR Tg cells from the colon lamina propria (cLP) were analyzed by flow cytometry for (B) development of Teff (CD44hi CD62Llo Foxp3) and Treg (Foxp3+) makers (p=0.000003; 0.0007; 0.0024; 0.0157; n=10; Student’s t-test); (C) upregulation of cytokines using IL-17AGFP and IFNγYFP (p=0.000001; 0.0007; 0.0029; n=10 for CT2; n=7 for CT6; Student’s t-test); (D) proliferation indicated by Cell Trace Violet (CTV) dilution (p=0.000002; 0.00002; n=10 for CT2; n=7, 8 for CT6; Student’s t-test); and (E) expansion indicated by the in vivo frequency amongst the host CD4+ T cells (p=0.00005; 0.0275; n=10 for CT2; n=10, 11 for CT6; Student’s t-test). Bars indicate mean ± SEM. *p < .05, **p < .01, ***p < .001, ****p < .0001.
Fig. 2
Fig. 2. Treg and Teff subsets show increased TCR overlap during colitis
(A to C) Analysis of TCRα repertoires from Tnaive (CD44lo CD62hi), Treg (Foxp3+), and Teff (CD44hi CD62Llo) cells in the cLP of TCli TCRβ Foxp3IRES-Thy1.1 Tcra+/− mice 2 weeks after initiation of IgG or DSS+αIL10R. n=5, 6. (A) Morisita–Horn similarity comparison between two different T cell subsets within each mouse (left) or between different mice within each T cell subset (right). An index value of 1 indicates that the two samples are completely similar and an index value of 0 means they are completely dissimilar (left: p=0.009; n=5,6; right: p=0.033; 0.014; n=10,15; Student’s t-test). (B) Heatmap showing the top 25 Teff TCRs in one mouse per row and their corresponding percentage in the Treg subset. Note that each column does not represent one TCR across all mice. (C) Percentage of T7-1 TCR in repertoire of Tnaive, Treg, and Teff subsets. Each dot represents data from an individual mouse. (D) In vivo analysis of T7-1 TCR. T7-1 was retrovirally transduced into in vitro activated naïve TCliβ Rag1−/− Tg cells and 2×10⁵ cells were transferred into IgG or DSS+αIL10R hosts as indicated in Fig. 1A. Seven days post-transfer, cells from the cLP were analyzed by flow cytometry for Teff and Treg cells, and the in vivo frequency amongst the host CD4+ T cells (p=0.029; n=4; Student’s t-test). Bars indicate mean ± SEM. *p < .05, **p < .01, ***p < .001, ****p < .0001.
Fig. 3
Fig. 3. Colonic Treg TCRs react to mucosal-associated Helicobacter species
(A) Treg TCRs preferentially react to mucosal-associated antigens (Ag). Hybridoma cells expressing different TCRs were cultured with CD11c+ dendritic cells and the indicated Ag obtained 2 weeks after initiation of colitis. NFAT-GFP upregulation was assessed by flow cytometry 1.5 days later. (B) Selective elimination of MA Ag using individual antibiotics. TCRs from (A) that react to MA Ag were stimulated with colonic MA Ags isolated from antibiotic-treated or untreated mice as per (A). (C) Changes in H. typhlonius and H. apodemus OTUs correlate with in vitro reactivity to MA Ag in (B). Data shown are the percentage of 16S OTUs from the MA preparations of individual antibiotic-treated or untreated mice. (D) In vitro recognition of H. typhlonius or apodemus. Cultured isolates were tested for TCR reactivity in vitro as per (A). 2–3 independent experiments. Bars indicate mean.
Fig. 4
Fig. 4
Helicobacter species induce peripheral Treg cell differentiation during homeostasis. (A) In vivo validation of TCR reactivity to Helicobacter species. 3 week old SPF mice were treated with ampicillin (amp) for 2 weeks via drinking water. Two days after the last treatment, H. typhlonius or H. apodemus were gavaged 3 times total every other day. With the last gavage, congenically marked naïve CT2/CT6 Tg cells or retrovirally expressed CT9/T7-1 cells were transferred. Seven days post transfer, cLP cells were analyzed by flow cytometry for (top) development of Treg (Foxp3+) cells (p=0.000003; 0.001; 0.0002; 0.0046; n=4, 5 for CT2; n=6, 7 for CT9; n=5 for T7-1; n=3, 5 for CT6; Student’s t-test); (middle) frequency of transferred TCR-expressing cells amongst the host CD4+ T cells (p=0.0442; 0.021; 0.0046;0.0705; n=4, 5 for CT2; n=6, 7 for CT9; n=5 for T7-1; n=3, 5 for CT6; Student’s t-test); or (bottom) CTV dilution (p=0.00000002; 0.0000007; n=4, 5 for CT2; n=3, 5 for CT6; Student’s t-test). (B) T cell response to Helicobacter in vivo is species-specific. Three week old SPF mice obtained from Charles River Laboratories were gavaged with H. typhlonius or H. apodemus (3 times total every other day). With the last gavage, congenically marked naïve CT2 and CT6 Tg cells (105 each) were co-transferred. One week post-transfer, cells from the dMLN were analyzed by flow cytometry for the frequency of transferred TCR-expressing cells amongst the host CD4+ T cells (left); CTV dilution (middle); or development of Treg (Foxp3+) cells (right) (n=4, 6, 6). Bars indicate mean ± SEM. *p < .05, **p < .01, ***p < .001, ****p < .0001.
Fig. 5
Fig. 5. DSS+αIL10R colitis is associated with differential changes of bacterial composition in the lumen and mucosa
(A to D)16S rRNA sequencing of colonic lumen contents or MA preparations 2 weeks after initiation of IgG or DSS+αIL10R. n=8. Data shown are mean bacterial changes at the phyla (A) or family (B) level, and principal coordinates analysis on unweighted UniFrac distances (C). (D) Bacteria enriched during colitis. Shown are OTUs enriched in DSS+αIL10R mice with average percentage >1% and Benjamini-Hochberg adjusted p value <0.05 (Mann-Whitney U) from lumen contents or MA preparations. (E) Increase of H. typhlonius in the mucosa with colitis. Percentages of H. typhlonius and H. apodemus OTUs are shown (Benjamini-Hochberg adjusted p value: p=0.0009; 0.0023; 0.0277; n=8; Mann-Whitney U test). (F) Marked expansion of Bacteroides species in the lumen with colitis. Percentages of B. vulgatus, B. acidifaciens, and B. uniformis OTUs are shown (Benjamini-Hochberg p=0.0009; 0.0086; 0.0009; 0.0086; 0.0266; n=8; Mann-Whitney U test). Bars indicate mean ± SEM. *p < .05, **p < .01, ***p < .001, ****p < .0001.
Fig. 6
Fig. 6. Expansion of Bacteroides species during colitis does not enhance TCR-specific T cell responses
(A) Antigenic reactivity of Bacterioides-reactive TCRs used. In vitro stimulation by the Bacteroides isolates are shown as per Fig. 3A. 2–3 independent experiments. (B and C) In vivo expansion and effector cell development of Bacteroides-reactive T cells. Congenically marked naïve DP1 Tg cells (105) were transferred into CD45.1 hosts as indicated in Fig. 1A, and analyzed 7 days post-transfer by flow cytometry for (B) CTV dilution in the dMLN (n=7), (C, left) frequency amongst the host CD4+ T cells (p=0.0005; 0.047; n=7 for DP1 and NT2; n=9 for CT7; Student’s t-test), and (C, right) development of Teff (CD44hi CD62Llo Foxp3) (n=7 for DP1 and NT2; n=11 for CT7; Student’s t-test). NT2 and CT7 (C) were retrovirally transduced into in vitro activated naïve Vα2 TCliβ Tg cells from Rag1+/− (black) or Rag1−/− (blue) mice before transfer of 2×10⁵ cells. (D) In vitro reactivity to in vivo Ag preparations is consistent with Bacteroides expansion by 16S rRNA analysis. Colonic lumen contents or MA preparations from IgG or DSS+αIL10R mice were tested as per Fig. 3A. 2 independent experiments. Bars indicate mean ± SEM. *p < .05, **p < .01, ***p < .001, ****p < .0001.
Fig. 7
Fig. 7. Pathogenic potential of naive Helicobacter-reactive CT6 cells in lymphopenic mice
Six week old Rag1−/− mice were given H. apo. with or without naïve CT6 T cell transfer. H. apo. was gavaged 3 times total every other day. Naïve CT6 cells (105) was transferred at the time of last gavage. (A) Flow cytometry analysis for the frequency of Tg cells amongst the host CD45+ cells (one-way ANOVA, Turkey’s post-hoc test: p=0.0002 CT6 vs CT6+H. apo.; n=3, 5, 5, 5), and development of Treg (Foxp3+) and Teff (CD44hi CD62Llo Foxp3) markers (n=5) in dMLN at 6 weeks. (B) Colon weight/length ratio at 6 weeks (one-way ANOVA with Turkey’s post-hoc test: p=0.0003 No treatment vs CT6+H. apo.; 0.00002 CT6 vs CT6+H. apo.; 0.0005 H. apo. vs CT6+H. apo.; n=3, 5, 5, 5). (C) Representative haematoxylin/eosin-stained section of the ascending colon at 6 weeks (original magnification ×10), and quantification of crypt number (one-way ANOVA with Tukey’s post-hoc test: p=0.00007 No treatment vs CT6+H. apo.; 0.00005 CT6 vs CT6+H. apo.; 0.0003 H. apo. vs CT6+H. apo.; n=3). The number of crypts observed per 100μm of ascending colon was averaged from five fields. Decreased crypt number reflect crypt dropout due to inflammation. Bars indicate mean ± SEM. *p < .05, **p < .01, ***p < .001, ****p < .0001.

Similar articles

Cited by

References

    1. Honda K, Littman DR. The microbiota in adaptive immune homeostasis and disease. Nature. 2016;535:75–84. - PubMed
    1. Belkaid Y, Hand TW. Role of the microbiota in immunity and inflammation. Cell. 2014;157:121–141. - PMC - PubMed
    1. Hooper LV, Littman DR, Macpherson AJ. Interactions between the microbiota and the immune system. Science. 2012;336:1268–1273. - PMC - PubMed
    1. Wlodarska M, Kostic AD, Xavier RJ. An integrative view of microbiome-host interactions in inflammatory bowel diseases. Cell Host Microbe. 2015;17:577–591. - PMC - PubMed
    1. Kamada N, Seo SU, Chen GY, Nunez G. Role of the gut microbiota in immunity and inflammatory disease. Nat Rev Immunol. 2013;13:321–335. - PubMed