Changes in the extracellular matrix surrounding human chronic wounds revealed by 2-photon imaging
- PMID: 28730726
- PMCID: PMC7949728
- DOI: 10.1111/iwj.12789
Changes in the extracellular matrix surrounding human chronic wounds revealed by 2-photon imaging
Abstract
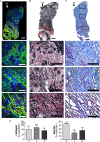
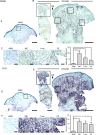
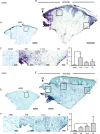
Chronic wounds are a growing problem worldwide with no effective therapeutic treatments available. Our objective was to understand the composition of the dermal tissue surrounding venous leg ulcers and diabetic foot ulcers (DFU). We used novel 2-photon imaging techniques alongside classical histology to examine biopsies from the edges of two common types of chronic wound, venous leg ulcers and DFU. Compared to normal intact skin, we found that collagen levels are significantly reduced throughout the dermis of venous leg ulcer biopsies and DFU, with a reduction in both fibril thickness and abundance. Both wound types showed a significant reduction in elastin in the upper dermis, but in DFU, the loss was throughout the dermis. Loss of extracellular matrix correlated with high levels of CD68- and CD18-positive leukocytes. 2-photon imaging of the extracellular matrix in the intact tissue surrounding a chronic wound with a hand-held device may provide a useful clinical indicator on the healing progression or deterioration of these wounds.
Keywords: Chronic wounds; Extracellular matrix; Second harmonic imaging.
© 2017 Medicalhelplines.com Inc and John Wiley & Sons Ltd.
Figures


Similar articles
-
Extracellular matrix and cellular senescence in venous leg ulcers.Sci Rep. 2021 Oct 11;11(1):20168. doi: 10.1038/s41598-021-99643-9. Sci Rep. 2021. PMID: 34635751 Free PMC article.
-
Differences in cellular infiltrate and extracellular matrix of chronic diabetic and venous ulcers versus acute wounds.J Invest Dermatol. 1998 Nov;111(5):850-7. doi: 10.1046/j.1523-1747.1998.00381.x. J Invest Dermatol. 1998. PMID: 9804349 Clinical Trial.
-
Effect of healing on the expression of transforming growth factor beta(s) and their receptors in chronic venous leg ulcers.J Invest Dermatol. 2001 Nov;117(5):1282-9. doi: 10.1046/j.0022-202x.2001.01501.x. J Invest Dermatol. 2001. PMID: 11710945
-
Bilayered bioengineered skin substitute (Apligraf): a review of its use in the treatment of venous leg ulcers and diabetic foot ulcers.BioDrugs. 2002;16(6):439-55. doi: 10.2165/00063030-200216060-00005. BioDrugs. 2002. PMID: 12463767 Review.
-
A Review of Cellular and Acellular Matrix Products: Indications, Techniques, and Outcomes.Plast Reconstr Surg. 2016 Sep;138(3 Suppl):138S-147S. doi: 10.1097/PRS.0000000000002643. Plast Reconstr Surg. 2016. PMID: 27556754 Review.
Cited by
-
The Impact of Prolonged Inflammation on Wound Healing.Biomedicines. 2022 Apr 6;10(4):856. doi: 10.3390/biomedicines10040856. Biomedicines. 2022. PMID: 35453606 Free PMC article.
-
Label-free quantification of imaging features in the extracellular matrix of left and right-sided colon cancer tissues.Sci Rep. 2024 Mar 29;14(1):7510. doi: 10.1038/s41598-024-58231-3. Sci Rep. 2024. PMID: 38553551 Free PMC article.
-
Membrane curvature and connective fiber alignment in guinea pig round window membrane.Acta Biomater. 2021 Dec;136:343-362. doi: 10.1016/j.actbio.2021.09.036. Epub 2021 Sep 24. Acta Biomater. 2021. PMID: 34563725 Free PMC article.
-
Mechanism and application of fibrous proteins in diabetic wound healing: a literature review.Front Endocrinol (Lausanne). 2024 Jul 26;15:1430543. doi: 10.3389/fendo.2024.1430543. eCollection 2024. Front Endocrinol (Lausanne). 2024. PMID: 39129915 Free PMC article. Review.
-
Extracellular matrix and cellular senescence in venous leg ulcers.Sci Rep. 2021 Oct 11;11(1):20168. doi: 10.1038/s41598-021-99643-9. Sci Rep. 2021. PMID: 34635751 Free PMC article.
References
-
- Martin P. Wound healing‐‐aiming for perfect skin regeneration. Science 1997;276:75–81. - PubMed
-
- Mustoe T. Understanding chronic wounds: a unifying hypothesis on their pathogenesis and implications for therapy. Am J Surg 2004;187(5A):65S–70. - PubMed
-
- Martin P, Leibovich SJ. Inflammatory cells during wound repair: the good, the bad and the ugly. Trends Cell Biol 2005;15:599–607. - PubMed
MeSH terms
LinkOut - more resources
Full Text Sources
Other Literature Sources
Medical

