. 2017 Aug 2;95(3):531-549.e9.
doi: 10.1016/j.neuron.2017.06.029. Epub 2017 Jul 14.

Neural Circuit-Specialized Astrocytes: Transcriptomic, Proteomic, Morphological, and Functional Evidence

Affiliations

Neural Circuit-Specialized Astrocytes: Transcriptomic, Proteomic, Morphological, and Functional Evidence

Hua Chai et al. Neuron. .

Abstract

Astrocytes are ubiquitous in the brain and are widely held to be largely identical. However, this view has not been fully tested, and the possibility that astrocytes are neural circuit specialized remains largely unexplored. Here, we used multiple integrated approaches, including RNA sequencing (RNA-seq), mass spectrometry, electrophysiology, immunohistochemistry, serial block-face-scanning electron microscopy, morphological reconstructions, pharmacogenetics, and diffusible dye, calcium, and glutamate imaging, to directly compare adult striatal and hippocampal astrocytes under identical conditions. We found significant differences in electrophysiological properties, Ca2+ signaling, morphology, and astrocyte-synapse proximity between striatal and hippocampal astrocytes. Unbiased evaluation of actively translated RNA and proteomic data confirmed significant astrocyte diversity between hippocampal and striatal circuits. We thus report core astrocyte properties, reveal evidence for specialized astrocytes within neural circuits, and provide new, integrated database resources and approaches to explore astrocyte diversity and function throughout the adult brain. VIDEO ABSTRACT.

Keywords: Aldh1l1; Cre/ERT2; GCaMP; RNA-seq; astrocyte; calcium; diversity; hippocampus; proteomics; striatum.


Figures

Figure 1
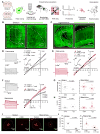
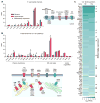
Figure 1. Astrocyte physiological similarities and differences in striatum and hippocampus
A. Approaches used to evaluate striatal and hippocampal astrocytes. B & C. Coronal sections of Aldh1l1-eGFP brains cleared using ScaleS and imaged using confocal microscopy. D & E. Whole-cell voltage-clamp was performed on d.l. striatal (D) and CA1 s.r. (E) astrocytes, before and in the presence of 300 μM Ba2+. Left: Example waveforms for total and Ba2+-insensitive currents. Right: Average current-voltage relations. Inset: Application of Ba2+ caused a reversible decrease in membrane current at −70 mV; the gap is when recording was paused for IVs. F. Ba2+-sensitive currents. G & H. Membrane conductance (G) and membrane potential (H) of d.l. striatal and CA1 s.r. astrocytes for control and in 300 μM Ba2+. I. Representative images of biocytin (30 min; red) filled astrocyte syncytium in the d.l. striatum and hippocampus CA1 s.r. with and without 100 μM CBX to block gap junctions. The white polygon delineates dye spread. J. The number of coupled eGFP positive astrocytes in control and in the presence of 100 μM CBX. Open circles are raw data with closed circles indicating mean ± s.e.m and a horizontal line for the median. In some cases, the error bars representing s.e.m are smaller than the symbol used for the mean.
Figure 2
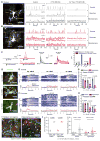
Figure 2. Properties of Ca2+ signals in striatal and hippocampal astrocytes
A–B. Left: Projections of GCaMP6f expressing d.l. striatal (A) and hippocampal CA1 s.r. (B) astrocytes; arrows indicate compartments with Ca2+ signals. Right: Representative traces of GCaMP6f dF/F for control, in 0.25 μM TTX, and in Ca2+ free extracellular buffers with TTX (Supp Fig 2). C. EFS of cortical input to the d.l. striatum and EFS of Schaffer-collaterals in the hippocampus CA1 s.r. evoked similar, but modest Ca2+ signals. Phenylephrine (PE) evoked large Ca2+ elevations. D. Example images of astrocytes co-expressing GCaMP6f (green) and each of the three mCherry-tagged DREADDs (red). E. Top: Kymographs of astrocyte somatic Ca2+ signals (GCaMP6f dF/F) upon activation of DREADDs with 1 μM CNO. Each row represents a single cell. Below: Average traces from d.l. striatal (grey) and hippocampal CA1 s.r. (red) astrocytes (n = 15–21 cells from 3–5 mice). F. As in E, but for astrocyte process Ca2+ signals. G & H. Average CNO-evoked fold-change in area under the curve for astrocyte somata (G) and processes (H). I. Representative images show hM4D (red) expressing astrocytes (green) with increased levels of c-Fos (cyan) 1 hr after 1 mg/kg CNO. J. The % of c-Fos positive astrocytes and the integrated c-Fos intensity. Raw data are shown with open circles; closed circles indicate the mean ± s.e.m. The median is shown with a line. Data were collected from 5–6 sections from 3 mice.
Figure 3
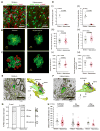
Figure 3. Comparison of d.l. striatal and hippocampal CA1 s.r. astrocyte morphology and proximity to synapses
A. Representative z-projection of Aldh1l1-eGFP d.l. striatum and hippocampus CA1 s.r. sections immunostained for GFP (green) and NeuN (red). B. Confocal volumes of Lucifer yellow filled astrocytes in wild-type mice. C. 3D-reconstructions of volumes enclosed by astrocyte territories (blue) and NeuN (red). D.i. The ratio of green astrocytes and red neurons quantified from confocal images as shown in A from 4 mice. ii. Number of neurons in a single astrocyte territory as determined by reconstructions in C. iii–vi. Astrocyte somata volume (iii), the number of primary branches (iv), astrocyte cell volume (v), and astrocyte territory volume (vi) compared for striatal and hippocampal astrocytes (n = 19–22 from 10–11 mice). E. Example of scanning electron microscopy (EM) image from the d.l. striatum with corresponding 3D rendering. The synaptic structures and closest astrocyte processes are colored as: yellow astrocytes, blue post-synaptic densities (PSDs), green axons, and pink spines. The center of the PSD is denoted with a red dot. F. As in E, but for hippocampus CA1 s.r. G. The types of excitatory spines were significantly different between striatum and hippocampus (Fisher’s test n = 138–139 PSDs; 3 mice). H. The distances between centers of the PSD and nearest astrocyte process are shown according to the spine type of the PSD. mushroom n = 27–75, thin n = 45–95, other n = 16–19 synapses. Open circles are raw data (3 mice) with closed circles indicating mean ± s.e.m and a horizontal line for the median. In some cases, the error bars representing s.e.m are smaller than the symbol used to show the mean.
Figure 4
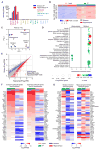
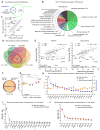
Figure 4. Comparison of adult striatal and hippocampal astrocyte transcriptomes
A. Gene expression levels (in fragments per kilobase per million; FPKM) of markers for astrocytes, neurons, oligodendrocytes, and microglia in IP samples (n = 4). B. Heatmap representing 16 RNA-Seq samples from 4 mice showing relative enrichment (red) or depletion (blue) of the top 100 adult cortical astrocyte markers. Row z-scores were calculated using FPKM. C. Striatal and hippocampal astrocyte principal component analysis of the 2000 most variable genes across 16 samples. D. Gene Set Enrichment Analysis with all genes sequenced in striatal and hippocampal IP sample (threshold q-value < 0.15) identified 21 gene sets enriched in striatal astrocytes and 4 gene sets enriched in hippocampal astrocytes. The size of the circle corresponds to the number of significant genes whereas the color indicates the significance of the regional enrichment based on normalized enrichment score (NES). E. Differential expression analysis comparing striatal and hippocampal IP samples identified 1180 striatal and 1638 hippocampal enriched astrocyte genes (threshold FDR < 0.05, Supp Excel file 1). F. FPKM heatmaps of the top 40 astrocyte genes that were not differentially expressed between regions as ranked by IP FPKM value. Log2(FPKM) ranged from 4.3 (blue, relatively low expression) to 13 (red, relatively high expression). G. FPKM heatmaps of the 40 most differentially expressed astrocyte genes between striatal and hippocampal astrocytes as ranked by differential expression LimmaVoom log ratio (FPKM > 0.1). The most highly expressed striatal astrocyte gene is Crym, and the most highly expressed hippocampal astrocyte gene is Gfap. Log2(FPKM) ranged from −7 (blue, relatively low expression) to 8 (red, relatively high expression).
Figure 5
Figure 5. RNA-Seq analyses of K+ channels, membrane Ca2+ flux pathways and Ca2+ binding proteins in striatal and hippocampal astrocytes
A. K+ channel RNAs that were expressed in astrocytes from striatum or hippocampus with an FPKM > 10. B. Ca+ channel, pump or exchanger RNAs that were expressed in astrocytes from striatum or hippocampus with an FPKM > 10. C. Heat map representing the average log2 FPKM values of the Ca2+ binding proteins (4 mice), defined by the presence of at least one EF-hand domain, found within striatal and hippocampal astrocytes. * indicates differential expression between striatal and hippocampal astrocytes using LimmaVoom analysis (FDR < 0.05).
Figure 6
Figure 6. Striatal and hippocampal astrocyte proteomes
A. Venn diagram of proteins and genes detected in astrocytes using proteomics and RNA-Seq. 3509 protein groups, corresponding to 3322 genes, were identified using low-stringency protein identification filters (FDR < 0.01, ΔCn < 0.05). From the 3322 genes, 2879 were expressed in astrocytes in transcriptomic data (FPKM > 0.1). B. Enrichr gene ontology (GO) analysis for “biological processes” of the 2879 genes common between proteomics and RNA-Seq (functionally related Enrichr GO terms were grouped together). C. Of 2879 genes common between proteomics and RNA-Seq, 2128 were detected in both hippocampus and striatum at the protein level. Scatter plot of relative protein abundance of these 2128 proteins in hippocampus and striatum shows a high correlation between the two regions, but also highlights differentially expressed proteins. D. Venn diagram of the number of protein groups identified in the 4 replicates using high-stringency filters. 143 proteins were found in four replicates. E. Scatter plot comparing RNA and protein abundance for the 143 proteins detected in the proteomics high-stringency dataset. Most of the proteins show correlation with RNA levels. However, a subset of proteins (grey filled circles) had high protein levels but low RNA expression (FPKM < 10). F. Venn diagram of the common, striatal enriched and hippocampal enriched proteins in the high-stringency dataset. Paired t-test analysis was used to determine the differentially expressed proteins between hippocampus and striatum. G. Hip/Str ratio distribution of the 143 proteins contained in F. Ratio of common proteins is significantly different from the proteins enriched in striatum or hippocampus (Kruskal-Wallis ANOVA with * P < 0.05 post hoc Dunn’s multiple comparison test). Crym and Gfap emerge as the most different among these proteins. H. Top 20 most abundant common astrocyte proteins. I. Striatum enriched proteins. J. Hippocampus enriched proteins. In panels H–J, * indicates genes that were also astrocyte enriched in the RNA-Seq data. In these panels, proteins are listed by their gene name. In some cases, the error bars representing s.e.m are smaller than the symbol used to show the mean.
Figure 7
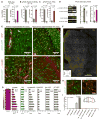
Figure 7. Validating GFAP and μ-crystallin expression in striatal and hippocampal astrocytes
A. RNA-Seq FPKM values for Crym and Gfap in striatum and hippocampus. B. qPCR of RNA from P63 Aldh1l1-cre/ERT2 x RiboTag mice for Crym and Gfap in striatum and hippocampus. C. qPCR of mRNA extracted P30 FACS astrocytes for Crym and Gfap in striatum and hippocampus. D. Western blot for μ-crystallin and GFAP from striatal and hippocampal FACS astrocytes, and quantification normalized to β-actin. E. IHC of GFAP and μ-crystallin in d.l. striatum and hippocampus CA1 s.r. of Aldh1l1-eGFP mice. In the striatum, a high proportion of astrocytes stain for μ-crystallin [arrows in E(iii)]. The spectrally separated images for panel E are shown in Supp Fig 8A. F. μ-crystallin immunostaining in striatum showing its spatial gradient (V = ventricle, Cc = corpus callosum, Ctx = cortex). G. Quantification of μ-crystallin, S100β, Kir4.1 and GLT1 signal intensity in Aldh1l1-eGFP mice along the dorso-ventral axis of the striatum. The signal was normalized to GFP signal. H. μ-crystallin immunostaining in dorso-lateral and ventro-medial striatum of Aldh1l1-eGFP mice. I. Quantification of μ-crystallin positive astrocytes in 9 brain areas.
Figure 8
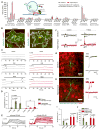
Figure 8. Assessing striatal and hippocampal astrocyte Ca2+-evoked glutamate exocytosis
A. Expression of known exocytosis genes in striatal and hippocampal RNA-Seq data (n = 4) were compared against known cell specific markers and housekeeping genes. One-sample t tests were run against the threshold of 10 FPKM. Inset: Schematic of the machinery involved in glutamate exocytosis. B. Example images of iGluSnFR (green) coexpressed with Gq-coupled DREADD hM3D (red) in astrocytes. White line indicates area analyzed for iGluSnFR fluorescence. C. Example traces from d.l. striatal (grey) and hippocampal CA1 s.r. (red) astrocytes of iGluSnFR dF/F in control conditions, with application of CNO (1 μM) to increase astrocyte Ca2+, or with application of 1 μM (3S)-3-[[3-[[4-(Trifluoromethyl)benzoyl]amino]phenyl]methoxy]-L-aspartic acid (TBOA) to block glutamate transporters. iGluSnFR flashes are indicated with arrows. D. The number of iGluSnFR flashes compared between control, +CNO, and +TBOA. E. iGluSnFR traces show increased fluorescence with bath application of 300 μM glutamate (1 μM TBOA; n = 12 cells per region from 4 mice). F. EFS-evoked (4 APs at 10 Hz) iGluSnFR signals recorded from d.l. striatal and hippocampal CA1 s.r. astrocytes under control conditions and in the presence of TBOA (n = 6 and 7 fields of view from 3 mice each). G. Left: A recorded striatal MSN as visualized by biocytin (green) surrounded by hM3D expressing astrocyte (red mCherry signal). Right: Example traces from neurons in voltage-clamp shows slow inward currents (SICs) at −70 mV. H. As in G, but for hippocampal CA1 pyramidal neurons. I & J. The frequency (I) and amplitude (J) of SICs per minute in 10 mins of control conditions and 10 mins with CNO. 0.25 μM TTX was present in all experiments.

Comment in

Similar articles

Cited by

References

    1. Anders S, Pyl PT, Huber W. HTSeq—a Python framework to work with high-throughput sequencing data. Bioinformatics. 2015;31:166–169. - PMC - PubMed
    1. Araque A, Carmignoto G, Haydon PG, Oliet SH, Robitaille R, Volterra A. Gliotransmitters travel in time and space. Neuron. 2014;81:728–739. - PMC - PubMed
    1. Araque A, Li N, Doyle RT, Haydon PG. SNARE protein-dependent glutamate release from astrocytes. J Neurosci. 2000;20:666–673. - PMC - PubMed
    1. Arellano JI, Benavides-Piccione R, DeFelipe J, Yuste R. Ultrastructure of dendritic spines: correlation between synaptic and spine morphologies. Frontiers in Neuroscience. 2007;1:131–143. - PMC - PubMed
    1. Bazargani N, Attwell D. Astrocyte calcium signalling: the third wave. Nat Neurosci. 2015 accepted. - PubMed