. 2017 Jun 26:7:127.
doi: 10.3389/fonc.2017.00127. eCollection 2017.

Enhancing the Oncolytic Activity of CD133-Targeted Measles Virus: Receptor Extension or Chimerism with Vesicular Stomatitis Virus Are Most Effective

Affiliations

Enhancing the Oncolytic Activity of CD133-Targeted Measles Virus: Receptor Extension or Chimerism with Vesicular Stomatitis Virus Are Most Effective

Dina Kleinlützum et al. Front Oncol. .

Abstract

Therapy resistance and tumor recurrence are often linked to a small refractory and highly tumorigenic subpopulation of neoplastic cells, known as cancer stem cells (CSCs). A putative marker of CSCs is CD133 (prominin-1). We have previously described a CD133-targeted oncolytic measles virus (MV-CD133) as a promising approach to specifically eliminate CD133-positive tumor cells. Selectivity was introduced at the level of cell entry by an engineered MV hemagglutinin (H). The H protein was blinded for its native receptors and displayed a CD133-specific single-chain antibody fragment (scFv) as targeting domain. Interestingly, MV-CD133 was more active in killing CD133-positive tumors than the unmodified MV-NSe despite being highly selective for its target cells. To further enhance the antitumoral activity of MV-CD133, we here pursued arming technologies, receptor extension, and chimeras between MV-CD133 and vesicular stomatitis virus (VSV). All newly generated viruses including VSV-CD133 were highly selective in eliminating CD133-positive cells. MV-CD46/CD133 killed in addition CD133-negative cells being positive for the MV receptors. In an orthotopic glioma model, MV-CD46/CD133 and MVSCD-CD133, which encodes the super cytosine deaminase, were most effective. Notably, VSV-CD133 caused fatal neurotoxicity in this tumor model. Use of CD133 as receptor could be excluded as being causative. In a subcutaneous tumor model of hepatocellular cancer, VSV-CD133 revealed the most potent oncolytic activity and also significantly prolonged survival of the mice when injected intravenously. Compared to MV-CD133, VSV-CD133 infected a more than 104-fold larger area of the tumor within the same time period. Our data not only suggest new concepts and approaches toward enhancing the oncolytic activity of CD133-targeted oncolytic viruses but also raise awareness about careful toxicity testing of novel virus types.

Keywords: glioblastoma; hepatocellular carcinoma; prominin-1; tumorsphere; virotherapy.


Figures

Figure 1
Figure 1
Generation of CD133-targeted oncolytic viruses. (A) Schematic overview on the genomic organization of the OVs used in this study. Point mutations in H protein introduced to ablate natural receptor usage are indicated by asterisks. (B) Immunoblot showing the incorporation of measles virus glycoproteins into recombinant measles virus (MV) and vesicular stomatitis virus (VSV) particles. Supernatants of Vero-αHis cells infected with the indicated viruses were denatured followed by fractionation by SDS-PAGE. Viral glycoproteins were detected with polyclonal antibodies directed against the indicated proteins. The parental MV-NSe, respectively, VSV and VSV-MV served as unmodified controls. N blots were used as loading control in both cases. (C) A panel of receptor-transgenic Chinese hamster ovary (CHO) cells (as indicated) was infected with MV-NSe, MV-CD133, MVPwt-CD133, MV-CD46/CD133, or VSV-CD133 at an MOI of 0.03. CHO-K1 served as receptor-negative cell line. GFP-fluorescent images were taken 72 h postinfection; Scale bar, 200 µm.
Figure 2
Figure 2
Hematopoietic stem cell properties are not impaired by infection. A colony-forming assay was performed with human CD34-positive cells purified from G-CSF mobilized peripheral blood that were incubated with the indicated viruses (MOI of 1), lysate from uninfected Vero-αHis cells, or PBS (mock). After 11 days, the number of colonies derived from erythroid and myeloid progenitors was determined by light microscopy. The proportion of the respective progenitors is shown in relation to the total colonies. Mean distribution ± SD of all colonies derived from three technical replicates is shown as a bar. The statistical analysis was carried out by a descriptive-explorative data analysis. Differences between treatment groups and the mock control group were not significant according to one-way ANOVA followed by Sidak’s multiple comparison test: P = 0.9993 (cell lysate), P = 0.4103 (MV-Nse), P > 0.9969 (MV-CD133), P > 0.9999 (MVPwt-CD133), P > 0.9999 (MV-CD46/CD133), P = 0.9036 (MVSCD-CD133), and P = 0.6528 (VSV-CD133). BFU-E, burst-forming unit erythroid; CFU-G, colony-forming unit-granulocyte; CFU-M, colony-forming unit-macrophage; CFU-GM, colony-forming unit-granulocyte, macrophage; CFU-GEMM, colony-forming unit-granulocyte, erythroid, macrophage, megakaryocyte; n.s., not significant; VSV, vesicular stomatitis virus; MV, measles virus.
Figure 3
Figure 3
Comparison of the in vitro killing performance of oncolytic viruses on Huh7 cells. Cells were infected with the indicated viruses, and cell viability was measured every 24 h postinfection by WST assays. (A) Cell viability after infection at an MOI of 1 at the indicated time points. Depicted is the percentage of living cells in relation to mock-infected control culture, which was set to 100%. The results are an average of two biological and four technical replicates. (B) EC50 values of the indicated viruses determined at 72 h postinfection relative to untreated controls. The results are an average of three biological and four technical replicates.
Figure 4
Figure 4
Infection and killing of primary glioma spheres. Single cell suspensions of NCH644 cells were infected with the indicated viruses at an MOI of 1, respectively. (A) Cells were monitored microscopically for GFP expression up to 96 h postinfection. Scale bar, 500 µm. (B) Cell viability was determined using the RealTime-Glo MT Cell Viability assay twice a day for 72 h after virus addition. 1 mM 5-FC was added to MVSCD-CD133-infected cells only, at time point 21 hpi. Average values of three independent killing assays are shown. One-way ANOVA with Dunnett’s multiple comparison test, *P < 0.05; ****P < 0.0001.
Figure 5
Figure 5
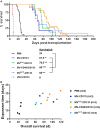
Intracranial implantation of preinfected glioma spheres. Primary glioma spheres were infected with the indicated viruses at an MOI of 0.5 followed by stereotactically assisted implantation into the corpus striatum of NOD-SCID mice 16 h later. Mice having received MVSCD-CD133-infected cells received 5-FC (200 mg/kg body weight) twice per day intraperitoneally initiated 3 day postimplantation for four consecutive days. (A) Health status and body weight were monitored daily. Mice were sacrificed with onset of neurological symptoms and/or weight loss of more than 20%. Based on the defined end points, a Kaplan–Meier survival curve was generated. Comparison of the mean survival periods between the mock control and the treatment groups was conducted by a log-rank test followed by a Bonferroni correction for multiple comparisons. Log-rank test, **P < 0.01; ***P < 0.001; ****P < 0.0001; PBS, n = 18; measles virus (MV)-CD133, n = 6; MVPwt-CD133, n = 8; MV-CD46/CD133, n = 16; MVSCD-CD133, n = 11; vesicular stomatitis virus (VSV)-CD133, n = 9. (B) At the experimental endpoint, tumors were explanted and identical numbers of cells cultivated. The time required to expand to a cell count of 1 × 106 was plotted against the median survival time of the respective animal.
Figure 6
Figure 6
Intracranial injection of oncolytic viruses. (A) 1 × 105 primary glioma sphere cells were stereotactically implanted into the corpus striatum of NOD-SCID mice. After 5 days, 2 × 105 TCID50 of the indicated viruses in 5 µl PBS or PBS were stereotactically injected into the same coordinates. Health status and body weight were monitored daily. Mice were sacrificed with onset of neurological symptoms and/or loss of weight by more than 20%. Based on the defined end points Kaplan–Meier survival plots were generated. PBS, n = 4; measles virus (MV)-CD46/CD133, n = 4; vesicular stomatitis virus (VSV)-CD133, n = 5. (B) 2 × 105 TCID50 of VSV-CD133, UV-inactivated (UV) VSV-CD133, or VSV-MV in 5 µl PBS, respectively, were stereotactically injected into the corpus striatum of NOD-SCID mice. Health status and body weight were monitored daily. Mice were sacrificed with onset of neurological symptoms and/or weight loss of more than 20%, n = 5.
Figure 7
Figure 7
Oncolytic activities of intratumorally applied oncolytic viruses in a subcutaneous xenograft model of hepatocellular carcinoma. HuH7 cells were implanted subcutaneously into the flank of NOD/SCID mice. Tumor size was monitored using a caliper. Intratumoral treatment was initiated at an approximate tumor volume of 100 mm3 with four applications of 1 × 106 TCID50 of each of the viruses on four consecutive days. Virus samples were blinded prior application, and the monitoring was carried out in a blinded fashion over the whole course of the study until sacrifice. (A) Tumor dimensions of each individual animal were measured twice a week. The mean tumor volume (mm3) of each treatment group was calculated and plotted against the course of the observation point. (B) Group comparisons were performed by determining the area under the curve (AUC) for each individual animal normalized against the value obtained from the last survivor of the mock group (40 days after treatment). The values were plotted as box and whiskers. One-way ANOVA with Dunnett’s multiple comparison test, *P < 0.05. (C) Survival data were depicted as Kaplan–Meier survival curves. Comparison between the group with the lowest median survival (MVPwt-CD133) and the mock group was conducted by a log-rank test with Bonferroni adjustment for multiple comparisons. Mock, n = 4; measles virus (MV)-CD133, n = 4; MVPwt-CD133, n = 4; MV-CD46/CD133, n = 3; vesicular stomatitis virus (VSV)-CD133, n = 3. ***P < 0.001.
Figure 8
Figure 8
Quantification of infected areas in explanted tumors. Cryosections of explanted tumors from vesicular stomatitis virus (VSV)-CD133 or measles virus (MV)-CD133-treated mice shown in Figure 7 were immunostained against GFP to visualize virus infection centers. (A) Schematic illustration of the distribution of sections chosen to cover the complete tumor. (B) Representative overview image of a cross-section of a tumor from mice injected with VSV-CD133 (top) or MV-CD133 (bottom). Shown is a composite image that was generated by tile-by-tile acquisition using the AxioVision MosaiX software. The zoom-in represents the output image of one tile reconstructed by the CellProfiler software. The red line indicates the tumor border. (C) Bar graph showing the quantification of infected tumor area per slice of one tumor. The percentage of infected tumor area within the whole tumor area is plotted for each tumor site indicated in panel (A).
Figure 9
Figure 9
Oncolytic activity of intravenously administered viruses in a subcutaneous xenograft model of hepatocellular carcinoma. HuH7 cells were implanted subcutaneously into the right flank of NOD/SCID mice. Intravenous injection of 1 × 106 TCID50 of vesicular stomatitis virus (VSV)-CD133 (n = 4) or measles virus (MV)-CD133 (n = 5), respectively, or PBS as control (mock; n = 6) was initiated at an approximate tumor volume of 100 mm3 and performed three times every second day. Survival data were depicted as Kaplan–Meier survival curves. Comparisons of both treatment groups with the mock group were conducted by a log-rank test with Bonferroni adjustment for multiple comparisons. ***P < 0.001.

Similar articles

Cited by

References

    1. Kahlert UD, Mooney SM, Natsumeda M, Steiger H-J, Maciaczyk J. Targeting cancer stem-like cells in glioblastoma and colorectal cancer through metabolic pathways. Int J Cancer (2017) 140(1):10–22.10.1002/ijc.30259 - DOI - PubMed
    1. Bonnet D, Dick JE. Human acute myeloid leukemia is organized as a hierarchy that originates from a primitive hematopoietic cell. Nat Med (1997) 3(7):730–7.10.1038/nm0797-730 - DOI - PubMed
    1. Singh SK, Hawkins C, Clarke ID, Squire JA, Bayani J, Hide T, et al. Identification of human brain tumour initiating cells. Nature (2004) 432(7015):396–401.10.1038/nature03128 - DOI - PubMed
    1. Schmohl JU, Vallera DA. CD133, selectively targeting the root of cancer. Toxins (Basel) (2016) 8(6):E165.10.3390/toxins8060165 - DOI - PMC - PubMed
    1. Irollo E, Pirozzi G. CD133: to be or not to be, is this the real question? Am J Transl Res (2013) 5(6):563–81. - PMC - PubMed