

Cooperation between p21 and Akt is required for p53-dependent cellular senescence
- PMID: 28691365
- PMCID: PMC5595696
- DOI: 10.1111/acel.12639
Cooperation between p21 and Akt is required for p53-dependent cellular senescence
Abstract
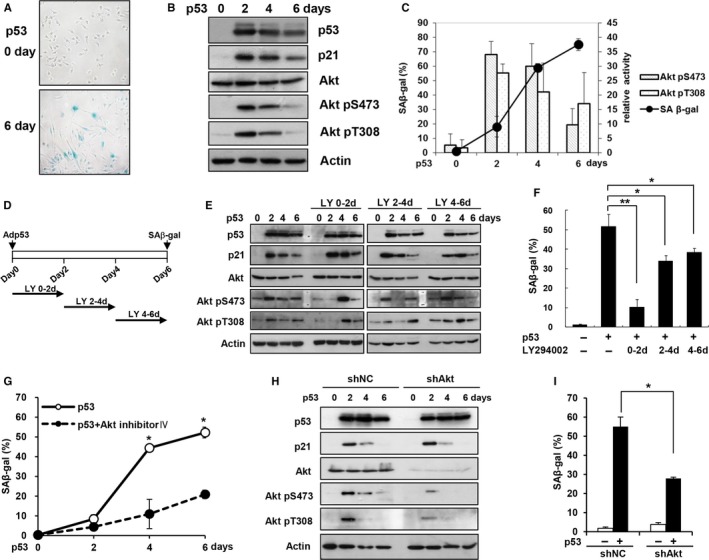
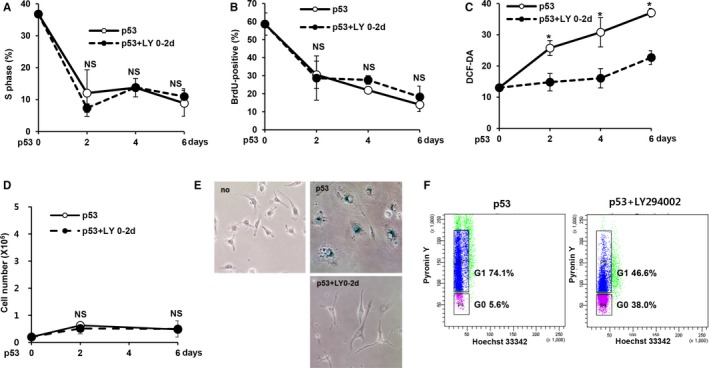
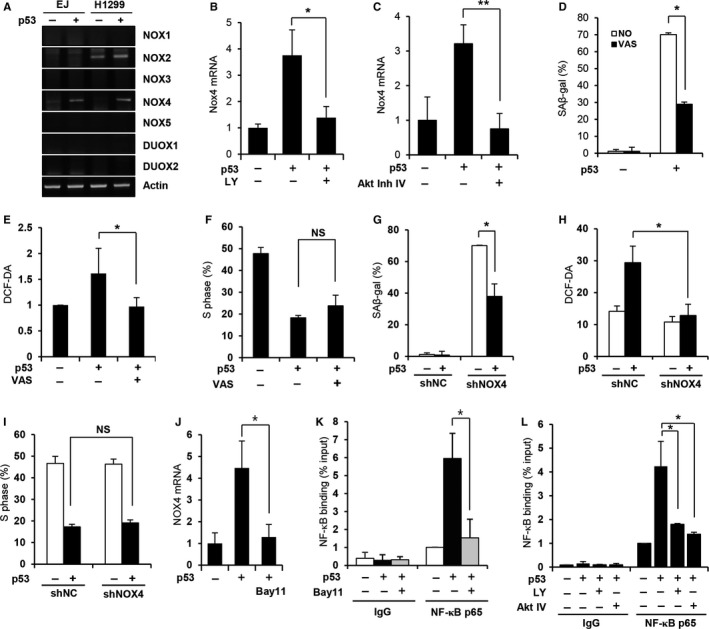
Cellular senescence has been implicated in normal aging, tissue homeostasis, and tumor suppression. Although p53 has been shown to be a central mediator of cellular senescence, the signaling pathway by which it induces senescence remains incompletely understood. In this study, we have shown that both Akt and p21 are required to induce cellular senescence in response to p53 expression. In a p53-induced senescence model, we found that Akt activation was essential for inducing a cellular senescence phenotype. Surprisingly, Akt inhibition did not abolish p53-induced cell cycle arrest, but it suppressed the increase in intracellular reactive oxygen species (ROS) levels. The results of the cell cycle and morphological analysis suggest that p53 induced quiescence, not senescence, following Akt inhibition. Conversely, the inhibition of p21 induction abolished cell cycle arrest but did not affect the p53-induced increase in ROS levels. Additionally, p21 and Akt separately controlled cell cycle arrest and ROS levels, respectively, during H-Ras-induced senescence in human normal fibroblasts. The mechanistic analysis revealed that Akt increased ROS levels through NOX4 induction, and increased Akt-dependent NF-κB binding to the NOX4 promoter is responsible for NOX4 induction upon p53 expression. We further showed that Akt activation upon p53 expression is mediated by mammalian target of rapamycin complex 2. In addition, p53-mediated IL6 and IL8 induction was abrogated by Akt inhibition, suggesting that Akt activation is also required for the senescence-associated secretory phenotype. Collectively, these results suggest that p53 simultaneously controls multiple pathways to induce cellular senescence through p21 and Akt.
Keywords: Akt; NOX4; p53; reactive oxygen species; senescence.
© 2017 The Authors. Aging Cell published by the Anatomical Society and John Wiley & Sons Ltd.
Figures


Similar articles
-
The canonical NF-κB pathway differentially protects normal and human tumor cells from ROS-induced DNA damage.Cell Signal. 2012 Nov;24(11):2007-23. doi: 10.1016/j.cellsig.2012.06.010. Epub 2012 Jun 29. Cell Signal. 2012. PMID: 22750558 Free PMC article.
-
The PPARγ-SETD8 axis constitutes an epigenetic, p53-independent checkpoint on p21-mediated cellular senescence.Aging Cell. 2017 Aug;16(4):797-813. doi: 10.1111/acel.12607. Epub 2017 May 17. Aging Cell. 2017. PMID: 28514051 Free PMC article.
-
WNT16B is a new marker of cellular senescence that regulates p53 activity and the phosphoinositide 3-kinase/AKT pathway.Cancer Res. 2009 Dec 15;69(24):9183-91. doi: 10.1158/0008-5472.CAN-09-1016. Cancer Res. 2009. PMID: 19951988 Free PMC article.
-
Cellular senescence: Molecular mechanisms and pathogenicity.J Cell Physiol. 2018 Dec;233(12):9121-9135. doi: 10.1002/jcp.26956. Epub 2018 Aug 5. J Cell Physiol. 2018. PMID: 30078211 Review.
-
Translational Control during Cellular Senescence.Mol Cell Biol. 2021 Jan 25;41(2):e00512-20. doi: 10.1128/MCB.00512-20. Print 2021 Jan 25. Mol Cell Biol. 2021. PMID: 33077499 Free PMC article. Review.
Cited by
-
Alveolar type 2 epithelial cell senescence and radiation-induced pulmonary fibrosis.Front Cell Dev Biol. 2022 Nov 2;10:999600. doi: 10.3389/fcell.2022.999600. eCollection 2022. Front Cell Dev Biol. 2022. PMID: 36407111 Free PMC article. Review.
-
Cellular Senescence Affects Cardiac Regeneration and Repair in Ischemic Heart Disease.Aging Dis. 2021 Apr 1;12(2):552-569. doi: 10.14336/AD.2020.0811. eCollection 2021 Apr. Aging Dis. 2021. PMID: 33815882 Free PMC article. Review.
-
Highly concentrated trehalose induces prohealing senescence-like state in fibroblasts via CDKN1A/p21.Commun Biol. 2023 Jan 6;6(1):13. doi: 10.1038/s42003-022-04408-3. Commun Biol. 2023. PMID: 36609486 Free PMC article.
-
Crowberry inhibits cell proliferation and migration through a molecular mechanism that includes inhibition of DEK and Akt signaling in cholangiocarcinoma.Chin Med. 2022 Jun 13;17(1):69. doi: 10.1186/s13020-022-00623-6. Chin Med. 2022. PMID: 35698073 Free PMC article.
-
Metformin Protects against Radiation-Induced Acute Effects by Limiting Senescence of Bronchial-Epithelial Cells.Int J Mol Sci. 2021 Jun 30;22(13):7064. doi: 10.3390/ijms22137064. Int J Mol Sci. 2021. PMID: 34209135 Free PMC article.
References
-
- Balaban RS, Nemoto S, Finkel T (2005) Mitochondria, oxidants, and aging. Cell 120, 483–495. - PubMed
-
- Brugarolas J, Chandrasekaran C, Gordon JI, Beach D, Jacks T, Hannon GJ (1995) Radiation‐induced cell cycle arrest compromised by p21 deficiency. Nature 377, 552–557. - PubMed
-
- Carracedo A, Ma L, Teruya‐Feldstein J, Rojo F, Salmena L, Alimonti A, Egia A, Sasaki AT, Thomas G, Kozma SC, Papa A, Nardella C, Cantley LC, Baselga J, Pandolfi PP. (2008) Inhibition of mTORC1 leads to MAPK pathway activation through a PI3K‐dependent feedback loop in human cancer. J. Clin. Invest. 118, 3065–3074. - PMC - PubMed
-
- Collado M, Gil J, Efeyan A, Guerra C, Schuhmacher AJ, Barradas M, Benguria A, Zaballos A, Flores JM, Barbacid M, Beach D, Serrano M. (2005) Tumour biology: senescence in premalignant tumours. Nature 436, 642. - PubMed
Publication types
MeSH terms
Substances
LinkOut - more resources
Full Text Sources
Other Literature Sources
Molecular Biology Databases
Research Materials
Miscellaneous
