. 2017 Jul 19;95(2):341-356.e6.
doi: 10.1016/j.neuron.2017.06.020. Epub 2017 Jul 6.

Local Cues Establish and Maintain Region-Specific Phenotypes of Basal Ganglia Microglia

Affiliations

Local Cues Establish and Maintain Region-Specific Phenotypes of Basal Ganglia Microglia

Lindsay M De Biase et al. Neuron. .

Abstract

Microglia play critical roles in tissue homeostasis and can also modulate neuronal function and synaptic connectivity. In contrast to astrocytes and oligodendrocytes, which arise from multiple progenitor pools, microglia arise from yolk sac progenitors and are widely considered to be equivalent throughout the CNS. However, little is known about basic properties of deep brain microglia, such as those within the basal ganglia (BG). Here, we show that microglial anatomical features, lysosome content, membrane properties, and transcriptomes differ significantly across BG nuclei. Region-specific phenotypes of BG microglia emerged during the second postnatal week and were re-established following genetic or pharmacological microglial ablation and repopulation in the adult, indicating that local cues play an ongoing role in shaping microglial diversity. These findings demonstrate that microglia in the healthy brain exhibit a spectrum of distinct functional states and provide a critical foundation for defining microglial contributions to BG circuit function.

Keywords: RNA sequencing; density; development; electrophysiology; heterogeneity; microglia; morphology; nucleus accumbens; substantia nigra; ventral tegmental area.


Figures

Figure 1
Figure 1. Microglial density varies significantly across basal ganglia (BG) nuclei and correlates with local abundance of astrocytes
A – Coronal brain sections from P60 CX3CR1EGFP/+ mouse immunostained for tyrosine hydroxylase (TH), which labels dopamine neuron somas and projections. Yellow boxes indicate location of analyzed images. NAc = nucleus accumbens, VTA = ventral tegmental area, SNc = substantia nigra pars compacta, SNr = substantia nigra pars reticulata. B, C –Overlap between microglial marker Iba1 and EGFP in CX3CR1EGFP/+ mice; image from NAc. D – Distribution and density of EGFP+ BG microglia. ANOVA, F(3,17) = 508, P < 0.00001. N = 4–6 mice per region. E – Distribution and density of BG oligodendrocyte precursor cells (OPCs) immunostained for NG2. ANOVA F(3,20) = 0.14, P = 0.93 (n.s.). N = 6 mice per region. F – Distribution and density of BG neurons immunostained for NeuN. ANOVA F(3,8) = 108.8, P < 0.00001. N = 3 mice per region. G – Distribution and density of BG astrocytes in Aldh1l1-EGFP mice. ANOVA F(3,8) = 38.4, P = 0.00005. N = 3 mice per region. HLeft, ratio of EGFP+ microglia to NG2+ OPCs (ANOVA F(3,20) = 41.5, P < 0.00001); Middle, ratio of EGFP+ microglia to NeuN+ neurons (ANOVA F(3,8) = 33.9, P = 0.00007); Right, ratio of Iba1+ microglia to EGFP+ astrocytes (ANOVA F(3,8) = 1.7, P = 0.25, n.s.). Dashed yellow lines indicate SNc boundary. All mice were age P58–60. # P < 0.05 vs. NAc, ● P < 0.05 vs. VTA, † P < 0.05 vs. SNc, ¥ P < 0.05 vs. SNr, * P < 0.002 all individual comparisons.
Figure 2
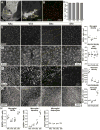
Figure 2. Microglia in distinct BG nuclei exhibit unique branching structure
A – Confocal images of BG microglial branching structure. B – Microglial tissue coverage (% field of view occupied by microglial processes and somas). ANOVA F(3,20) = 184.6, P < 0.00001. N = 6 mice per region. See also Fig. S1A. C – 3D reconstruction of individual microglia (raw images in Fig. S1B). D – Total process length of reconstructed cells. ANOVA F(3,13) = 21.7, P = 0.00003. N = 4–5 cells per region, each cell from different mouse. E – Number of branch points. ANOVA F(3,13) = 17.7, P < 0.00008. F – 3D Scholl analysis showing mean ± standard error (shaded) for all reconstructed cells. G – Approximate territory of reconstructed cells. ANOVA F(3,13) = 1.05, P = 0.40 (n.s.). All mice were age P58–60. # P < 0.05 vs. NAc, ● P < 0.05 vs. VTA, † P < 0.05 vs. SNc, ¥ P < 0.05 vs. SNr. * P < 0.05 all individual comparisons.
Figure 3
Figure 3. VTA microglia exhibit reduced and SNr microglia exhibit elevated lysosome content relative to other BG microglia
ALeft panel – immunostaining for microglial lysosome membrane protein CD68. Middle panels – 3D reconstruction of CD68+ lysosomes alone and with EGFP overlay; cyan = somatic and red = cell process lysosomes. Right panel – higher magnification of regions identified by yellow boxes. B – Percent volume of microglial cells occupied by CD68+ lysosomes; normalized to BG-wide average as shown in Fig. S1C. ANOVA F(3,24) = 19.8, P < 0.00001. C – Overall tissue content of CD68+ lysosomes. ANOVA F(3,24) = 27.4, P < 0.00001. D – Average number of CD68+ lysosomes per microglial soma. ANOVA F(3,24) = 8.1, P = 0.0007. N = 7 mice per region. All mice were age P58–60. # P < 0.05 vs. NAc, ● P < 0.05 vs. VTA, † P < 0.05 vs. SNc, ¥ P < 0.05 vs. SNr, * P < 0.02 all individual comparisons. See also Fig. S1 C–F.
Figure 4
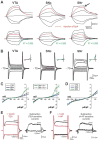
Figure 4. Microglia in adjacent BG nuclei exhibit distinct membrane properties
A – Responses of 2 representative microglia per region to hyperpolarizing and depolarizing current injection. Black arrow highlights evidence of voltage-activated conductances. Green overlay = single exponential fit to calculate tau decay/input resistance (see Fig. S2C). B – Responses of representative BG microglia stepped to holding potentials from −120 mV to +10 mV. Initial holding potential = −70 mV. Inset shows current-voltage (I–V) relationship. C – Average I–V curves from all recorded cells (VTA, N = 33 cells; SNc, N = 15 cells; SNr, N = 37 cells); initial holding potential −70 mV. Right panel shows I–V curves when SNr microglia are split into cells displaying (Kv +) or lacking (Kv -) voltage-activated conductances. 3/33 VTA microglia (9%), 0/15 SNc microglia (0%), and 24/37 SNr microglia (65%) were Kv+. D – Average I–V curves from all recorded microglia; initial holding potential −20 mV. E,F – Reduction of voltage-activated conductances recorded from representative SNr microglia (black traces) by bath application of 10 mM TEA or 1 mM 4-AP (red traces) (TEA: t(6) = 2.5, P = 0.03, N = 7 cells; 4-AP: t(4) = 2.9, P = 0.03, N = 5 cells; paired T-test, one-tailed); initial holding potential −70 mV. TEA- and 4-AP sensitive currents (response before – response after antagonist application) shown at right. Brain slices for all recordings prepared from mice age P35–45. See also Fig. S2.
Figure 5
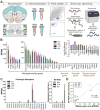
Figure 5. Generation of whole transcriptome RNAseq data from microglia of distinct BG nuclei
A – Diagram illustrating RNAseq workflow. B – Expression levels for microglial-, neuron-, astrocyte-, and oligodendrocyte lineage-enriched genes. Inset shows fold change of cell-specific genes in EGFP+ compared to EGFP cells. N = 6 – 8 samples per group; each sample represents data of microglia isolated from the BG nucleus of an individual mouse. CLeft, expression of ionotropic and metabotropic purinergic receptors as assessed by RNAseq; Right, expression of purinergic receptor subset as assessed by RT-PCR. D – Comparison of gene expression levels measured by RNAseq (mean RPKM, N = 6–8 samples per region) with levels measured by RT-PCR in samples prepared from an independent cohort of mice (average expression value, N = 5 samples per region; each sample represents data from microglia isolated from the BG nucleus of an individual mouse). Linear regression R2 = 0.85, P < 0.0001. Data from individual target genes shown in Fig. 5C and Fig. S4 A,B. N = 17 target genes. See also Figs. S3–4.
Figure 6
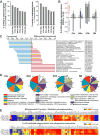
Figure 6. BG and Ctx microglia show substantial variation in expression of genes associated with multiple functional families
A – Degree of overlap in expressed genes in pairwise comparisons of BG and Ctx microglia using mean RPKM (left) or median RPKM (right) threshold for expression. B – Number of significantly up- and down-regulated genes in pairwise comparisons of BG and Ctx microglia. (EDGE P-value < 0.05; mean RPKM > 2 and norm. SEM < 0.5 in the more highly-expressing region). C – Degree to which genes in particular functional families are “conserved” (expressed by microglia in all regions) or “differentially expressed” (not expressed by microglia in all regions). D –Pie charts showing top 10 functional families in lists of genes that are significantly up-regulated in microglia in that region compared to microglia from at least one other region. Number of genes implicated in each functional family shown at perimeter. E – Key canonical signaling pathways altered in VTA microglia. Heat maps show all detected microglial genes involved in mitochondrial function/oxidative phosphorylation (top), and Fcγ-receptor mediated phagocytosis/phagosome maturation (bottom). Color scale represents fold change for pairwise comparisons listed at left. * Genes found to be significantly up-or down-regulated in VTA microglia compared to microglia from at least one other region. See also Figs. S5–6.
Figure 7
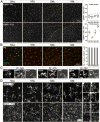
Figure 7. Region specific phenotypes of BG microglia emerge during the second postnatal week
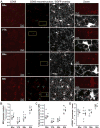
A – Distribution and density of BG microglia at postnatal day 6 (P6) (top, ANOVA F(3,26) = 1.3, P = 0.29, n.s., N = 7–9 mice per region) and P12 (bottom, ANOVA F(3,9) = 31.8, P = 0.00005, N = 3–4 mice per region). Yellow dashed lines indicate boundaries of VTA, SNc, and SNr. ● P < 0.02 vs. VTA, ¥ P < 0.02 vs. SNr, * P < 0.02 all individual comparisons. B – Visualization and quantification of overlap in EGFP and Iba1 expression in P6 BG microglia. White dashed lines indicate boundaries of SNc and SNr. C – Example Ki67+ microglia in NAc, VTA, and SNr of P8 CX3CR1EGFP/+ mice. Yellow arrows indicate DAPI+Ki67+ nuclei corresponding to highlighted EGFP+ microglia. D – High magnification images of BG microglial branching structure in P6 (top) and P12 (bottom) CX3CR1EGFP/+ mice. Yellow boxes highlight regions shown enlarged at right. Dashed yellow lines indicate SNc boundary.
Figure 8
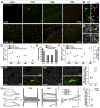
Figure 8. Microglia re-establish region specific phenotypes after ablation and repopulation
A – Microglial distribution in brain sections from CX3CR1EGFP/+ mice after 2 weeks treatment with CSF1R antagonist PLEX5622 (top panel, PLEX) or 2 weeks of PLEX5622 treatment followed by a 21-day repopulation period (bottom panel, PLEX +21d). Dashed white lines indicate boundaries of VTA, SNc, and SNr. B – Example dying microglial cell in brain sections from CX3CR1EGFP/+ mice after 1 week of PLEX5622 treatment. Red arrow highlights cell’s pyknotic nucleus. C – High magnification images of microglial branching structure in brain sections from PLEX ablated/repopulated mice. 1 – NAc, 2 – VTA, 3 – SNc, 4 – SNr. Scale = 5 μm. D – Microglial density in Control (N = 3 mice), PLEX ablated (N = 4 mice), and PLEX ablated/repopulated mice (N = 3 mice). 2-way ANOVA; main effect of treatment, F(2,28) = 1035, P < 0.00001; main effect of brain region, F(3,28) = 261, P <0.00001; treatment x brain region interaction, F(6,28) = 56, P <0.00001. E – Microglial tissue coverage in Control and PLEX ablated/repopulated mice. 2-way ANOVA; main effect of brain region, F(3,16) = 275, P < 0.00001; main effect of treatment F(1,16) = 25, P = 0.0002; treatment x brain region interaction, F(3,16) = 11, P = 0.0004. F – Microglial density after genetic microglial ablation and repopulation using 4HT-treated CX3CR1CreER-iresEYFP;Rosa fs-DT/fs-DT mice. 2-way ANOVA (performed using raw density values for DT ablated/repopulated mice, Fig. S8F); main effect of treatment, F(2,42) = 119, P < 0.00001; main effect of brain region, F(3,42) = 11, P = 0.00002; treatment x brain region interaction, F(6,42) = 5, P = 0.002. N = 2 control mice, 4–9 ablated mice, 4 DT ablated/repopulated mice. G – Lysosome content of VTA and SNr microglia in brain sections from PLEX ablated/repopulated mice. * P < 0.002 VTA vs. SNr. N = 3 mice. H – Response of representative VTA and SNr microglia to hyperpolarizing and depolarizing current injection (left; red trace = injection of 5pA) or stepping to holding potentials from −120 mV to +10 mV (right). I – Average I–V curves from all recorded cells. 2/9 VTA microglia (22%) and 8/13 SNr microglia (62%) displayed voltage-activated conductances (Kv+). J – Magnitude of Kv currents estimated as in Fig. S2E. Filled circle corresponds to SNr cell shown in H. See also Figs. S7–8.

Similar articles

Cited by

References

    1. Albin RL. Basal ganglia neurotoxins. Neurologic clinics. 2000;18:665–680. - PubMed
    1. Appelqvist H, Waster P, Kagedal K, Ollinger K. The lysosome: from waste bag to potential therapeutic target. Journal of molecular cell biology. 2013;5:214–226. - PubMed
    1. Arnoux I, Hoshiko M, Mandavy L, Avignone E, Yamamoto N, Audinat E. Adaptive phenotype of microglial cells during the normal postnatal development of the somatosensory “Barrel” cortex. Glia. 2013;61:1582–1594. - PubMed
    1. Avignone E, Ulmann L, Levavasseur F, Rassendren F, Audinat E. Status epilepticus induces a particular microglial activation state characterized by enhanced purinergic signaling. The Journal of neuroscience : the official journal of the Society for Neuroscience. 2008;28:9133–9144. - PMC - PubMed
    1. Bayraktar OA, Fuentealba LC, Alvarez-Buylla A, Rowitch DH. Astrocyte development and heterogeneity. Cold Spring Harbor perspectives in biology. 2015;7:a020362. - PMC - PubMed

LinkOut - more resources