

A genomic perspective on HLA evolution
- PMID: 28687858
- PMCID: PMC5748415
- DOI: 10.1007/s00251-017-1017-3
A genomic perspective on HLA evolution
Abstract
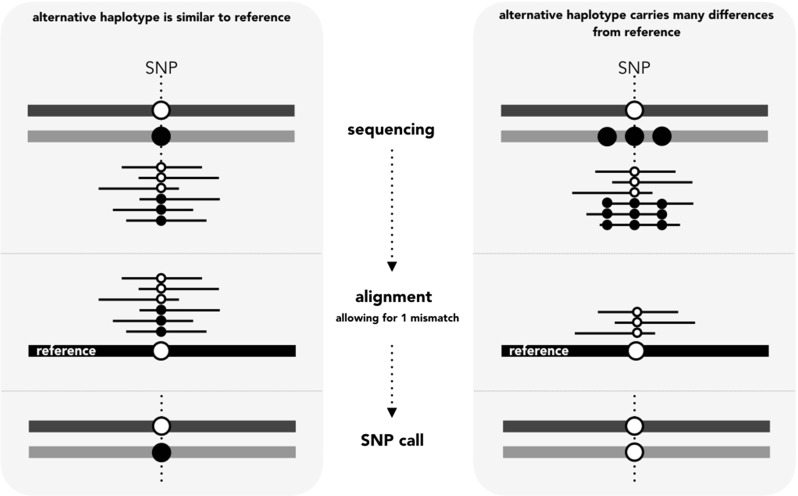
Several decades of research have convincingly shown that classical human leukocyte antigen (HLA) loci bear signatures of natural selection. Despite this conclusion, many questions remain regarding the type of selective regime acting on these loci, the time frame at which selection acts, and the functional connections between genetic variability and natural selection. In this review, we argue that genomic datasets, in particular those generated by next-generation sequencing (NGS) at the population scale, are transforming our understanding of HLA evolution. We show that genomewide data can be used to perform robust and powerful tests for selection, capable of identifying both positive and balancing selection at HLA genes. Importantly, these tests have shown that natural selection can be identified at both recent and ancient timescales. We discuss how findings from genomewide association studies impact the evolutionary study of HLA genes, and how genomic data can be used to survey adaptive change involving interaction at multiple loci. We discuss the methodological developments which are necessary to correctly interpret genomic analyses involving the HLA region. These developments include adapting the NGS analysis framework so as to deal with the highly polymorphic HLA data, as well as developing tools and theory to search for signatures of selection, quantify differentiation, and measure admixture within the HLA region. Finally, we show that high throughput analysis of molecular phenotypes for HLA genes-namely transcription levels-is now a feasible approach and can add another dimension to the study of genetic variation.
Keywords: Balancing selection; Evolution; Genomics; HLA (human leukocyte antigen); MHC (major histocompatibility complex).
Figures
Similar articles
-
Next-generation HLA typing of 382 International Histocompatibility Working Group reference B-lymphoblastoid cell lines: Report from the 17th International HLA and Immunogenetics Workshop.Hum Immunol. 2019 Jul;80(7):449-460. doi: 10.1016/j.humimm.2019.03.001. Epub 2019 Mar 4. Hum Immunol. 2019. PMID: 30844424 Free PMC article.
-
Excess of Deleterious Mutations around HLA Genes Reveals Evolutionary Cost of Balancing Selection.Mol Biol Evol. 2016 Oct;33(10):2555-64. doi: 10.1093/molbev/msw127. Epub 2016 Jun 28. Mol Biol Evol. 2016. PMID: 27436009 Free PMC article.
-
Current perspectives on the intensity of natural selection of MHC loci.Immunogenetics. 2013 Jun;65(6):479-83. doi: 10.1007/s00251-013-0693-x. Epub 2013 Apr 3. Immunogenetics. 2013. PMID: 23549729 Free PMC article.
-
Major Histocompatibility Complex (MHC) Genes and Disease Resistance in Fish.Cells. 2019 Apr 25;8(4):378. doi: 10.3390/cells8040378. Cells. 2019. PMID: 31027287 Free PMC article. Review.
-
HLA Genetics for the Human Diseases.Adv Exp Med Biol. 2024;1444:237-258. doi: 10.1007/978-981-99-9781-7_16. Adv Exp Med Biol. 2024. PMID: 38467984 Review.
Cited by
-
Association of Dental Caries in Primary Teeth With HLA Class II Gene Among Syrian Children.Cureus. 2024 Jan 27;16(1):e53081. doi: 10.7759/cureus.53081. eCollection 2024 Jan. Cureus. 2024. PMID: 38414691 Free PMC article.
-
Inferring Balancing Selection From Genome-Scale Data.Genome Biol Evol. 2023 Mar 3;15(3):evad032. doi: 10.1093/gbe/evad032. Genome Biol Evol. 2023. PMID: 36821771 Free PMC article. Review.
-
Comparative physiological anthropogeny: exploring molecular underpinnings of distinctly human phenotypes.Physiol Rev. 2023 Jul 1;103(3):2171-2229. doi: 10.1152/physrev.00040.2021. Epub 2023 Jan 5. Physiol Rev. 2023. PMID: 36603157 Free PMC article. Review.
-
Immunogenetic Predisposition to SARS-CoV-2 Infection.Biology (Basel). 2022 Dec 25;12(1):37. doi: 10.3390/biology12010037. Biology (Basel). 2022. PMID: 36671730 Free PMC article.
-
Human Leukocyte Antigen (HLA) System: Genetics and Association with Bacterial and Viral Infections.J Immunol Res. 2022 May 26;2022:9710376. doi: 10.1155/2022/9710376. eCollection 2022. J Immunol Res. 2022. PMID: 35664353 Free PMC article. Review.
References
Publication types
MeSH terms
Substances
LinkOut - more resources
Full Text Sources
Other Literature Sources
Research Materials
