. 2017 Jul 6;2(13):e93187.
doi: 10.1172/jci.insight.93187.

Fibroblast deletion of ROCK2 attenuates cardiac hypertrophy, fibrosis, and diastolic dysfunction

Fibroblast deletion of ROCK2 attenuates cardiac hypertrophy, fibrosis, and diastolic dysfunction

Toru Shimizu et al. JCI Insight. .

Abstract

Although left ventricular (LV) diastolic dysfunction is often associated with hypertension, little is known regarding its underlying pathophysiological mechanism. Here, we show that the actin cytoskeletal regulator, Rho-associated coiled-coil containing kinase-2 (ROCK2), is a critical mediator of LV diastolic dysfunction. In response to angiotensin II (Ang II), mutant mice with fibroblast-specific deletion of ROCK2 (ROCK2Postn-/-) developed less LV wall thickness and fibrosis, along with improved isovolumetric relaxation. This corresponded with decreased connective tissue growth factor (CTGF) and fibroblast growth factor-2 (FGF2) expression in the hearts of ROCK2Postn-/- mice. Indeed, knockdown of ROCK2 in cardiac fibroblasts leads to decreased expression of CTGF and secretion of FGF2, and cardiomyocytes incubated with conditioned media from ROCK2-knockdown cardiac fibroblasts exhibited less hypertrophic response. In contrast, mutant mice with elevated fibroblast ROCK activity exhibited enhanced Ang II-stimulated cardiac hypertrophy and fibrosis. Clinically, higher leukocyte ROCK2 activity was observed in patients with diastolic dysfunction compared with age- and sex-matched controls, and correlated with higher grades of diastolic dysfunction by echocardiography. These findings indicate that fibroblast ROCK2 is necessary to cause cardiac hypertrophy and fibrosis through the induction CTGF and FGF2, and they suggest that targeting ROCK2 may have therapeutic benefits in patients with LV diastolic dysfunction.

Keywords: Cardiology.


Conflict of interest statement

Conflict of interest: The authors have declared that no conflict of interest exists.

Figures

Figure 1
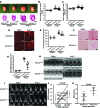
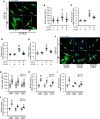
Figure 1. Deletion of ROCK2 in angiotensin II–induced (Ang II–induced) activated cardiac fibroblasts from fibroblast-specific ROCK2-deficient (ROCK2Postn–/–) mice.
(A) Representative fluorescent sections from hearts double-stained with ROCK2 (green) and periostin (red) in ROCK2Postn–/– and littermate control (ROCK2flox/flox) mice at 4 wk after saline or Ang II infusion. Nuclei are stained with DAPI (blue). The nuclei of cardiac fibroblasts are elongated in the direction of cardiomyocytes, and their cytoplasms are substantially reduced in volume. Activated cardiac fibroblasts (arrowheads) are identified as periostin-expressing spindle-shaped cells in ROCK2flox/flox mice treated with Ang II (n = 4–5 each). Scale bars: 10 μm. (B–D) Quantitative PCR analysis of Rock2, Rock1, and Acta2 (encoding α-smooth muscle actin) mRNA expression in cardiac fibroblasts isolated from ROCK2Postn–/– and ROCK2flox/flox mice treated with saline or Ang II (n = 4–5 each). **P < 0.01 vs. saline-treated ROCK2flox/flox mice. ##P < 0.01 vs. Ang II-treated ROCK2flox/flox mice. Data are expressed as mean ± SEM. P values were calculated using one-way ANOVA with Tukey’s HSD test.
Figure 2
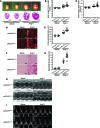
Figure 2. Deletion of ROCK2 in cardiac fibroblasts attenuates angiotensin II–induced (Ang II–induced) cardiac hypertrophy, fibrosis, and diastolic dysfunction.
(A) Representative photomicrographs and H&E-stained sagittal sections of hearts from fibroblast-specific ROCK2-deficient (ROCK2Postn–/–) and littermate control (ROCK2flox/flox) mice at 4 wk after saline or Ang II infusion. Scale bars: 3 mm. (B and C) Quantitative analysis of the ratios of heart weight to body weight and to tibial length from ROCK2Postn–/– and ROCK2flox/flox mice treated with saline or Ang II (n = 10 each). (D and E) Representative sections from hearts immunostained with wheat germ agglutinin and quantification of cardiomyocyte cross-sectional area in ROCK2Postn–/– and ROCK2flox/flox mice treated with saline or Ang II (n = 5 each). Scale bars: 25 μm. (F and G) Representative sections from hearts stained with Picrosirius red and quantification of interstitial fibrosis area in ROCK2Postn–/– and ROCK2flox/flox mice treated with saline or Ang II (n = 5 each). Scale bars: 50 μm. (H) Representative echocardiographic M-mode images of left ventricles from ROCK2Postn–/– and ROCK2flox/flox mice treated with saline or Ang II (n = 10 each). (I) Representative echocardiographic images of mitral inflow pattern to evaluate diastolic dysfunction measured by transmitral Doppler velocity ratio of early-to-atrial wave (E/A ratio) (n = 10 each). **P < 0.01 vs. saline-treated each genotype. #P < 0.05, ##P < 0.01 vs. Ang II-treated ROCK2flox/flox mice. Data are expressed as mean ± SEM. P values were calculated using one-way ANOVA with Tukey’s HSD test. (J) Comparison of ROCK activity (phosphorylated myosin-binding subunits [p-MBS]/total MBS [t-MBS]) in HFpEF patients (n = 10) with age- and sex-matched controls (n = 10). Data are expressed as mean ± SEM. P value was calculated using paired t test. (K) Relationship between diastolic dysfunction grades and leukocyte ROCK activity (p-MBS/t-MBS) in 19 patients with normal or mild (grades 0 and 1) and moderate to severe (grades 2 and 3) diastolic dysfunction. Mean ROCK activity is higher in patients with moderate to severe compared with normal to mild diastolic dysfunction (1.34 ± 0.31 vs. 0.69 ± 0.34). Data are expressed as mean ± SD. P value was calculated using paired t test.
Figure 3
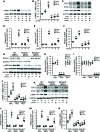
Figure 3. ROCK activation in cardiac fibroblasts develops angiotensin II–induced (Ang II–induced) cardiac hypertrophy, fibrosis, and diastolic dysfunction.
(A) Representative photomicrographs and H&E-stained sagittal sections of hearts from fibroblast-specific constitutively active ROCK knock-in (caROCKPostn–/–) and littermate control (caROCKflox/flox) mice at 4 wk after saline or Ang II infusion. Scale bars: 3 mm. (B and C) Quantitative analysis of the ratios of heart weight to body weight and to tibial length from caROCKPostn–/– and caROCKflox/flox mice treated with saline or Ang II (n = 6–8 each). (D and E) Representative sections from hearts immunostained with wheat germ agglutinin and quantification of cardiomyocyte cross-sectional area in caROCKPostn–/– and caROCKflox/flox mice treated with saline or Ang II (n = 5–6 each). Scale bars: 25 μm. (F and G) Representative sections from hearts stained with Picrosirius red and quantification of interstitial fibrosis area in caROCKPostn–/– and caROCKflox/flox mice treated with saline or Ang II (n = 5–6 each). Scale bars: 50 μm. (H) Representative echocardiographic M-mode images of left ventricles from caROCKPostn–/– and caROCKflox/flox mice treated with saline or Ang II (n = 8–10 each). (I) Representative echocardiographic images of mitral inflow pattern to evaluate diastolic dysfunction measured by transmitral Doppler velocity ratio of early-to-atrial wave (E/A ratio) (n = 8–10 each). **P < 0.01 vs. saline-treated each genotype. #P < 0.05, ##P < 0.01 vs. Ang II-treated caROCKflox/flox mice. Data are expressed as mean ± SEM. P values were calculated using one-way ANOVA with Tukey’s HSD test.
Figure 4
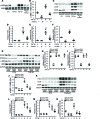
Figure 4. ROCK2 in cardiac fibroblasts is involved in angiotensin II–induced (Ang II–induced) cardiac remodeling through regulation of FGF2, CTGF, and α-SMA expression.
Fibroblast-specific ROCK2-deficient (ROCK2Postn–/–) and littermate control (ROCK2flox/flox) mice (A–H), and fibroblast-specific constitutively active ROCK knock-in (caROCKPostn–/–) and littermate control (caROCKflox/flox) mice (I–N) were treated with saline or Ang II for 4 wk. (A and I) Representative immunoblots of ROCK1, ROCK2, and ROCK activity, as assessed by the ratio of phosphorylated form of the myosin-binding subunit (MBS) to total MBS (p-MBS/t-MBS), in heart tissues from each experimental genotype. (B and C) Quantification of ROCK1 and ROCK2 protein expression, and (D and J) ROCK activity levels by densitometry (n = 4–6 each). (E and K) Representative immunoblots of FGF2, CTGF, and α-SMA in heart tissues from each experimental genotype. (F–H and L–N) Quantification of FGF2, CTGF, and α-SMA protein expression by densitometry (n = 4–6 each). *P < 0.05 vs. saline-treated each genotype. #P < 0.05 vs. Ang II–treated respective controls. Data are expressed as mean ± SEM. P values were calculated using one-way ANOVA with Tukey’s HSD test.
Figure 5
Figure 5. Decreased gene expression related to cardiac hypertrophy, fibrosis, and fibroblast to myofibroblast differentiation in hearts from fibroblast-specific ROCK2-deficient (ROCK2Postn–/–) mice treated with angiotensin II (Ang II).
(A and B) Quantitative PCR analysis mRNA levels of Rock1 and Rock2; (C) a prohypertrophic mediator of Fgf2 (encoding fibroblast growth factor 2); (D) a profibrotic mediator of Ctgf (connective tissue growth factor); (E) a fibroblast-myoblast differentiation marker, Acta2 (α-smooth muscle actin); (F and G) hypertrophic markers of Nppa (atrial natriuretic factor) and Acta1 (skeletal muscle α-actin); and (H and I) fibrotic markers of Col1a (collagen type I) and Fn1 (fibronectin 1) in heart tissues from ROCK2Postn–/– and littermate control (ROCK2flox/flox) mice at 4 wk after saline or Ang II infusion (n = 4–7 each). *P < 0.05, **P < 0.01 vs. saline-treated ROCK2flox/flox mice. #P < 0.05 vs. Ang II-treated ROCK2flox/flox mice. Data are expressed as mean ± SEM. P values were calculated using one-way ANOVA with Tukey’s HSD test.
Figure 6
Figure 6. Effects of ROCK deletion on the activated mediators related to cardiac remodeling in response to angiotensin II (Ang II) or TGF-β1 in mouse embryonic fibroblasts (MEFs).
(A and B) Representative immunoblots and densitometric quantification of ROCK activity, as assessed by the ratio of phosphorylated form of the myosin-binding subunit (MBS) to total MBS (p-MBS/t-MBS), stimulated by 1 μM Ang II or 10 ng/ml TGF-β1 for 24 hours, with or without 10 μM Y27632, a specific ROCK inhibitor, in MEFs isolated from WT mice (n = 3–4 each). (C–F) Representative immunoblots and densitometric quantification of FGF2, CTGF, and α-SMA protein expression, stimulated by Ang II or TGF-β1, with or without Y27632, in WT MEFs (n = 3–4 each). *P < 0.05, **P < 0.01 vs. vehicle-stimulated WT MEFs. ##P < 0.01 vs. the same stimulated WT MEFs without Y27632. ††P < 0.01 vs. Ang II–stimulated WT MEFs without Y27632. (G–J) Representative immunoblots and densitometric quantification of ROCK1 and ROCK2 protein expression and ROCK activity, as assessed by the ratio of phosphorylated form of the myosin-binding subunit (MBS) to total MBS (p-MBS/t-MBS), stimulated by Ang II or TGF-β1, in MEFs isolated from WT, global Rock1-KO (ROCK1–/–), and global Rock2-KO (ROCK2–/–) mice (n = 3–4 each). (K–N) Representative immunoblots and densitometric quantification of FGF2, CTGF, and α-SMA protein expression, stimulated by Ang II or TGF-β1, in WT, global ROCK1–/–, and global ROCK2–/– MEFs (n = 3–4 each). **P < 0.01 vs. vehicle-stimulated WT MEFs. #P < 0.05, ##P < 0.01 vs. the same stimulated WT MEFs. ††P < 0.01 vs. Ang II–stimulated WT MEFs. P < 0.05, ‡‡P < 0.01 vs. TGF-β1-stimulated global ROCK1–/– MEFs. Data are expressed as mean ± SEM. P values were calculated using one-way ANOVA with Tukey’s HSD test.
Figure 7
Figure 7. Effects of ROCK deletion on mRNA expression of FGF2, CTGF, and α-SMA in response to angiotensin II (Ang II) or transforming growth factor-β1 (TGF-β1) in mouse embryonic fibroblasts (MEFs).
(A–C) Quantitative PCR analysis of Fgf2 (encoding fibroblast growth factor 2), Ctgf (connective tissue growth factor), and Acta2 (α-smooth muscle actin) mRNA expression stimulated by 1 μM Ang II or 10 ng/ml TGF-β1 for 24 hours, with or without 10 μM Y27632, a specific ROCK inhibitor, in MEFs isolated from WT (n = 3–4 each). **P < 0.01 vs. vehicle-stimulated WT MEFs. #P < 0.05, ##P < 0.01 vs. the same stimulated WT MEFs without Y27632. †P < 0.05, ††P < 0.01 vs. Ang II–stimulated WT MEFs without Y27632. (D–F) Quantitative PCR analysis of Fgf2, Ctgf, and Acta2 mRNA expression stimulated by 1 μM Ang II or 10 ng/ml TGF-β1 for 24 hours in MEFs isolated from WT, global Rock1-KO (ROCK1–/–), and global Rock2-KO (ROCK2–/–) mice (n = 3–4 each). *P < 0.01, **P < 0.01 vs. vehicle-stimulated WT MEFs. #P < 0.05, ##P < 0.01 vs. the same stimulated WT MEFs. P < 0.05, ††P < 0.01 vs. Ang II–stimulated WT MEFs. P < 0.05 vs. TGF-β1–stimulated global ROCK1–/– MEFs. Data are expressed as mean ± SEM. P values were calculated using one-way ANOVA with Tukey’s HSD test.
Figure 8
Figure 8. Effects of ROCK knockdown on the activated mediators related to cardiac remodeling in response to TGF-β1 in rat neonatal cardiac fibroblasts (RNCFs).
(A and B) Representative immunoblots and densitometric quantification of ROCK activityas assessed by the ratio of phosphorylated form of the myosin-binding subunit (MBS) to total MBS (p-MBS/t-MBS), stimulated by 10 ng/ml TGF-β1 for 24 hours, with or without 10 μM Y27632, a specific ROCK inhibitor, in RNCFs (n = 3–4 each). (C–F) Representative immunoblots and densitometric quantification of FGF2, CTGF, and α-SMA protein expression, stimulated by TGF-β1, with or without Y27632, in RNCFs (n = 3–4 each). **P < 0.01 vs. vehicle-stimulated RNCFs. ##P < 0.01 vs. TGF-β1–stimulated RNCFs without Y27632. (G–J) Representative immunoblots and densitometric quantification of ROCK1 and ROCK2 protein expression and ROCK activity, stimulated by TGF-β1, in RNCFs transfected with control, ROCK1, or ROCK2 siRNA (n = 3–4 each). (K–N) Representative immunoblots and densitometric quantification of FGF2, CTGF, and α-SMA protein expression, stimulated by TGF-β1, in RNCFs transfected with control, ROCK1, or ROCK2 siRNA (n = 3–4 each). **P < 0.01 vs. vehicle-stimulated RNCFs transfected with control siRNA. ##P < 0.01 vs. TGF-β1–stimulated RNCFs transfected with control siRNA. P < 0.05, ††P < 0.01 vs. TGF-β1–stimulated RNCFs transfected with ROCK1 siRNA. Data are expressed as mean ± SEM. P values were calculated using one-way ANOVA with Tukey’s HSD test.
Figure 9
Figure 9. Inhibition of ROCK2 decreases extracellular release of FGF2 from rat neonatal cardiac fibroblasts (RNCFs).
(A) Detection of CTGF and FGF2 protein expression in the mixture of supernatant and eluted extracellular matrix of RNCFs, stimulated by 10 ng/ml TGF-β1 for 24 hours, with or without 2.5 μM Y27632. Ponceau S staining of the membrane shows equal loading. (B) ELISA quantification of FGF2 concentration in eluted extracellular matrix of RNCFs, stimulated by TGF-β1 with or without Y27632 (n = 6–9, each in triplicate). **P < 0.01 vs. vehicle-stimulated RNCFs. ##P < 0.01 vs. TGF-β1-stimulated RNCFs without Y27632. (C) Detection of CTGF and FGF2 protein expression in the mixture of supernatant and eluted extracellular matrix of TGF-β1–stimulated RNCFs, transfected with control, ROCK1, or ROCK2 siRNA. (D) ELISA quantification FGF2 concentration in eluted extracellular matrix of TGF-β1–stimulated RNCFs, transfected with control, ROCK1, or ROCK2 siRNA (n = 5–8, each in triplicate). **P < 0.01 vs. vehicle-stimulated RNCFs transfected with each siRNA. ##P < 0.01 vs. TGF-β1–stimulated RNCFs transfected with control siRNA. P < 0.05 vs. TGF-β1–stimulated RNCFs transfected with ROCK1 siRNA. Data are expressed as mean ± SEM. (E and F) Representative fluorescent images and quantification of cellular hypertrophy of rat H9C2 cardiomyocytes stained with sarcomeric α-actinin (green), in response to 0–100 ng/ml FGF2 for 24 hours. Nuclei are stained with DAPI (blue). (n = 30–50 each). Scale bars: 25 μm. (G–I) Quantification of RT-PCR analysis of hypertrophic markers of Acta1 (encoding skeletal muscle α-actin), Myh7 (β-myosin heavy chain), and Nppa (atrial natriuretic factor) in H9C2 cells stimulated by FGF2 (n = 3–4 each). *P < 0.05, **P < 0.01 vs. vehicle-stimulated H9C2 cells. Data are expressed as mean ± SEM. P values were calculated using one-way ANOVA with Tukey’s HSD test.
Figure 10
Figure 10. Attenuated hypertrophic response of rat H9C2 cardiomyocytes to conditioned medium from ROCK2-silenced rat neonatal cardiac fibroblasts (RNCFs).
(A and B) Representative fluorescent images and quantification of cellular hypertrophy of H9C2 cells stained with sarcomeric α-actinin (green) and DAPI (nuclei, blue). H9C2 cells were incubated for 24 hours with conditioned medium from 24-hour 10 ng/ml TGF-β1–stimulated RNCFs with or without 2.5 μM Y27632 (n = 30–50 each). Scale bars: 25μm. Before coculture experiments, TGF-β1 neutralizing antibody was added to the conditioned medium to block the hypertrophic effects of TGF-β1. Y27632 was also almost removed by ultrafiltration before coculture. (C–E) Quantification of RT-PCR analysis of hypertrophic markers of Acta1 (encoding skeletal muscle α-actin), Myh7 (β-myosin heavy chain), and Nppa (atrial natriuretic factor) in H9C2 cells from coculture experiments with TGF-β1–stimulated RNCFs with or without Y27632 (n = 4–5 each). **P < 0.01 vs. H9C2 cells cocultured with vehicle-stimulated RNCFs. #P < 0.05, ##P < 0.01 vs. H9C2 cells cocultured with TGF-β1–stimulated RNCFs without Y27632. (F and G) Representative fluorescent images and quantification of cellular hypertrophy of H9C2 cells, incubated with conditioned medium from TGF-β1–stimulated RNCFs transfected control, ROCK1, or ROCK2 siRNA (n = 30–40 each). Scale bars: 25 μm. TGF-β1 neutralizing antibody was added to the conditioned medium before coculture. (H–J) Quantification of RT-PCR analysis of hypertrophic markers of Acta1, Myh7, and Nppa in H9C2 cells from coculture experiments with TGF-β1–stimulated RNCFs transfected with control, ROCK1, or ROCK2 siRNA (n = 4–5 each). **P < 0.01 vs. H9C2 cells cocultured with vehicle-stimulated RNCFs transfected with control siRNA. ##P < 0.01 vs. H9C2 cells cocultured with TGF-β1–stimulated RNCFs transfected with control siRNA. ††P < 0.01 vs. H9C2 cells cocultured with TGF-β1–stimulated RNCFs transfected with ROCK1 siRNA. Data are expressed as mean ± SEM. P values were calculated using one-way ANOVA with Tukey’s HSD test.

Similar articles

Cited by

References

    1. Go AS, et al. Heart disease and stroke statistics--2013 update: a report from the American Heart Association. Circulation. 2013;127(1):e6–e245. doi: 10.1161/CIR.0b013e31828124ad. - DOI - PMC - PubMed
    1. Lee WC, Chavez YE, Baker T, Luce BR. Economic burden of heart failure: a summary of recent literature. Heart Lung. 2004;33(6):362–371. doi: 10.1016/j.hrtlng.2004.06.008. - DOI - PubMed
    1. Owan TE, Hodge DO, Herges RM, Jacobsen SJ, Roger VL, Redfield MM. Trends in prevalence and outcome of heart failure with preserved ejection fraction. N Engl J Med. 2006;355(3):251–259. doi: 10.1056/NEJMoa052256. - DOI - PubMed
    1. Steinberg BA, et al. Trends in patients hospitalized with heart failure and preserved left ventricular ejection fraction: prevalence, therapies, and outcomes. Circulation. 2012;126(1):65–75. doi: 10.1161/CIRCULATIONAHA.111.080770. - DOI - PubMed
    1. Bhatia RS, et al. Outcome of heart failure with preserved ejection fraction in a population-based study. N Engl J Med. 2006;355(3):260–269. doi: 10.1056/NEJMoa051530. - DOI - PubMed