. 2017 Jul 4;7(1):4580.
doi: 10.1038/s41598-017-04418-w.

Dynamin-2 mutations linked to Centronuclear Myopathy impair actin-dependent trafficking in muscle cells

Affiliations

Dynamin-2 mutations linked to Centronuclear Myopathy impair actin-dependent trafficking in muscle cells

Arlek M González-Jamett et al. Sci Rep. .

Abstract

Dynamin-2 is a ubiquitously expressed GTP-ase that mediates membrane remodeling. Recent findings indicate that dynamin-2 also regulates actin dynamics. Mutations in dynamin-2 cause dominant centronuclear myopathy (CNM), a congenital myopathy characterized by progressive weakness and atrophy of skeletal muscles. However, the muscle-specific roles of dynamin-2 affected by these mutations remain elusive. Here we show that, in muscle cells, the GTP-ase activity of dynamin-2 is involved in de novo actin polymerization as well as in actin-mediated trafficking of the glucose transporter GLUT4. Expression of dynamin-2 constructs carrying CNM-linked mutations disrupted the formation of new actin filaments as well as the stimulus-induced translocation of GLUT4 to the plasma membrane. Similarly, mature muscle fibers isolated from heterozygous knock-in mice that harbor the dynamin-2 mutation p.R465W, an animal model of CNM, exhibited altered actin organization, reduced actin polymerization and impaired insulin-induced translocation of GLUT4 to the sarcolemma. Moreover, GLUT4 displayed aberrant perinuclear accumulation in biopsies from CNM patients carrying dynamin-2 mutations, further suggesting trafficking defects. These results suggest that dynamin-2 is a key regulator of actin dynamics and GLUT4 trafficking in muscle cells. Our findings also support a model in which impairment of actin-dependent trafficking contributes to the pathological mechanism in dynamin-2-associated CNM.


Conflict of interest statement

P.C. declares IP protection on the RCMH cell line. All other authors have no competing financial interests to declare.

Figures

Figure 1
Figure 1
Dynamin GTP-ase activity regulates actin organization in RCMH myoblasts. (a,b) Cultured RCMH myoblasts were permeabilized during 6 min with 20 µM digitonin in the presence of G-actin-AF488, 2 mM ATP/Mg2+ and 10 µM free Ca2+, fixed and visualized by confocal microscopy. The pharmacological treatments applied during permeabilization were: 20 µM dynole 34-2, 20 µM dynole 31-2, 100 µM dynasore, 4 µM CytoD or the vehicle DMSO. (a) Examples of the formation of actin filaments in RCMH cells under different experimental conditions. Scale bar = 10 µm. (b) Quantification of total fluorescence intensity of new actin filaments. Note that dynamin GTP-ase inhibitors significantly reduce actin filament formation. Data are expressed as mean actin intensity ± SEM. Statistical comparisons were performed utilizing a two-tail t-test Welch corrected for parametric data. The symbols *, & and # denote significance compared to untreated, DMSO-treated and dynole 31-2-treated cells, respectively. N is between 15 and 28 cells, from at least three different cultures per condition. (c,d) Plated myoblasts were incubated during 15 min at 37 °C with 2 µM of the F-actin stabilizer jasplakinolide (Jasp), 4 µM CytoD, 20 µM dynole 34-2, 20 µM dynole 31-2 or the vehicle DMSO, then lysed with an actin-stabilizing buffer and ultracentrifuged to separate G- and F-actin. Samples were electrophored in 12% SDS-PAGE and developed by western blot with an anti-actin antibody; although not necessarily at the same time, all gels were run under the same experimental conditions. (c) Representative blots for G- and F-actin under different treatments. These are cropped images; full-length blots are shown in the Supplementary Fig. S1. (d) Quantification of band densities. Note that the F/G actin ratio increases in the presence of Jasp, while decreases in the presence of CytoD, as compared to DMSO-treated or untreated cells. Dynole 34-2 significantly reduced F/G ratio compared to its inactive analogue dynole 31-2. Data are expressed as means ± SEM from at least three different cultures per condition. Statistical comparisons were performed utilizing a two-tail Mann-Whitney non-parametric test. The symbols *, & and # denote significance compared to untreated, DMSO-treated and dynole 31-2-treated cells, respectively.
Figure 2
Figure 2
Pharmacological inhibition of dynamin GTP-activity reduces GLUT4 insertion in the plasma membrane of RCMH myoblasts. Cultured RCMH myoblasts were transfected with the GFP-GLUT4-HA construct and 48 ± 2 h later were stimulated for 5 min with 20 µM ionomycin in the presence of 20 µM dynole 31-2, 20 µM dynole 34-2, 4 µM CytoD or the vehicle DMSO at 37 °C, fixed, immunolabeled with an anti-HA antibody without permeabilization, incubated with a Cy3-conjugated antibody and visualized by TIRF microscopy. The plasma membrane insertion of GLUT4 was quantified as a ratio between Cy3 (red) and GFP (green) signals in the evanescent field. (a) Schematic representation of the GFP-GLUT4-HA construct; GFP is located in the N-terminal intracellular loop and the exofacial hemaglutinin (HA)-tag in the first extracellular loop. (b) Examples of TIRF images of non-treated cells under resting (upper panels) or stimulated (bottom panels) conditions (250 × 250 pixels images are shown). Note that ionomycin induces GLUT4 translocation, as the HA (Cy3) signal in the evanescent field becomes detectable (red spots). (d) 250 × 250 pixels representative images of RCMH cells stimulated in the presence of DMSO, CytoD, dynole 31-2 or dynole 34-2. Cell periphery is drawn in white. (e) HA (Cy3)/GFP ratio in the evanescent field is plotted for each experimental condition. Note that, as CytoD does, dynole 34-2 significantly inhibits the stimulus-dependent plasma membrane insertion of GLUT4. Data are means ± SEM. Statistical comparisons were performed utilizing a two-tail t-test Welch corrected for parametric data. The symbol * denote significance compared to the respective resting condition; & and # symbols denote significance compared to ionomycin-stimulated cells treated with DMSO and Dynole 31-2, respectively. N is between 20 and 29 cells, from at least three different cultures per experimental condition. Scale bar = 10 µm.
Figure 3
Figure 3
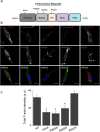
CNM-associated mutations in dynamin-2 reduce de novo actin filament formation in RCMH myoblasts. RCMH myoblasts were transfected by lipofection with EGFP-fused constructs expressing dynamin-2 WT, the GTP-ase defective mutant K44A, the middle domain mutants R369W or R465W or the PH domain mutant R522H. 48 h later, transfected cells were permeabilized with digitonin in the presence of G-actin-AF568, fixed and visualized by confocal microscopy. (a) The diagram indicates the location of the currently studied mutations. (b) Representative confocal images of the newly formed actin filaments (top panels) in RCMH myoblasts expressing Dyn2WT, K44A, R369W, R465W or R522H (middle panels). Note that CNM-mutants form dynamin-2 aggregates in the cytosol of RCMH cells (white arrows). Scale bar = 10 µm. (c) Quantification of the total intensity fluorescence of the recently formed actin. Note that, compared with WT, the expression of the mutants K44A, R369W and R465W, but not of R522H, significantly inhibits the new formation of actin filaments. Data are expressed as mean actin fluorescence intensity ± SEM. Statistical comparisons were performed utilizing a two-tail t-test Welch corrected for parametric data; *p < 0.0001 compared to Dyn2WT-transfected cells. N is between 24 and 34 cells, from at least three different cultures per experimental condition.
Figure 4
Figure 4
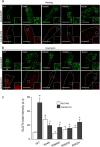
Dynamin-2-CNM-causing mutations reduce stimulus-induced translocation of endogenous GLUT4 in RCMH myoblasts. RCMH myoblasts were transfected with the dynamin-2 EGFP-fused constructs WT, K44A, R369W, R465W or R522H. 48 h later, transfected cells were stimulated with 20 μM ionomycin during 5 min, fixed, immunolabeled with a monoclonal antibody directed against GLUT4 and visualized by TIRF microscopy. Plasma membrane insertion of endogenous GLUT4 was quantified as the total intensity fluorescence of GLUT4 in the evanescent field. (a,b) Examples of TIRF images (250 × 250 pixels) of RCMH myoblasts at the resting (a) and ionomycin-stimulated condition (b). Cell periphery is drawn in white in GLUT4 panels. (c) Quantification of GLUT4 total intensity fluorescence in the evanescent field. Note that cells expressing K44A mutant exhibit significantly higher levels of GLUT4 at the resting condition compared to resting-cells expressing Dyn2WT. Ionomycin increased GLUT4 signal in Dyn2WT-transfected cells but was not enough to increase GLUT4 signal in myoblasts expressing all the mutated versions of dynamin-2. Data are expressed as the mean GLUT4 total intensity fluorescence ± SEM. Statistical comparisons were performed utilizing a two-tail t-test Welch corrected for parametric data. The symbols * and # denote significance compared to Dyn2WT-transfected resting cells and Dyn2WT-transfected stimulated cells respectively. N is between 18 and 35 cells, from at least three different cultures per experimental condition.
Figure 5
Figure 5
Actin organization and polymerization is altered in muscles of HTZ mice harboring the mutation R465W. (a) FDB muscles dissected from 2 month-old HTZ and WT mice were digested with collagenase. Fibers were isolated, fixed in PFA, permeabilized and stained with phalloidin-Rhodamine-B to visualize the actin network. Myonuclei were stained with DAPI. Representative confocal images of WT (top panels) and HTZ (bottom panels) fibers are shown. White square enclose the enlarged areas. Notice that phalloidin-staining looks altered in HTZ myofibers, exhibiting non-stained areas that did not localize with DAPI-stained nuclei (white arrows). Scale bar = 20 µm; n is between 48 and 50 fibers from eight different animals per genotype. (b) To evaluate the relative amounts of F- and G-actin, freshly dissected tibialis anterior (TA, left) and FDB muscles (right) were lysed with a commercial F/G actin in vivo assay, electrophorated by 12%-SDS-PAGE and revealed by western blot using a polyclonal actin antibody. Above are shown representative blots for F- and G-actin per muscle and genotype; these are cropped images and the original full-length blot is shown in Supplementary Fig. S2. Below are plotted the F/G actin ratios per genotype. Note that F/G tend to be lower in HTZ muscles compared to WT muscles in both TA and FDB, although this difference is only significant in TA muscles. Data are expressed as the mean F/G ratio ± SEM for muscles from at least three animals per genotype. Statistical comparisons were performed utilizing a two-tail Mann-Whitney non-parametric test. * denote significance with respect to WT-muscles. (c,d) To evaluate actin polymerization, isolated FDB myofibers were stimulated with 0.1 µM insulin during 10 min at 37 °C, permeabilized with digitonin in the presence of G-actin-AF488, fixed and visualized by confocal microscopy. (c) Representative images of newly formed actin filaments in WT and HTZ fibers. Left panels show the respective DIC images. Scale bar = 20 µm. (d) Quantification of total G-actin-AF488 fluorescence intensity. Note that HTZ fibers exhibit a decreased capability to form new actin filaments compared to WT fibers. Data are expressed as mean actin signal ± SEM. Statistical comparisons were performed utilizing a two-tail Mann-Whitney non-parametric test. The symbol * denote significance with respect to WT-fibers. N is between 24 and 25 fibers from five different animals per genotype.
Figure 6
Figure 6
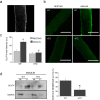
Insulin-induced translocation of GLUT4 is disrupted in muscle fibers isolated from HTZ mice. (a–c) Freshly dissected FDB muscles from 2 month-old WT and HTZ mice were digested with collagenase. Isolated fibers were stimulated during 15 min with 0.1 µM insulin to induce GLUT4 translocation, fixed and immunolabeled with a polyclonal-GLUT4 antibody. Translocation of GLUT4 was estimated by measuring the total intensity fluorescence of GLUT4 in ROIs at the sarcolemma. (a) Examples of the ROIs used are drawn in white. GLUT4 was measured on both edges of the confocal image and then averaged. (b) Examples images of GLUT4 signal in WT and HTZ fibers at the resting (left panels) and insulin-stimulated condition (right panels). Scale bar = 20 µm. (c) The graph show the averaged GLUT4 signal in sarcolemma. Note that insulin-induced GLUT4 translocation is significantly reduced in HTZ myofibers compared to WT myofibers. Data are expressed as mean GLUT4 fluorescence signal ± SEM. Statistical comparisons were performed utilizing a two-tail t-test Welch corrected for parametric data. The symbols * and # denote significance with respect to WT-resting and WT-insulin-stimulated fibers, respectively. N is between 34 and 66 fibers from at least 10 different animals per genotype. (d) FDB muscles were dissected from WT and HTZ mice, stabilized in Tyrode solution, stimulated for 30 min with 0.1 µM insulin and then exposed to 1 mg/ml of biotin at 4 °C during 60 min. After quenching with 100 mM glycine, muscles were frozen and pulverized in liquid nitrogen, lysed and centrifuged at 14.000 g for 10 min. Supernatants were mixed with streptavidin-agarose beads overnight at 4 °C and then centrifuged at 14.000 g for 3 min. Biotinylated and non-biotinylated fractions were used to evaluate GLUT4 expression by western blot. GAPDH was used as a control that only surface proteins were labeled in biotinylated fractions. On the left are shown representative blots per each condition, on the right are plotted the percentages of GLUT4 in biotinylated fractions. Data are expressed as mean GLUT4% ± SEM. Statistical comparisons were performed utilizing a two-tail t-test Welch corrected for parametric data. The symbol * denote significance with respect to WT-muscles. N is five different animals per genotype.
Figure 7
Figure 7
Abnormal perinuclear accumulation of GLUT4 in CNM skeletal muscles. Muscle biopsies from one non affected subject (control), one patient carrying the dynamin-2 mutation p.R465W (CNM) and one patient harboring a mutation in dysferlin (dysferlinopathy) were immunolabeled with a specific antibody against GLUT4 and visualized by field microscopy. In the control biopsy (left panel) GLUT4 staining is observed in sarcolemma and sarcoplasm without any particular distribution. A similar GLUT4 distribution is observed in the disferlinopathy samples (right panel); note that, even in fibers in which nuclei are centrally located (black arrows), there is not GLUT4 accumulation near nuclei in the disferlinopathy biopsy. In the CNM patient biopsy (middle panel) GLUT4 is at the sarcolemma, but strongly concentrates around nuclei in fibers with nuclear centralization (magnification x20).

Similar articles

Cited by

References

    1. Ferguson S, De Camilli P. Dynamin, a membrane-remodelling GTPase. Nat. Rev. Mol. Cell. Biol. 2012;13:75–88. - PMC - PubMed
    1. González-Jamett AM, et al. The association of dynamin with synaptophysin regulates quantal size and duration of exocytotic events in chromaffin cells. J. Neurosci. 2010;30:10683–10691. doi: 10.1523/JNEUROSCI.5210-09.2010. - DOI - PMC - PubMed
    1. González-Jamett AM, et al. Dynamin-2 Function and Dysfunction Along the Secretory Pathway. Front. Endocrinol. 2013;4:1–9. doi: 10.3389/fendo.2013.00126. - DOI - PMC - PubMed
    1. González-Jamett AM, et al. Dynamin-2 in nervous system disorders. J Neurochem. 2014;128:210–223. doi: 10.1111/jnc.12455. - DOI - PubMed
    1. Gu C, et al. Direct dynamin-actin interactions regulate the actin cytoskeleton. EMBO J. 2010;29:3593–3606. doi: 10.1038/emboj.2010.249. - DOI - PMC - PubMed

Publication types

MeSH terms

LinkOut - more resources