. 2017 Jul 18;114(29):E5920-E5929.
doi: 10.1073/pnas.1701832114. Epub 2017 Jul 3.

Synergistic effects of treating the spinal cord and brain in CLN1 disease

Affiliations

Synergistic effects of treating the spinal cord and brain in CLN1 disease

Charles Shyng et al. Proc Natl Acad Sci U S A. .

Abstract

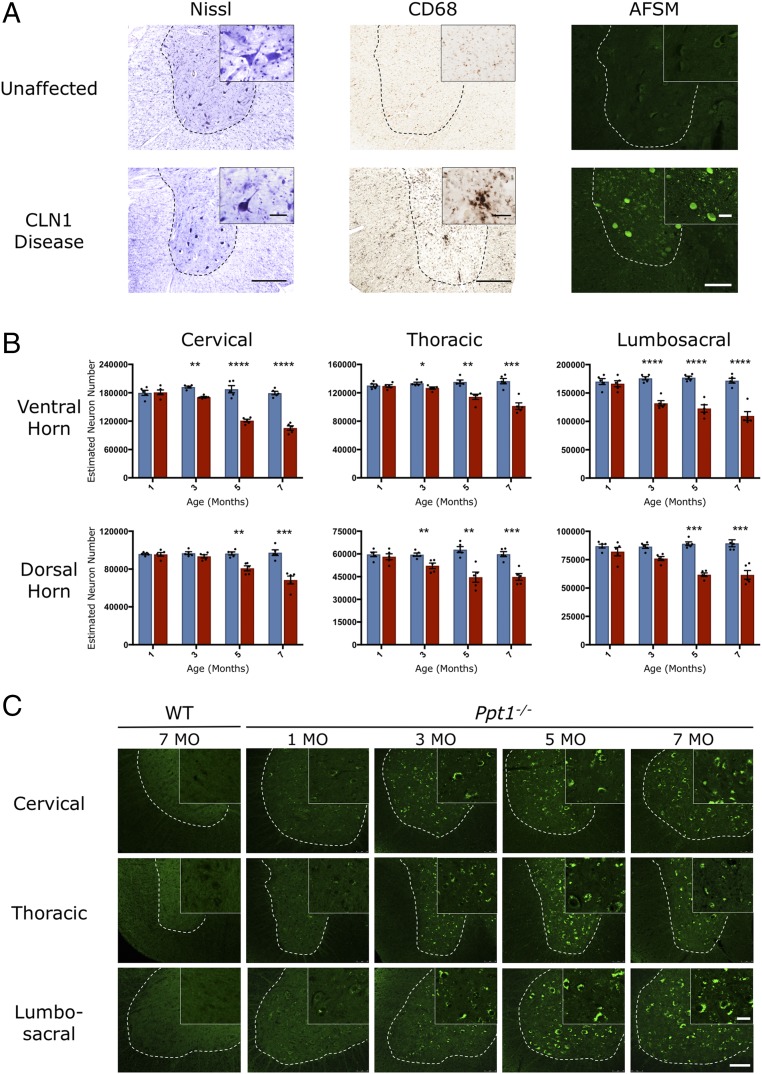
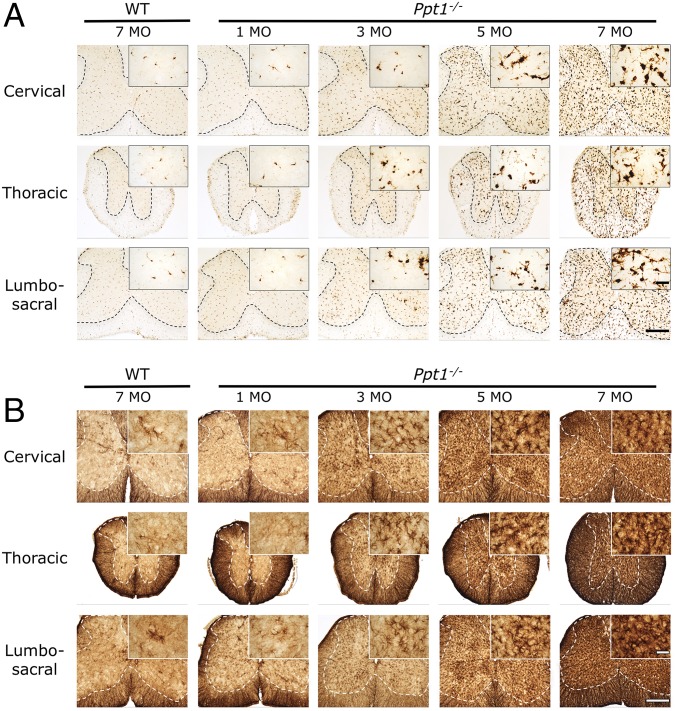
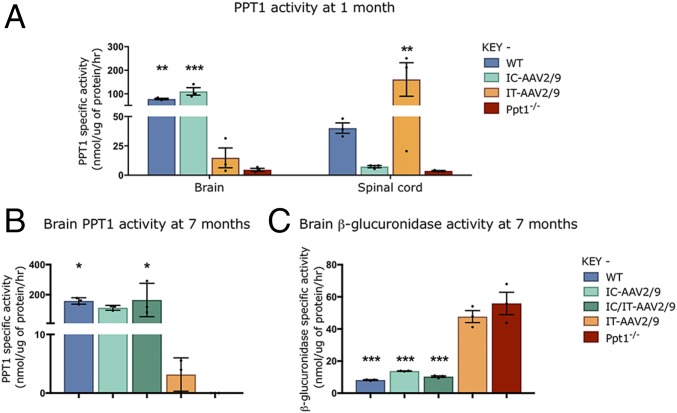
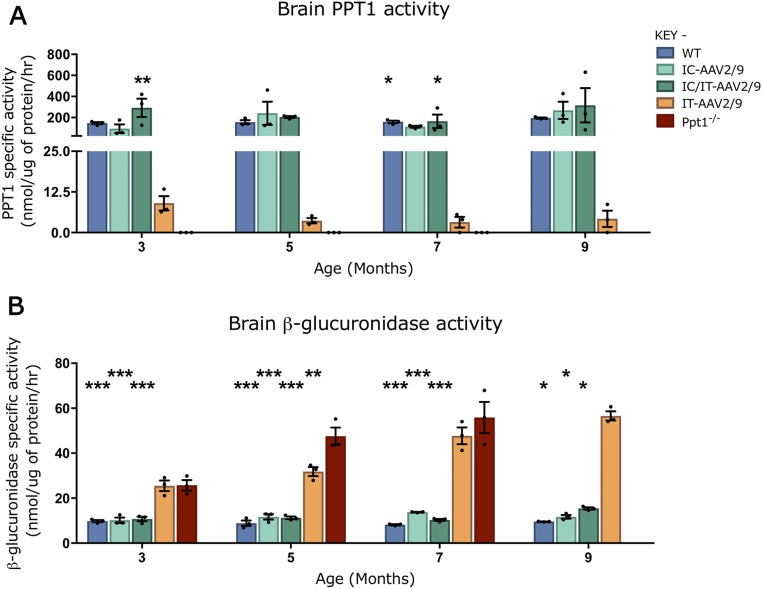
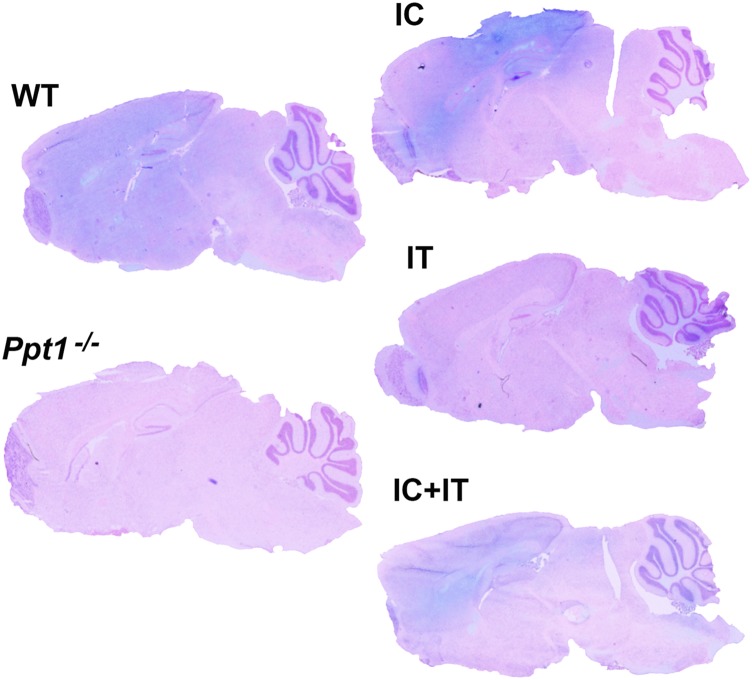
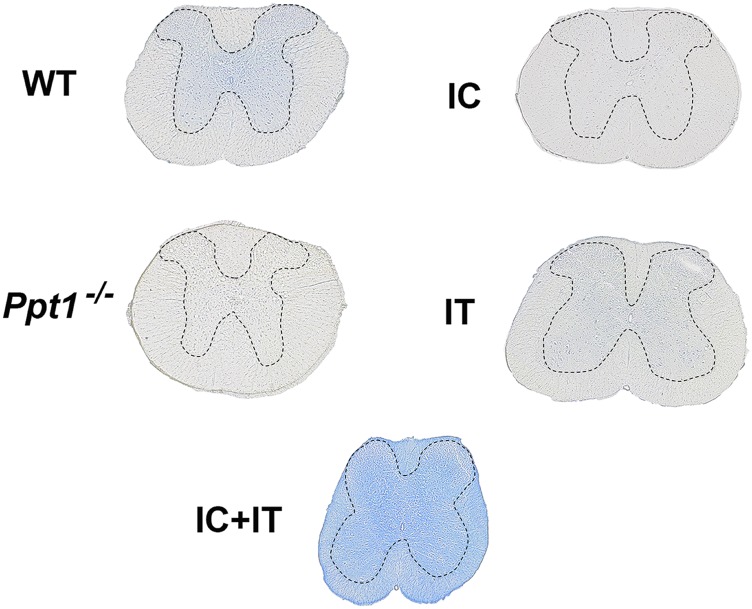
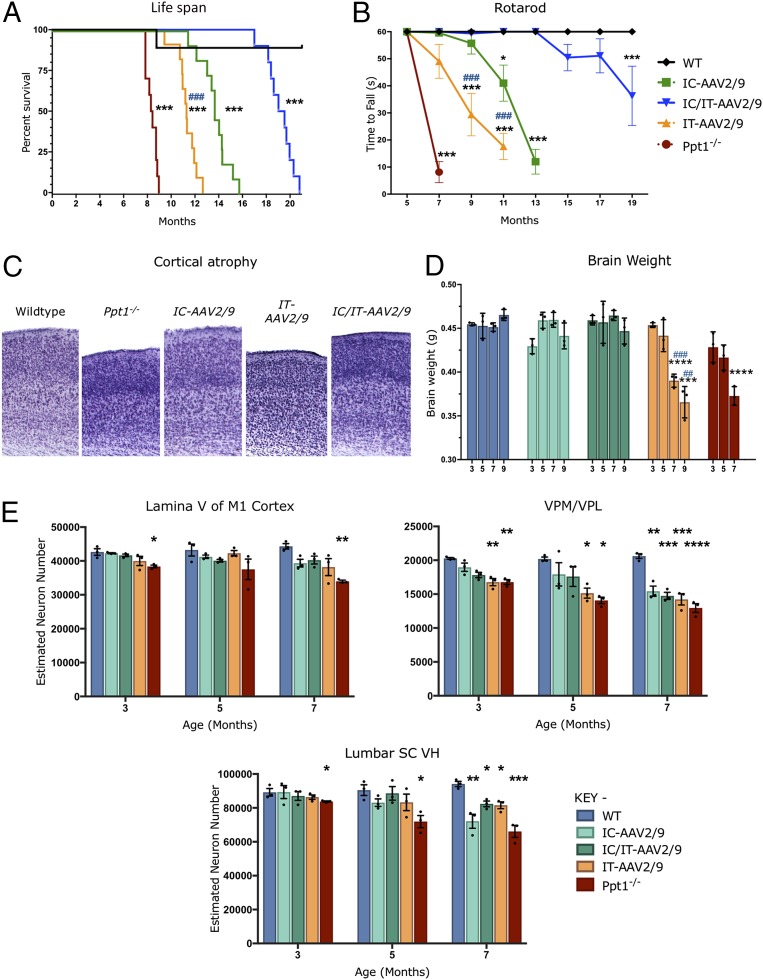
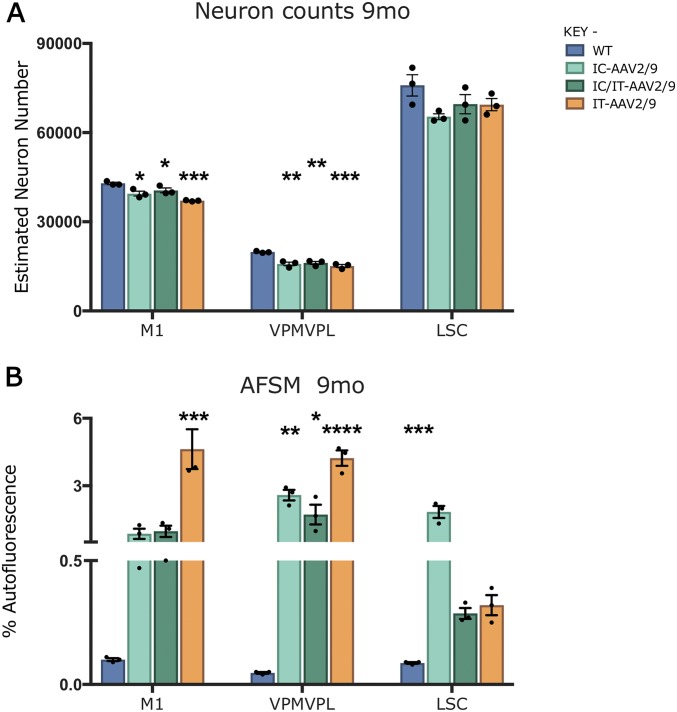
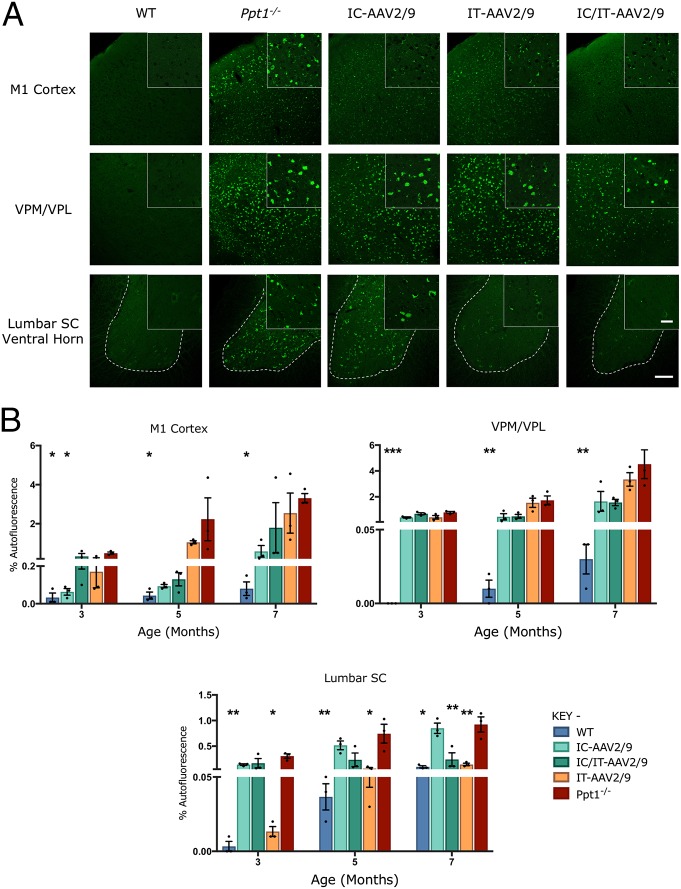
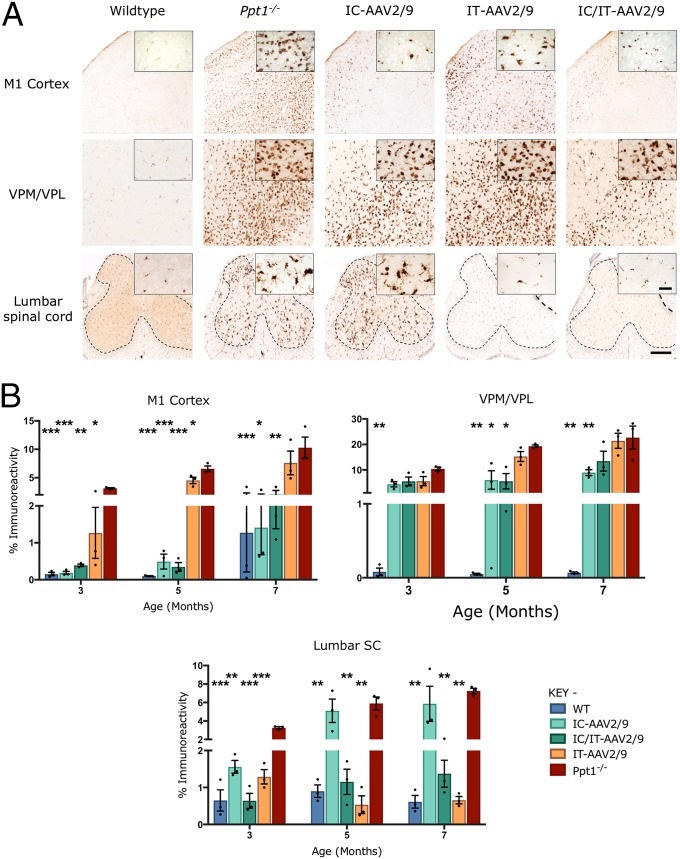
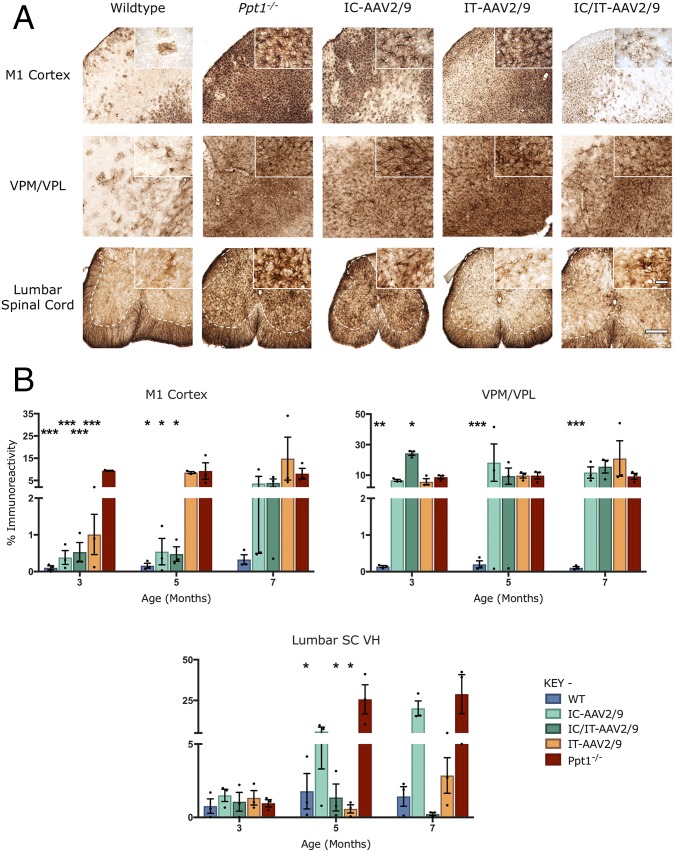
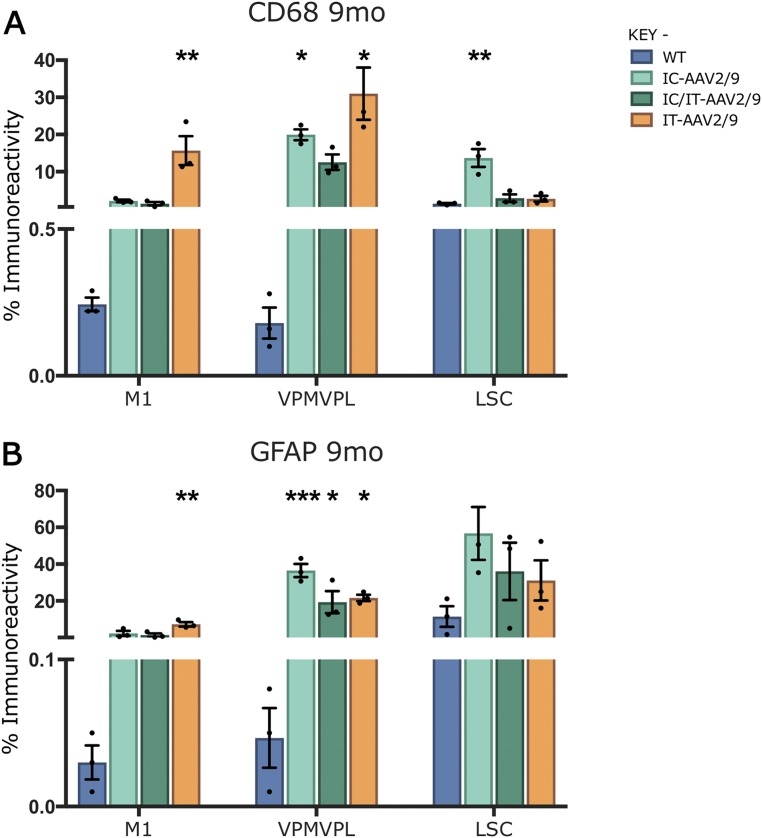
Infantile neuronal ceroid lipofuscinosis (INCL, or CLN1 disease) is an inherited neurodegenerative storage disorder caused by a deficiency of the lysosomal enzyme palmitoyl protein thioesterase 1 (PPT1). It was widely believed that the pathology associated with INCL was limited to the brain, but we have now found unexpectedly profound pathology in the human INCL spinal cord. Similar pathological changes also occur at every level of the spinal cord of PPT1-deficient (Ppt1-/- ) mice before the onset of neuropathology in the brain. Various forebrain-directed gene therapy approaches have only had limited success in Ppt1-/- mice. Targeting the spinal cord via intrathecal administration of an adeno-associated virus (AAV) gene transfer vector significantly prevented pathology and produced significant improvements in life span and motor function in Ppt1-/- mice. Surprisingly, forebrain-directed gene therapy resulted in essentially no PPT1 activity in the spinal cord, and vice versa. This leads to a reciprocal pattern of histological correction in the respective tissues when comparing intracranial with intrathecal injections. However, the characteristic pathological features of INCL were almost completely absent in both the brain and spinal cord when intracranial and intrathecal injections of the same AAV vector were combined. Targeting both the brain and spinal cord also produced dramatic and synergistic improvements in motor function with an unprecedented increase in life span. These data show that spinal cord pathology significantly contributes to the clinical progression of INCL and can be effectively targeted therapeutically. This has important implications for the delivery of therapies in INCL, and potentially in other similar disorders.

Keywords: adeno-associated virus; brain; combination therapy; infantile Batten disease; spinal cord.


Conflict of interest statement

The authors declare no conflict of interest.

Figures

Fig. 1.
Fig. 1.
Spinal cord pathology in human and murine CLN1 disease. (A) Representative bright-field images of ventral horns (demarcated by the dotted lines) of human thoracic spinal cord showing fewer, more darkly stained neurons (Nissl), an increase in the number of hypertrophied microglia (CD68), and representative confocal microscopy images showing pronounced accumulation of autofluorescent storage material in human post mortem CLN1 disease tissue compared with an unaffected control. [Scale bars, 200 μm (bright field, Left and Center), 100 μm (confocal, Right), and 25 μm (Insets).] (Insets) Selected from corresponding lower-power views. (B) Unbiased optical fractionator counts reveal significant loss of Nissl (cresyl fast violet)-stained neurons in the dorsal and ventral horns of the spinal cords of PPT1-deficient (red bars) mice as early as 3 mo of age, compared with age-matched wild-type controls (blue bars). Dots represent scatterplots of individual animals. *P < 0.05, **P < 0.01, ***P < 0.001, ****P < 0.0001, two-tailed, unpaired parametric t test. Values are shown as mean ± SEM (n = 5 mice per group). (C) Representative confocal microscopy images of unstained sections showing the progressive accumulation of autofluorescent storage material (green) within morphologically identified neuronal cell bodies in the ventral horns (represented by the dotted lines) of the lumbosacral cord of Ppt1−/− mice as early as 3 mo, compared with age-matched wild-type controls. [Scale bars, 100 μm and 25 μm (Insets).] (Insets) Selected from corresponding lower-power views.
Fig. 2.
Fig. 2.
Ppt1−/− mouse spinal cord shows progressive glial activation at all levels. Representative bright-field microscopy images of the spinal cords of Ppt1−/− and wild-type control mice reveal the increased abundance, hypertrophy, and increased staining intensity of CD68-positive microglia (A) and GFAP-positive astrocytes (B) in mutant mice as early as 3 mo of age at all levels of the spinal cord. This glial activation progressively increases with age. The dotted lines demarcate the boundary between the gray and white matter. [Scale bars, 200 μm and 25 μm (Insets).] (Insets) Selected from corresponding lower-power views.
Fig. 3.
Fig. 3.
Changes in PPT1 and secondary enzyme activity in regions targeted with AAV2/9-mediated gene therapy. There were reciprocal increases in PPT1 activity between intrathecally (IT-AAV2/9) and intracranially (IC-AAV2/9) injected mice in the spinal cord and brain, respectively, at 1 mo (A). PPT1 levels in the brains of wild-type and IC-AAV2/9–injected mice were significantly increased compared with Ppt1−/−, whereas IT-AAV2/9–injected mice showed significantly elevated levels of PPT1 in the spinal cord. At 7 mo, the brains of IC-AAV2/9 and combination-treated mice (IC/IT-AAV2/9) show significant increases in PPT1 activity (B) and significant decreases in β-glucuronidase activity (C), similar to WT mice, compared with Ppt1−/− mice. Dots represent scatterplots of individual animals. *P < 0.05, **P < 0.01, ***P < 0.001, one-way ANOVA with post hoc Bonferroni correction. Values shown are mean ± SEM (n = 3 mice per group).
Fig. S1.
Fig. S1.
Enzymatic activity of PPT1 and β-glucuronidase over time in brains of treated animals. (A) PPT1 activity was increased in the brain for intracranial (IC-AAV2/9) and combination intracranial/intrathecal (IC/IT-AAV2/9)–treated mice to near–wild-type or supraphysiological levels at all time points measured. There was a small increase in PPT1 activity in the intrathecal (IT-AAV2/9) brain (∼2 to 5% of WT levels) at all time points. (B) β-Glucuronidase activity in the brain is increased in the untreated Ppt1−/− mice until 7 mo, after which these mice are terminal. IT-AAV2/9–treated mouse brains had increased β-glucuronidase levels compared with WT until 9 mo. IC-AAV2/9 and IC/IT-AAV2/9 brains have near-WT levels of β-glucuronidase at all time points, and all are significantly decreased compared with Ppt1−/− mouse levels at 3, 5, and 7 mo. IC-AAV2/9, IC/IT-AAV2/9, and WT mice show decreased β-glucuronidase levels compared with IT-AAV2/9 at 9 mo. Dots represent scatterplots of individual animals. *P < 0.05, **P < 0.01, ***P < 0.001, one-way ANOVA with post hoc Bonferroni correction. Values shown are mean ± SEM (n = 3 mice per group).
Fig. S2.
Fig. S2.
Histochemical stain for PPT1 activity in the brain. PPT1 activity is depicted in blue. Sagittal sections through the forebrain and cerebellum were counterstained with Nuclear Fast Red (pink). There is broad diffuse blue staining in the wild-type control brain, which is not seen in the Ppt1−/− brain. Following intracranial injection, blue staining is visible throughout the cortex and hippocampus with some light staining in the cerebellum. Intrathecal injection results in light staining in the cerebellum and brainstem. Combination intracranial and intrathecal (IC+IT) injection results in intense staining in the cortex and hippocampus as well as broad diffuse staining throughout the cerebellum and brainstem.
Fig. S3.
Fig. S3.
Histochemical stain for PPT1 activity in the spinal cord. PPT1 activity is depicted in blue, in transverse sections of the spinal cord that are not counterstained. There is diffuse staining in the gray matter of the wild-type spinal cord, which is not seen in the Ppt1−/− tissue. Following intrathecal injection into Ppt1−/− mice, diffuse blue staining is visible primarily in the gray matter. Intracranial injection into Ppt1−/− mice results in no obvious blue staining in any part of the spinal cord. In contrast, combination intracranial and intrathecal (IC+IT) injection into Ppt1−/− mice results in widespread intense staining across white matter and gray matter of the spinal cord. Dotted lines demarcate the borders between spinal gray and white matter.
Fig. 4.
Fig. 4.
Targeted AAV2/9-mediated gene therapy delays disease progression and prevents neuron loss. (A) Kaplan–Meier survival curve showing that the median life span for combination IC/IT-treated mice (IC/IT-AAV2/9) (blue) is significantly greater than either intrathecally (IT-AAV2/9) (yellow) or intracranially (IC-AAV2/9) treated mice (green) (n = 10 mice per group). Analysis by log-rank test for trend was significant for overall survival (P < 0.0001). Individual comparisons between curves, using Bonferroni correction for multiple comparisons, were each significant (***P < 0.001) for each group compared with the wild type, as well as between intrathecally (IT-AAV2/9) and intracranially (IC-AAV2/9) treated mice (###P < 0.001). (B) Constant-speed rotarod test revealed that untreated Ppt1−/− mice (red) were unable to stay on the rotarod past 7 mo, intrathecally (IT-AAV2/9) treated mice (yellow) could not stay on the rotarod past 11 mo, intracranially (IC-AAV2/9) treated mice (green) could not stay on the rotarod past 13 mo, and combination IC/IT-treated mice (IC/IT-AAV2/9) (blue) showed deficits at 15 mo and could not stay on the rotarod past 19 mo. Statistical significance for each group compared with wild-type mice (*P < 0.05, ***P < 0.001), and compared between intrathecally (IT-AAV2/9) and intracranially (IC-AAV2/9) treated mice (###P < 0.001), two-way repeated-measure ANOVA (n = 10 mice per group). (C) Representative images of cortices from treated animals in Nissl (cresyl fast violet)-stained sections showing near–wild-type thickness of IC-AAV-2/9– and IC/IT-AAV2/9–treated mouse cortices but not in IT-AAV2/9–treated mice. (D) Brain weights for IC-AAV2/9– and IC/IT-AAV2/9–treated mice were essentially the same as WT mice at all time points examined. However, IT-AAV2/9–treated and untreated Ppt1−/− mice showed a significant reduction in brain weight compared with WT brain weight at 7 and 9 mo. Dots represent scatterplots of individual animals. Significance is compared with wild-type mice (***P < 0.001, ****P < 0.0001), and compared between intrathecally (IT-AAV2/9) and intracranially (IC-AAV2/9) treated mice (##P < 0.01, ###P < 0.001), two-way repeated-measure ANOVA (n = 3 mice per group). (E) Unbiased optical fractionator counts of Nissl (cresyl fast violet)-stained neurons at 3, 5, and 7 mo post injection in the M1 motor cortex, VPM/VPL of the thalamus, and ventral horn (VH) of the lumbar spinal cord show that targeted AAV-2/9–mediated gene therapy has a neuroprotective effect. Significance is compared with untreated WT mice at all time points. Dots represent scatterplots of individual animals. *P < 0.05, **P < 0.01, ***P < 0.001, ****P < 0.0001, one-way ANOVA with post hoc Bonferroni correction. Values shown are mean ± SEM (n = 3 mice per group).
Fig. S4.
Fig. S4.
Neuron loss and storage material accumulation in treated mice at 9 mo. (A) Unbiased optical fractionator counts of neurons at 9 mo in Nissl-stained sections showing that intracranially (IC-AAV2/9), intrathecally (IT-AAV2/9), and combination- (IC/IT-AAV2/9) treated mice have significantly decreased neuron counts in the M1 motor cortex compared with wild-type mice. All treated groups also show significantly decreased counts in the thalamus (VPM/VPL) compared with WT mice. However, there is no change between treatment groups and WT in the ventral horn of the lumbosacral spinal cord (LSC). (B) Thresholding image analysis of autofluorescent storage material is significantly increased in the thalamus in all treated groups compared with WT. In the M1 motor cortex, the IT-AAV2/9 AFSM levels are significantly increased compared with WT. In the spinal cord, AFSM levels in the IC-AAV2/9 spinal cord are significantly increased compared with WT. Dots represent scatterplots of individual animals. *P < 0.05, **P < 0.01, ***P < 0.001, ****P < 0.0001, one-way ANOVA with post hoc Bonferroni correction. Values shown are mean ± SEM (n = 3 mice per group).
Fig. 5.
Fig. 5.
Targeted gene therapy reduces storage material accumulation in Ppt1−/− mice. (A) Representative confocal microscopy images of treated animals and controls at 7 mo showing the primary motor cortex, VPM/VPL of the thalamus, and ventral horn of the lumbar spinal cord with differential patterns of reduction of autofluorescent storage material accumulation in intracranially (IC-AAV2/9), intrathecally (IT-AAV2/9), and combination intracranially and intrathecally (IC/IT-AAV2/9) treated mice, compared with untreated Ppt1−/− and wild-type control mice. IC/IT-AAV2/9 mice show an overall greater reduction in AFSM than either IC-AAV2/9 or IT-AAV2/9 therapy alone. The dotted lines demarcate the boundary between the gray and white matter in spinal cord sections. [Scale bars, 100 μm and 25 μm (Insets).] (Insets) Selected from corresponding lower-power views. (B) Thresholding image analysis at 3-, 5-, and 7-mo time points showing a significant but differential pattern of the reduction of AFSM accumulation based on the site of vector administration, with IC/IT-treated mice showing the greatest overall reduction of AFSM. Significance is compared with untreated Ppt1−/− mice. Dots represent scatterplots of individual animals. *P < 0.05, **P < 0.01, ***P < 0.001, one-way ANOVA with post hoc Bonferroni correction. Values shown are mean ± SEM (n = 3 mice per group).
Fig. 6.
Fig. 6.
Targeted gene therapy reduces microglial activation in Ppt1−/− mice. (A) Representative images of CD68 staining in treated animals and controls at 7 mo. CD68 staining was examined in the primary motor cortex, VPM/VPL of the thalamus, and ventral horn of the lumbar spinal cord showing differential patterns of reduction of microglial activation in intracranially (IC-AAV2/9), intrathecally (IT-AAV2/9), and combination intracranially and intrathecally (IC/IT-AAV2/9) treated mice, compared with untreated Ppt1−/− and wild-type control mice. IC/IT-AAV2/9 mice showed an overall greater reduction in microglial activation than either IC-AAV2/9 or IT-AAV2/9 therapy alone. The dotted lines demarcate the boundary between the gray and white matter in spinal cord sections. [Scale bars, 200 μm and 25 μm (Insets).] (Insets) Selected from corresponding lower-power views. (B) Thresholding image analysis at 3-, 5-, and 7-mo time points revealed a significant but region-specific pattern in the impact upon microglial activation based on the site of vector administration, with IC/IT-AAV2/9–treated mice showing the greatest overall reduction of microglial activation. Significance is compared with untreated Ppt1−/− mice. Dots represent scatterplots of individual animals. *P < 0.05, **P < 0.01, ***P < 0.001, one-way ANOVA with post hoc Bonferroni correction. Values shown are mean ± SEM (n = 3 mice per group).
Fig. 7.
Fig. 7.
Combination gene therapy reduces astrocytosis in Ppt1−/− mice. (A) Representative images of GFAP staining in treated animals and controls at 7 mo, examined in the primary motor cortex, VPM/VPL of the thalamus, and ventral horn of the lumbar spinal cord, showing differential patterns of reduction of astrocytosis in intracranially (IC-AAV2/9), intrathecally (IT-AAV2/9), and combination intracranially and intrathecally (IC/IT-AAV2/9) treated Ppt1−/− mice, compared with untreated Ppt1−/− and wild-type control mice. IC/IT-AAV2/9 mice showed an overall greater reduction in astrocytosis than either IC-AAV2/9 or IT-AAV2/9 therapy alone. The dotted lines demarcate the boundary between the gray and white matter in spinal cord sections. [Scale bars, 200 μm and 25 μm (Insets).] (Insets) Selected from corresponding lower-power views. (B) Thresholding image analysis at 3-, 5-, and 7-mo time points showing a significant but treatment-specific pattern of the reduced astrocytosis based on the site of vector administration, with IC/IT-AAV2/9–treated mice showing the greatest overall reduction of astrocytosis. Significance is compared with untreated Ppt1−/− mice. Dots represent scatterplots of individual animals. *P < 0.05, **P < 0.01, ***P < 0.001, one-way ANOVA with post hoc Bonferroni correction. Values shown are mean ± SEM (n = 3 mice per group).
Fig. S5.
Fig. S5.
Glial activation in treated mice at 9 mo. Thresholding image analysis of CD68-positive microglia (A) reveals significantly increased microglial activation in the thalamus of intracranially (IC-AAV2/9) and intrathecally (IT-AAV2/9) treated mice compared with combination IC/IT-AAV2/9–treated and wild-type mice. In the M1 motor cortex, IT-AAV2/9–treated mice show significantly increased microglial activation compared with WT, whereas IC-AAV2/9 spinal cords showed significantly higher microglial activation compared with WT. Similar analysis of GFAP-stained tissue (B) for astrocytosis revealed that GFAP staining was significantly increased in the thalamus of all treated groups compared with wild type. In the M1 motor cortex, IT-AAV2/9 GFAP staining was significantly increased compared with WT. Dots represent scatterplots of individual animals. *P < 0.05, **P < 0.01, ***P < 0.001, one-way ANOVA with post hoc Bonferroni correction. Values shown are mean ± SEM (n = 3 mice per group).
Fig. 8.
Fig. 8.
Brain cytokine levels in treated animals at 7 mo. (A) The levels of various cytokines were measured in brain homogenates from treated and untreated WT and Ppt1−/− animals. There were no significant differences in the general proinflammatory cytokines TNF-α [with the exception of intrathecal (IT-AAV2/9) vs. combination intracranial/intrathecal (IC/IT-AAV2/9)] or IFN-γ between any of the groups. (B) Analysis of CXC-motif chemokines showed a significant increase in CXC-motif chemokines in Ppt1−/− and IT-AAV2/9 animals. IC/IT-AAV2/9 animals had a significant decrease in CXCL1 and CXCL2 at 7 mo. (C) CC-motif chemokines showed a significant increase in Ppt1−/− and IT-AAV2/9 mice. IC/IT-AAV2/9 animals had significantly decreased levels of CCL2, CCL7, and CCL5 at 7 mo. Overall, IC/IT-AAV2/9–treated mice showed chemokine levels similar to wild-type mice. Both CXC- and CC-motif chemokines are monocyte and leukocyte chemoattractive and activation molecules. Statistical comparisons were made with untreated Ppt1−/− mice. Values shown are mean ± SEM (n = 3 mice per group). Dots represent scatterplots of individual animals. *P < 0.05, **P < 0.01, ***P < 0.001, one-way ANOVA with post hoc Bonferroni correction.

Similar articles

Cited by

References

    1. Jalanko A, Braulke T. Neuronal ceroid lipofuscinoses. Biochim Biophys Acta. 2009;1793:697–709. - PubMed
    1. Warrier V, Vieira M, Mole SE. Genetic basis and phenotypic correlations of the neuronal ceroid lipofusinoses. Biochim Biophys Acta. 2013;1832:1827–1830. - PubMed
    1. Geraets RD, et al. Moving towards effective therapeutic strategies for neuronal ceroid lipofuscinosis. Orphanet J Rare Dis. 2016;11:40. - PMC - PubMed
    1. Santavuori P, Haltia M, Rapola J. Infantile type of so-called neuronal ceroid-lipofuscinosis. Dev Med Child Neurol. 1974;16:644–653. - PubMed
    1. Vesa J, et al. Mutations in the palmitoyl protein thioesterase gene causing infantile neuronal ceroid lipofuscinosis. Nature. 1995;376:584–587. - PubMed

Publication types

MeSH terms