. 2017 Jul 6;547(7661):118-122.
doi: 10.1038/nature22981. Epub 2017 Jun 26.

Electron cryo-microscopy structure of the mechanotransduction channel NOMPC

Affiliations

Electron cryo-microscopy structure of the mechanotransduction channel NOMPC

Peng Jin et al. Nature. .

Abstract

Mechanosensory transduction for senses such as proprioception, touch, balance, acceleration, hearing and pain relies on mechanotransduction channels, which convert mechanical stimuli into electrical signals in specialized sensory cells. How force gates mechanotransduction channels is a central question in the field, for which there are two major models. One is the membrane-tension model: force applied to the membrane generates a change in membrane tension that is sufficient to gate the channel, as in the bacterial MscL channel and certain eukaryotic potassium channels. The other is the tether model: force is transmitted via a tether to gate the channel. The transient receptor potential (TRP) channel NOMPC is important for mechanosensation-related behaviours such as locomotion, touch and sound sensation across different species including Caenorhabditis elegans, Drosophila and zebrafish. NOMPC is the founding member of the TRPN subfamily, and is thought to be gated by tethering of its ankyrin repeat domain to microtubules of the cytoskeleton. Thus, a goal of studying NOMPC is to reveal the underlying mechanism of force-induced gating, which could serve as a paradigm of the tether model. NOMPC fulfils all the criteria that apply to mechanotransduction channels and has 29 ankyrin repeats, the largest number among TRP channels. A key question is how the long ankyrin repeat domain is organized as a tether that can trigger channel gating. Here we present a de novo atomic structure of Drosophila NOMPC determined by single-particle electron cryo-microscopy. Structural analysis suggests that the ankyrin repeat domain of NOMPC resembles a helical spring, suggesting its role of linking mechanical displacement of the cytoskeleton to the opening of the channel. The NOMPC architecture underscores the basis of translating mechanical force into an electrical signal within a cell.


Figures

Extended Data Figure 1
Extended Data Figure 1. Verification of recombinant NOMPC activity
a, Pressure-induced mechanogated current measured at -60 mV from outside-out patches excised from HEK293 cells untransfected (left) or transfected (right) with the NOMPC construct used for structure determination. b, TIRF microscopy images of surface anchored and fluorescently labeled microtubules (pseudo-colored in magenta) are not decorated by purified Strep-GFP alone (top) but by Strep-GFP-tagged NOMPC (bottom), demonstrating that purified NOMPC is capable of binding microtubules, and this binding is not through interaction between the Strep tag and residual streptavidin on the surface.
Extended Data Figure 2
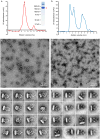
Extended Data Figure 2. Negative stain analysis of purified NOMPC
a, Size-exclusion chromatography of NOMPC after exchange from DDM into amphipol A8-35. The peak fraction corresponding to NOMPC tetramer (indicated by arrow) was examined by SDS–polyacrylamide gel electrophoresis. The NOMPC monomer (∼190 kD) band is indicated by arrow head. The upper bands may correspond to incompletely disassociated NOMPC oligomers. b, Size-exclusion chromatography of NOMPC reconstituted into lipid nanodisc with MSP2N2. The peak fraction corresponding to NOMPC is indicated by arrow. c, d, Raw micrographs of NOMPC-amphipol (c) and NOMPC–nanodisc (d) samples examined by negative stain EM. Both showed mono dispersed and homogeneous particles. e, f, 2D class averages of NOMPC particles in amphipol (e) or nanodisc (f) by negative stain EM, with the nanodisc sample showing better ordered features than the amphipol sample.
Extended Data Figure 3
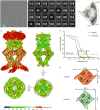
Extended Data Figure 3. Cryo-EM analysis of NOMPC in amphipol
a, A raw cryo-EM micrograph of NOMPC recorded as described in Methods. b, 2D class averages of the cryo-EM micrographs with a particle box size of 400 pixels (486Å). c, Euler angle distribution of all particles used for the final 3D reconstruction. The size of the sphere is proportional to the amount of particles visualized from that specific orientation. d, Final unsharpened 3D density map of NOMPC-amphipol colored with local resolution at a low isosurface level (top left) to enable visualization of the amphipol layer, and at a high isosurface level in side (top right), top (bottom right) and bottom (bottom left) views. e, FSC curves between two independently refined half maps before (red) and after (blue) post-processing in RELION, indicated with resolutions corresponding to FSC=0.143. f, Density maps of NOMPC in amphipol (top) and in nanodisc (bottom) with a C1 symmetry derived from all particles picked. Comparison of the maps shows NOMPC-nanodisc is closer to a four-fold symmetric structure.
Extended Data Figure 4
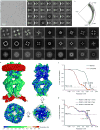
Extended Data Figure 4. Cryo-EM analysis of NOMPC reconstituted in nanodisc
a, A raw cryo-EM micrograph of NOMPC recorded as described in Methods. b, 2D class averages of the cryo-EM micrographs with a particle box size of 400 pixels (486Å). c, Euler angle distribution of all particles used for the final 3D reconstruction. The size of the sphere is proportional to the amount of particles visualized from that specific orientation. d, Slices through the unsharpened density map at different levels along the channel symmetry axis. The slice numbers starting from the cytoplasmic side are marked. e, Final unsharpened 3D density map of NOMPC-nanodisc colored with local resolution at a low isosurface level (top left) to enable visualization of the lipid bilayer, and at a high isosurface level in side (top right), top (bottom right) and bottom (bottom left) views. f, FSC curves between two independently refined half maps before (red) and after (blue) post-processing in RELION, indicated with resolutions corresponding to FSC=0.143. g, Cross-validation using FSC curves of the density map calculated from the refined model versus half map 1 (work, green), versus half map 2 (free, pink) and versus summed map (blue).
Extended Data Figure 5
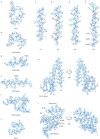
Extended Data Figure 5. Selected segments of cryo-EM density
a-j, Representative cryo-EM densities of various NOMPC domains as indicated are superimposed on the atomic model. k, Density map of pre-S1 elbow, S1 and S4. l, Density map of stacked S4-S5 linker, TRP domain and linker helices that couple ARs to the pore through domain interactions. All the density maps (a-l) are shown as cyan meshes, and the model is shown as sticks and colored according to atom type (C: light grey; N: blue; O: red; S: yellow).
Extended Data Figure 6
Extended Data Figure 6. Atomic model of NOMPC
a-d, Ribbon diagrams of NOMPC atomic model for residues Asn 125–Trp 1602 and Gly1689-Arg1670. The entire AR domain of 29 ARs was resolved. e, Ribbon diagrams showing two views of one NOMPC subunit denoting specific domains
Extended Data Figure 7
Extended Data Figure 7. Pore profile and channel properties of NOMPC and NOMPC mutants
a, Pore radius calculated by the CAVER program. b, I-V curves from the steady-state currents of whole cell recording from S2 cells expressing NOMPC or NOMPC mutants suggesting that both W1572A and I1554A mutations resulted in large basal current in the absence of applied pressure (wild type: n=7; W1572A: n=7; I1554A: n=3). Cells expressing I1554A mutant channels displayed very large basal currents and were not amenable to recording from excised patch recording of mechanogated current. c, Dose-dependent curves of pressure-induced mechanogated currents measured at -60 mV from outside-out patches excised from S2 cells expressing NOMPC or NOMPC mutants (n=7). d, Representative images of unpermeabilized staining of S2 cells expressing control proteins or H1423A mutant. The surface staining signal from a number of cells (n>30 for each sample) were visually surveyed under fluorescent microscope. All cells expressing wild type (middle row) and H1423A mutant (bottom row) NOMPC showed similar levels of surface expression, indicating that the H1423A mutant is properly localized to the plasma membrane like the wild type. All error bars (b, c) denote ± standard deviation.
Extended Data Figure 8
Extended Data Figure 8. 3D classification of NOMPC-nanodisc particles
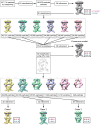
The flowchart of classification procedures with RELION is shown. After 1 round of 2D classification, 190,879 particles were subjected to 3D refinement, yielding a 3.7Å map (C4 imposed). Following 3D classification of these particles, 175,314 particles were selected and refined, yielding the final map at 3.55Å resolution (C4 imposed), which was used to build the ‘consensus model’. Additional classification of these 175,314 particles using a mask to exclude all regions outside the AR domain gave 3 major classes, which were subsequently refined to ∼3.8-4.0Å resolution.
Extended Data Figure 9
Extended Data Figure 9. Flexibility of AR domains and model of NOMPC mechanogating
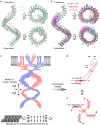
a, Superposition of NOMPC AR domains from three classes are shown in three views as indicated. Overall, the entire AR domains from all three classes overlap well with each other. There are small differences in some ARs, which is caused by slight shift of individual AR as rigid body, suggesting small mobility and plasticity of the AR domain. b, Superposition of NOMPC AR domain (blue) with human Ankyrin-B AR domain (pink) shown in three views as indicated, suggesting that elastic deformation of NOMPC AR domain under pressure could potentially be more dramatic than the shift presumably caused by thermal motion as shown in a. A peptide from the C-terminal region of Ankyrin-R, which was added to stabilize Ankyrin-B ARs for crystallization by forming an auto-inhibitory segment (AS) structure, is also shown here (AnkR AS, in orange). c, Schematic of NOMPC (without precise depiction of domain swap between neighboring subunits) showing the N-terminus tethered to a microtubule. Mechanical force is transduced from the microtubule cytoskeleton to NOMPC, possibly causing lateral movement, extension, compression or torsion of the AR domain. d, e, Movement of the AR domain that immediately precedes the linker helices results in displacement of the TRP domain and S4-S5 linker that are connected to the ends of the pore domain, triggering channel opening.
Extended Data Figure 10
Extended Data Figure 10. Sequence alignment of NOMPC orthologues
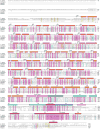
Sequence homology of NOMPC orthologues were analyzed by clustal omega. The conserved residues are highlighted. The two residues (His1423 and Trp1572), which were shown in this study to be critical for mechanogating, are marked by red triangles. Secondary structure elements are indicated above the sequence.
Figure 1
Figure 1. 3D reconstruction of NOMPC
a–d, NOMPC density map in nanodisc (EMD-8702). Unsharpened (transparent) and sharpened (solid and color coded) maps are shown, from side (a, b), top (c) and bottom (d). e, Diagram illustrating major structural domains of one subunit, color coded to match ribbon diagrams in f. Dashed lines denote regions where the density map is insufficient for model building. ARs 1-7 are colored in pale red because its density is insufficient to position side chains. f, Ribbon diagram showing one NOMPC subunit denoting specific domains (pdb code: 5VKQ).
Figure 2
Figure 2. Architecture of the ion permeation pathway of NOMPC
a, Solvent-accessible pathway along the ion permeation pore illustrated as blue surface. Residues located at the selectivity filter and lower gate are rendered as sticks. b, Top view of the NOMPC pore region is shown in surface representation, colored by the electrostatic potentials (negative: red; positive: blue).
Figure 3
Figure 3. Lipid-protein and linker domain interactions
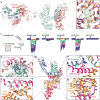
a, The transmembrane domains of two adjacent subunits are shown in blue and red from the cytosolic face (left) and with the cytosolic domain facing down (right). The lipid bound to the S4-S5 linker of the red subunit is colored green. b, Enlarged view of boxed region of NOMPC shows the density map (green mesh) of the lipid superimposed with an atomic model of the bound phospholipid. The side chain of His1423 from the S4–S5 linker is close (∼2.9Å) to the lipid headgroup, and the adjacent His1424 is further away (∼4.8Å). c, Representative traces of mechanogated current of wild type NOMPC and NOMPC mutants (H1423A, H1424A, K1573A and W1572A) under pressure ranged from 10 mmHg to 50 mmHg with 10 mmHg increment, recorded by outside-out patch clamp. The H1424A and K1573A mutations are negative controls showing that not any random mutation in the S4-S5 linker or TRP domain abolishes mechanogated current of NOMPC. d-g, Enlarged views from the boxed regions showing key interactions between residues from interacting domains. Hydrogen bonds are indicated as dashed lines (d, e). EM density is shown in mesh (f).
Figure 4
Figure 4. Motion of the AR domain
a, Interactions between the adjacent ARs. Residues with charged and polar side chains are indicated as colored balls (negative: red; positive: blue). b, Three sub-classes with different conformation in ARs. c-f, Comparison of class 1 and 2 at different positions along the ARs and linker domain. The ARs shifted vertically along the symmetry axis at the lower junction in the vicinity of AR9 (c) and laterally relative to the symmetry axis above the upper junction, at AR29 (d). While there is no obvious vertical movement at the linker regions, there is a small domain rotation (e and f).

Comment in

Similar articles

Cited by

References

    1. Árnadóttir J, Chalfie M. Eukaryotic Mechanosensitive Channels. Annu Rev Biophys. 2010;39:111–137. - PubMed
    1. Anishkin A, Kung C. Stiffened lipid platforms at molecular force foci. Proc Natl Acad Sci U S A. 2013;110:4886–92. - PMC - PubMed
    1. Brohawn SG, del Marmol J, MacKinnon R. Crystal Structure of the Human K2P TRAAK, a Lipid- and Mechano-Sensitive K+ Ion Channel. Science. 2012;335:436–441. - PMC - PubMed
    1. Brohawn SG, Campbell EB, MacKinnon R. Physical mechanism for gating and mechanosensitivity of the human TRAAK K+ channel. Nature. 2014;516:126–130. - PMC - PubMed
    1. Lolicato M, Riegelhaupt PM, Arrigoni C, Clark KA, Minor DL. Transmembrane helix straightening and buckling underlies activation of mechanosensitive and thermosensitive K2P channels. Neuron. 2014;84:1198–1212. - PMC - PubMed

Publication types

MeSH terms