. 2017 Jun 27;15(6):e2001333.
doi: 10.1371/journal.pbio.2001333. eCollection 2017 Jun.

Environmental change drives accelerated adaptation through stimulated copy number variation

Affiliations

Environmental change drives accelerated adaptation through stimulated copy number variation

Ryan M Hull et al. PLoS Biol. .

Abstract

Copy number variation (CNV) is rife in eukaryotic genomes and has been implicated in many human disorders, particularly cancer, in which CNV promotes both tumorigenesis and chemotherapy resistance. CNVs are considered random mutations but often arise through replication defects; transcription can interfere with replication fork progression and stability, leading to increased mutation rates at highly transcribed loci. Here we investigate whether inducible promoters can stimulate CNV to yield reproducible, environment-specific genetic changes. We propose a general mechanism for environmentally-stimulated CNV and validate this mechanism for the emergence of copper resistance in budding yeast. By analysing a large cohort of individual cells, we directly demonstrate that CNV of the copper-resistance gene CUP1 is stimulated by environmental copper. CNV stimulation accelerates the formation of novel alleles conferring enhanced copper resistance, such that copper exposure actively drives adaptation to copper-rich environments. Furthermore, quantification of CNV in individual cells reveals remarkable allele selectivity in the rate at which specific environments stimulate CNV. We define the key mechanistic elements underlying this selectivity, demonstrating that CNV is regulated by both promoter activity and acetylation of histone H3 lysine 56 (H3K56ac) and that H3K56ac is required for CUP1 CNV and efficient copper adaptation. Stimulated CNV is not limited to high-copy CUP1 repeat arrays, as we find that H3K56ac also regulates CNV in 3 copy arrays of CUP1 or SFA1 genes. The impact of transcription on DNA damage is well understood, but our research reveals that this apparently problematic association forms a pathway by which mutations can be directed to particular loci in particular environments and furthermore that this mutagenic process can be regulated through histone acetylation. Stimulated CNV therefore represents an unanticipated and remarkably controllable pathway facilitating organismal adaptation to new environments.


Conflict of interest statement

I have read the journal's policy and the authors of this manuscript have the following competing interests: in addition to the funding described in the Financial Disclosure, JH declares that part of this work (although not the presented data), specifically the potential of histone acetyltransferase inhibition to prevent adaptation, forms part of a patent application.

Figures

Fig 1
Fig 1. Systems for stimulated copy number variation (CNV) at the ribosomal DNA (rDNA) and at a model gene.
a: Minimal elements implicated in control of rDNA recombination: transcription from bidirectional promoter E-pro and replication fork stalling at the Fob1-induced replication fork barrier (RFB). Green arrows represent noncoding RNAs IGS1-R and IGS1-F transcribed from the E-pro promoter; blue arrows show the rRNA genes (not to scale). b: Schematic representation of a general system in which a bidirectional promoter is adjacent to a replication fork stalling (RFS) site. Activation of the bidirectional promoter leads to transcription of the ORF (red arrow) and a noncoding RNA (green arrow). This system should, by analogy to the rDNA, be subject to stimulated CNV when the promoter for the indicated ORF is induced. Stalling of replication forks leads to an accumulation of S139-phosphorylated histone H2A (γH2A) (indicated by orange peaks) that can be detected by chromatin immunoprecipitation (ChIP).
Fig 2
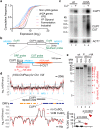
Fig 2. Candidate genes for stimulated copy number variation (CNV).
a: Cumulative frequency distribution of gene expression for S. cerevisiae growing in various environments. Non-γH2A genes from all data sets are shown in grey, and γH2A genes are shown in blue for cells grown in YPD and in orange, red, and purple for other conditions (p = 0.00011, comparing γH2A genes in YPD to other conditions by nested ANOVA). b: Schematic of CUP1 repeats and surrounding region of Chr. VIII, showing 2 copies of CUP1 as annotated in the reference genome sequence (though the BY4741 wild-type [wt] used here actually has 13 copies). Close-up of a single CUP1 copy is also shown. Probes used for northern and Southern blots are indicated in green, along with EcoRI sites used for Southern analysis. The nearest flanking replication origins (autonomously replicating sequences or ARS elements) are drawn in blue; each CUP1 repeat also contains a putative ARS overlapping the CUP1 promoter. The site of the γH2A peak in d is represented in orange. Arrows indicate transcription of CUP1 mRNA and cryptic unstable transcript (CUT) from the CUP1 promoter; the CUP1 ORF is shown in white, and the region replaced by PGAL1-HA in the galactose-inducible construct is highlighted in red. c: Northern analysis of CUP1 mRNA and CUP1 upstream CUT in wild-type and rrp6Δ cells grown in YPD and exposed to 1 mM CuSO4 for 4 hours; ACT1 is a loading control. d: ChIPseq data for γH2A in wild-type cells grown with or without 1 mM CuSO4, showing Chr. VIII and a close-up of the region surrounding the CUP1 genes. The dotted blue line shows the cut off for peak calling, while blue vertical marks represent the annotated replication origins across the chromosome. e: Cells with CUP1 ORF and promoter in each CUP1 copy replaced by PGAL1-HA, grown in glucose or galactose for 10 generations compared to wild-type cells. DNA analysis by Southern blot; arrows indicate de novo alleles formed by CNV events, with numbers indicating PGAL-HA copy number. Copy numbers of parental alleles are 13 and 17 copies in the wild-type and the PGAL-HA strains, respectively. Quantification shows the percentage of alleles deviating from the parental copy number, n = 3; p-values calculated by 1-way ANOVA. ns, not significant. Raw quantitation data is available in S1, S3 and S5 Data.
Fig 3
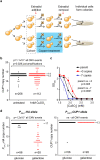
Fig 3. Stimulated copy number variation (CNV) in copper-treated cells.
a: Strategy for quantifying stimulated CNV. Schematic of experimental system for measuring CNV in a defined cohort of mother enrichment program (MEP) cells. b: Copy number of CUP1 alleles in colonies derived from 184 diploid MEP cells (pooled from 2 experiments), treated with or without 1 mM CuSO4 for 24 hours (128 cells for–Cu, 56 cells for +Cu). 89% of starting cohort were recovered in the untreated cohort, and 40% were recovered in the treated cohort. Observed mutation rates in the untreated cohort were normalised for the viability in the treated cohort, making the conservative assumption that cells lost during the experiment did not undergo CNV. p-values were calculated by a goodness of fit χ2 test with 1 degree of freedom between the observed and expected number of mutations to wild-type alleles across the cohorts. c: Copper resistance of 3 colonies recovered in b with parental, +3, and –7 CUP1 copy numbers on 1 allele; CuSO4 was added at indicated concentrations to media containing 0.5 mM ascorbic acid to increase copper toxicity, and OD660 was measured after 3 days at 30°C. Error bars represent ±1 SD; p-values were calculated by 1-way ANOVA of area under curves; n = 6 for each group. d: Experiment as in b using heterozygous diploid cells with 1 wild-type CUP1 allele and 1 PGAL1-HA allele; data are shown for both alleles in the same cells. Allele-specific probes covering the CUP1 promoter and ORF or the GAL1 promoter and HA ORF were used for this experiment. Copy numbers of parental alleles are indicated on each panel. ns, not significant. Raw quantitation data are available in S6 Data.
Fig 4
Fig 4. H3K56 acetylation has a critical role in stimulated copy number variation (CNV).
a: Southern analysis of CUP1 copy number in wild-type (wt) and rtt109Δ cells with 13 CUP1 copies grown for 10 generations with or without 5 mM nicotinamide (NIC). Quantification shows the percentage of alleles deviating from the parental copy number after 10 generations; n = 5, p-values calculated by 1-way ANOVA. b: Measurement of CNV in a defined cohort of MEP rtt109Δ cells, performed exactly as Fig 3b; 48 diploid cells per condition. ns, not significant. c: Northern analysis of CUP1 ORF and CUP1 cryptic unstable transcript (CUT) RNA in log-phase wild-type and rtt109Δ cells with or without 5 mM nicotinamide. Quantification shows relative RNA levels in arbitrary units (AUs); n = 4, p-values calculated by 1-way ANOVA. d: Southern analysis of mrc1Δ and pol32Δ cells as in a, n = 4. Copy numbers of parental alleles are indicated on each panel. Note that in d, the mutants are derived from the wild type and therefore have a parental copy number of ~13, even though this allele is no longer detectable in the pol32Δ mutant. Raw quantitation data are available in S3, S4 and S6 Data.
Fig 5
Fig 5. Combinatorial action of promoter activity and histone H3 lysine 56 acetylation (H3K56ac) on copy number variation (CNV).
a: Southern analysis of copy number for PGAL1-HA cells grown for 10 generations in glucose (GLU) and galactose (GAL) with or without 5 mM nicotinamide (NIC). Quantification shows the percentage of alleles deviating from the parental copy number after 10 generations; n = 3, p-values calculated by 1-way ANOVA. * nonspecific band. ns, not significant. b: Southern analysis as in a using given concentrations of galactose and glucose combined with 2% raffinose. n = 5. * nonspecific band. p-values were calculated from pairwise comparisons of samples with or without NIC for each GLU or GAL concentration deriving from a 1-way ANOVA of the whole data set. See also alternative analysis in S5 Fig. c: Southern analysis as in a using wild-type or rtt109Δ derivatives of PGAL1-HA cells. n = 3. Copy numbers of parental alleles are indicated on each panel. Raw quantitation data are available in S3 Data.
Fig 6
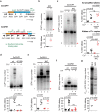
Fig 6. Stimulated copy number variation (CNV) in low-copy repeat systems.
a: Schematics of the 3xCUP1 and 3xSFA1 constructs inserted at the endogenous CUP1 locus. Blue boxes indicate CUP1 repeats, red boxes indicate SFA1 repeats, and orange boxes indicate the ADE2 marker. The reading frame of RSC30 is maintained across the construct boundary. Restriction enzymes for Southern analysis are shown in green along with probe locations. b: Southern analysis of CUP1 copy number in 3xCUP1 cells grown for 10 generations with or without 5 mM nicotinamide (NIC); arrow indicates –1 copy band. Quantification shows the percentage of –1 alleles; n = 4, p-value calculated by t test. c: Southern analysis of CUP1 copy number in 3xCUP1 cells grown for 10 generations with or without 0.3 mM CuSO4 and with or without 5 mM NIC. Upper quantification shows the percentage of alleles deviating from the parental copy number; n = 5, p-values calculated by 1-way ANOVA for repeated measurements. Lower quantification is as upper quantification, considering only alleles of 7+ copies. ns, not significant. d: Southern analysis of CUP1 copy number in 3xCUP1 wild-type (wt) and rtt109Δ cells after 10 generations with or without 0.3 mM CuSO4 (analysis as in c); n = 6. e: Southern analysis of SFA1 copy number in 3xSFA1 grown for 17 generations with or without ~1 mM formaldehyde (FA) and with or without 5 mM NIC. Quantification shows the percentage of alleles deviating from the parental copy number; n = 6, p-values calculated by 1-way ANOVA. A correction was applied to the quantification to account for the differing number of probe-binding sites in the amplified alleles. f: Southern analysis of SFA1 copy number in 3xSFA1 wild-type and rtt109Δ cells grown for 17 generations with or without ~1 mM FA. Quantification as in e; n = 10 for untreated samples, n = 16 for FA-treated samples. g: Southern analysis of CNV induced in the high-copy PGAL1-GFP-SFA1 system. After selection for high copy number and outgrowth in SC media without FA, cells were grown for 10 generations in SC with 2% glucose (GLU) or galactose (GAL). Quantification shows the percentage of contracted alleles; n = 4, p-value calculated by paired t test. Raw quantitation data are available in S3 Data.
Fig 7
Fig 7. Copper adaptation through stimulated copy number variation (CNV).
a: Copper resistance of 3xCUP1 wild-type (wt) and rtt109Δ cells grown with or without 0.3 mM CuSO4 from Fig 6d. Cells were diluted in media with varying concentrations of CuSO4 and grown for 3 days. Average OD660 is plotted, error bars represent ±1 SD, and n = 6 cultures per condition, each tested at 8 CuSO4 concentrations. p-values were calculated by 1-way ANOVA of area-under-curve values for each culture. b: Copper resistance of 3xCUP1 cells grown with or without 5 mM nicotinamide (NIC) and with or without 0.3 mM CuSO4 from Fig 6c. Analysis as in a; n = 12. c: Maximum growth rate in 0 mM or 0.75 mM CuSO4 of 3xCUP1 cells pretreated with or without 5 mM nicotinamide for 10 generations. dOD660/dt represents the OD change per hour. Four samples each grown with or without nicotinamide were each inoculated in 6 cultures for growth curve determination across 72 hours. Data are the maximum of the first derivative of smoothed OD660 time-course data (see S7c Fig) for each culture. d: Competitive growth assay in 0 or 0.3 mM CuSO4. Two populations of 3xCUP1 cells with different selectable markers were pregrown with or without 5 mM nicotinamide, then mixed and outgrown for 10 generations in direct competition. The graph shows the change in composition of outgrowth cultures across the competition period between inoculation and saturation (10 generations). p-value was calculated by paired t test, n = 6. Raw quantitation data are available in S7 and S8 Data.
Fig 8
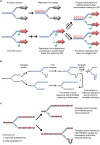
Fig 8. A scheme for stimulated copy number variation (CNV).
a: Proposed mechanism by which promoter activity and acetylated histone H3 lysine 56 (H3K56ac) contribute to stimulated CNV. DNA strands are shown in blue, the inactive CUP1 gene is shown in black, and the induced CUP1 gene is shown in red, with antisense CUT in green. Pink block arrows represent progression of the replication fork. b: Proposed mechanism for CNV asymmetry. DNA strands from repeated DNA are shown in blue, unique sequences are shown in red, and vertical lines indicate repeat boundaries. Numbers indicate the change in copy number for a particular template switch. The result of 2 successive template-switching events with an intervening period of replication are shown, resulting in a 3:1 ratio of contractions to amplifications. c: Additional asymmetry is generated by H3K56ac: nucleosomes around a replication fork (blue) are shown as red circles, either empty or shaded to represent the H3K56ac state. Template switching forward is seen to move the fork to a region of low H3K56ac, whereas template switching backwards moves the fork to a region of high H3K56ac and therefore low fork stability. BIR, break-induced replication.

Similar articles

Cited by

References

    1. Zarrei M, MacDonald JR, Merico D, Scherer SW. A copy number variation map of the human genome. Nat Rev Genet. 2015;16(3):172–83. doi: 10.1038/nrg3871 . - DOI - PubMed
    1. Sebat J, Lakshmi B, Troge J, Alexander J, Young J, Lundin P, et al. Large-scale copy number polymorphism in the human genome. Science. 2004;305(5683):525–8. doi: 10.1126/science.1098918 . - DOI - PubMed
    1. Iafrate AJ, Feuk L, Rivera MN, Listewnik ML, Donahoe PK, Qi Y, et al. Detection of large-scale variation in the human genome. Nat Genet. 2004;36(9):949–51. doi: 10.1038/ng1416 . - DOI - PubMed
    1. Craddock N, Hurles ME, Cardin N, Pearson RD, Plagnol V, Robson S, et al. Genome-wide association study of CNVs in 16,000 cases of eight common diseases and 3,000 shared controls. Nature. 2010;464(7289):713–20. doi: 10.1038/nature08979 ; - DOI - PMC - PubMed
    1. Stankiewicz P, Lupski JR. Structural variation in the human genome and its role in disease. Annual review of medicine. 2010;61:437–55. doi: 10.1146/annurev-med-100708-204735 . - DOI - PubMed

MeSH terms