

The mutant p53-ID4 complex controls VEGFA isoforms by recruiting lncRNA MALAT1
- PMID: 28652379
- PMCID: PMC5538427
- DOI: 10.15252/embr.201643370
The mutant p53-ID4 complex controls VEGFA isoforms by recruiting lncRNA MALAT1
Abstract
The abundant, nuclear-retained, metastasis-associated lung adenocarcinoma transcript 1 (MALAT1) has been associated with a poorly differentiated and aggressive phenotype of mammary carcinomas. This long non-coding RNA (lncRNA) localizes to nuclear speckles, where it interacts with a subset of splicing factors and modulates their activity. In this study, we demonstrate that oncogenic splicing factor SRSF1 bridges MALAT1 to mutant p53 and ID4 proteins in breast cancer cells. Mutant p53 and ID4 delocalize MALAT1 from nuclear speckles and favor its association with chromatin. This enables aberrant recruitment of MALAT1 on VEGFA pre-mRNA and modulation of VEGFA isoforms expression. Interestingly, VEGFA-dependent expression signatures associate with ID4 expression specifically in basal-like breast cancers carrying TP53 mutations. Our results highlight a key role for MALAT1 in control of VEGFA isoforms expression in breast cancer cells expressing gain-of-function mutant p53 and ID4 proteins.
Keywords: ID4; MALAT1; SRSF1; VEGFA; mutant p53.
© 2017 The Authors.
Conflict of interest statement
The authors declare that they have no conflict of interest.
Figures
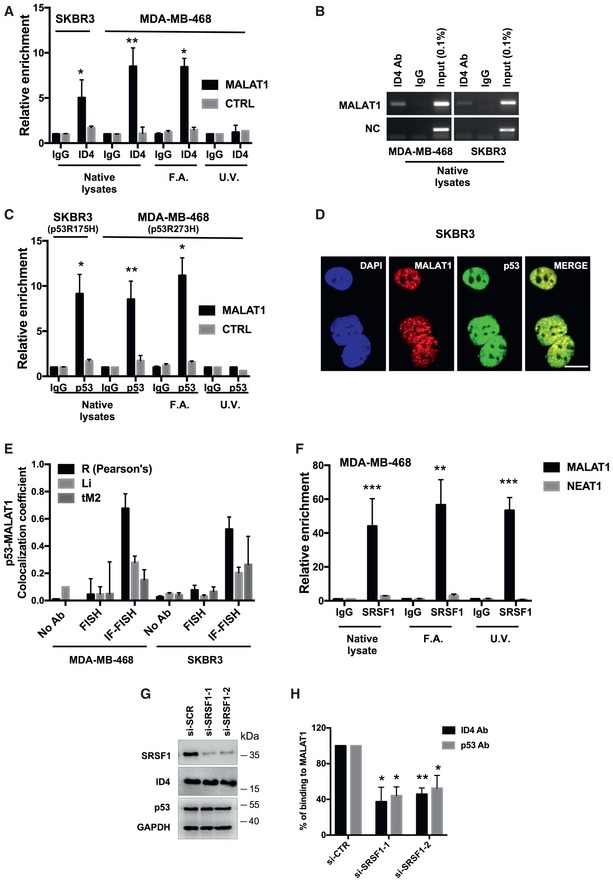
- A–C
RIP (Ribonucleoprotein ImmunoPrecipitation) assays performed in SKBR3 and MDA‐MB‐468 breast cancer cells using antibodies directed to ID4 or p53. IgG was used as negative control. Native lysates or lysates from cells crosslinked with formaldehyde (F.A.) or UV light were employed. RT–qPCR of MALAT1 RNA and control mRNAs (GAPDH, RPL19) is shown. Relative enrichment represents enrichment of each transcript in ID4‐IP or p53‐IP over control IgG‐IP sample.
- D
Fluorescence high‐resolution images of fixed cells, labeled with DAPI (cell nuclei), Alexa Fluor 488 (p53 protein), and Quasar 570 (MALAT1 RNA). Merged images of Alexa Fluor 488 and Quasar 570 signals are shown. Scale bars, 10 μm.
- E
Pearson's correlation coefficient R, Manders correlation coefficient M2 (tM2), and Li intensity correlation quotient ICQ (Li) were considered to estimate colocalization between p53 protein and MALAT1 RNA from combined immunofluorescence–RNA FISH assays in the indicated cell lines.
- F
RIP assays performed in MDA‐MB‐468 cells using an antibody directed to SRSF1 (A96, Santa Cruz). MALAT1 and NEAT1 (negative control) RNA abundance was evaluated by RT–qPCR.
- G, H
RIP assays of ID4 and p53 performed in MDA‐MB‐468 cells depleted or not of SRSF1 expression using two siRNAs. SRSF1, ID4, p53 proteins, and MALAT1 RNA levels following siRNA transfection are shown in (G).
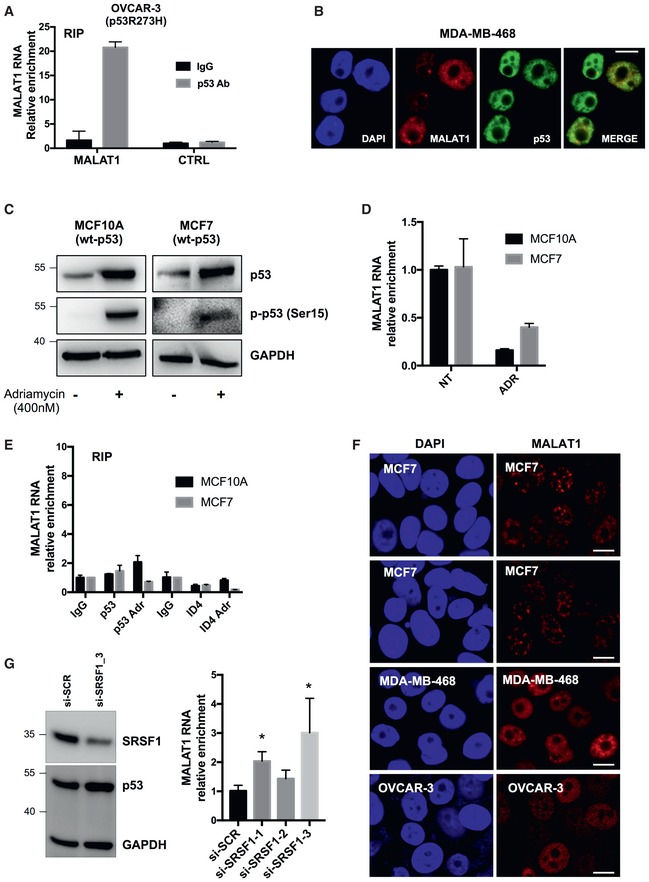
RIP assays performed in OVCAR‐3 cells using an antibody directed to p53. Relative enrichment is calculated as folds over IgG sample, normalized on RPL19 mRNA level. Data are presented as mean ± SEM. Results from three biological replicates are shown.
Fluorescence high‐resolution images of fixed cells, labeled with DAPI (cell nuclei), Alexa Fluor 488 (p53 protein), and Quasar 570 (MALAT1 RNA). Merged images of Alexa Fluor 488 and Quasar 570 signals are shown. Scale bars, 10 μm.
Western blot analysis of wt‐p53 and its phosphorylated form p‐p53‐Ser15 in the indicated cell lines with or without 8 h treatment with 400 nM adriamycin.
RT–qPCR analysis of MALAT1 RNA level in MCF10A and MCF7 cells treated or not with adriamycin (ADR) as in (A). Data are presented as mean ± SEM. Results from three biological replicates are shown.
RIP assays performed in MCF10A and MCF7 cells treated or not with adriamycin as in (A) were performed using antibodies directed to p53 and ID4 proteins. Relative enrichment is calculated as folds over IgG sample, normalized on RPL19 mRNA level. Data are presented as mean ± SEM. Results from three biological replicates are shown.
Fluorescence high‐resolution images of the indicated fixed cell lines, labeled with DAPI (cell nuclei) and Quasar 570 (MALAT1 RNA). Scale bars, 10 μm.
MALAT1 RNA abundance was evaluated by RT–qPCR in MDA‐MB‐468 cells depleted of SRSF1 using three different si‐RNAs and normalized over GAPDH mRNA. Data are presented as mean ± SEM. Results from three biological replicates are shown. *P ≤ 0.05 (two‐tailed Student's t‐test). Western blot on the left shows SRSF1 protein levels after si‐SRSF1‐3 transfection, while SRSF1‐1 and SRSF1‐2 are shown in Fig 1G.
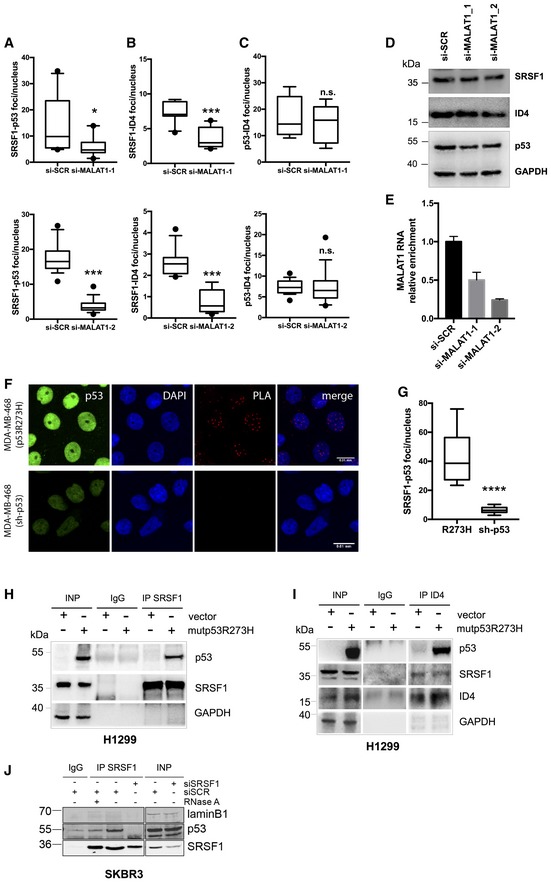
- A–C
Proximity ligation assays (PLAs) of SRSF1‐mutant p53 (A), SRSF1‐ID4 (B), and mutant p53‐ID4 (C) interactions in MDA‐MB‐468 cells depleted (si‐MALAT1) or not (si‐SCR) of MALAT1 RNA expression using two different siRNAs. Box plots represent the number of interactions detected per nucleus.
- D, E
Western blot (D) and RT–qPCR (E) analysis of MDA‐MB‐468 cells depleted of MALAT1 RNA expression using two different siRNAs.
- F, G
PLA of SRSF1‐p53 interaction in parental MDA‐MB‐468 cells (indicated as R273H) as well as in cells stably depleted of endogenous mutant p53R273H expression (indicated as sh‐p53). Immunofluorescence (F) represents p53 staining, DAPI (cell nuclei), PLA signals (SRSF1‐p53 interactions), and merged signals DAPI/PLA. Box plot (G) represents the number of SRSF1‐p53 interactions detected per nucleus. Scale bars, 0.01 mm.
- H, I
H1299 cells transfected with mutant p53R273H vector or an empty vector as control were used to evaluate SRSF1‐p53 interaction (H) by immunoprecipitation of SRSF1 (and IgG as control) followed by Western blot of p53, ID4‐p53R273H (I), and ID4‐SRSF1 (I) interactions by immunoprecipitation of ID4 followed by Western blot of p53 and SRSF1, respectively.
- J
SRSF1‐p53 interaction evaluated in SKBR3 cell lysate, treated or not with RNase A, by immunoprecipitation of SRSF1 (and IgG as control) followed by Western blot of p53.
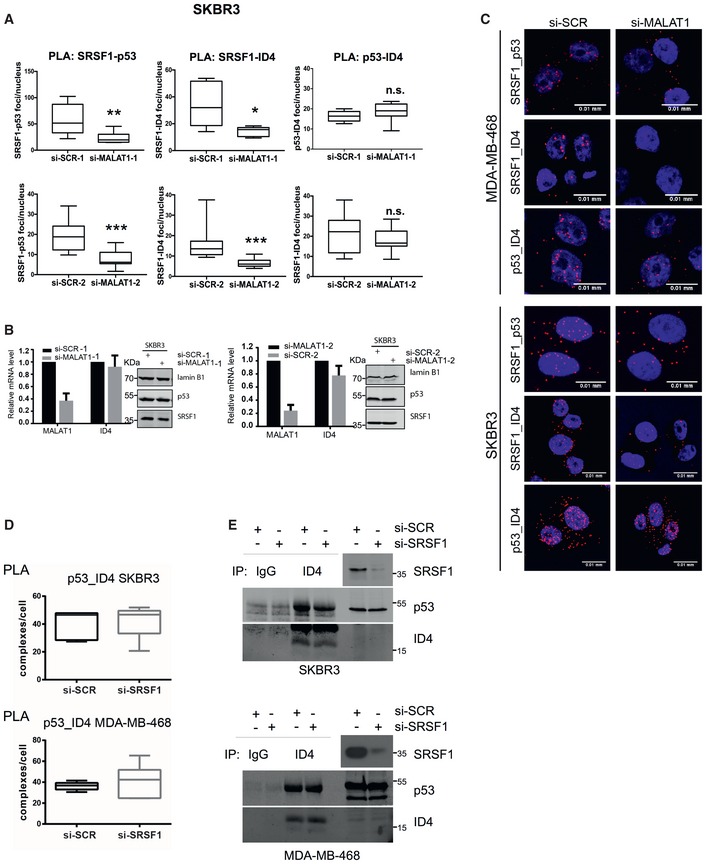
- A, B
PLA assays showing interactions SRSF1‐p53, SRSF1‐ID4, and p53‐ID4 in SKBR3 cells depleted or not of MALAT1 RNA expression using two different siRNAs (A). MALAT1 and ID4 level after MALAT1 interference was evaluated by RT–qPCR (B, graphs); p53 and SRSF1 protein level after MALAT1 interference was evaluated by Western blot (B, panels). In (A) the horizontal line represents the median, the box represents the inter‐quartile range and 10–90th percentile interval is shown in whiskers. *P ≤ 0.05, **P ≤ 0.01, ***P ≤ 0.001 (two‐tailed Student's t‐test). Data in (B) are presented as mean ± SEM. Results from three biological replicates are shown.
- C
Representative images of PLA experiments are shown in Figs 2C–E and EV2A. Merged signals of DAPI and PLA are shown in the indicated cells. Scale bars, 0.01 mm.
- D
PLA assays to evaluate the interaction between p53 and ID4 proteins, performed in the indicated control and SRSF1‐depleted cell lines. Results from three biological replicates are shown. The horizontal line represents the median, the box represents the inter‐quartile range and 10–90th percentile interval is shown in whiskers.
- E
Interaction between p53 and ID4 proteins was evaluated by immunoprecipitation of ID4 followed by Western blot of p53 in the indicated cells, depleted or not of SRSF1 expression.
- A, B
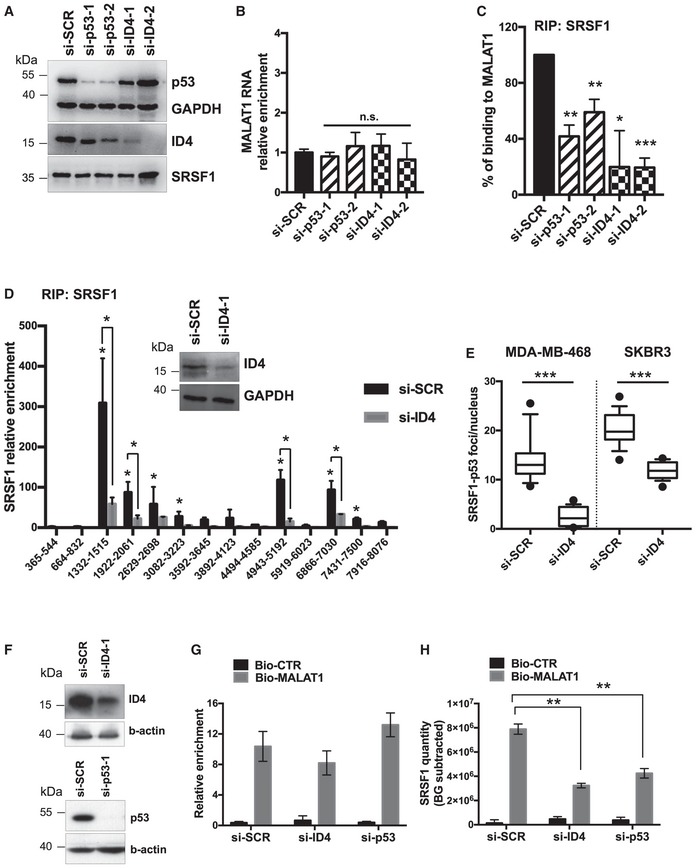
p53, ID4, SRSF1 proteins, and MALAT1 RNA levels evaluated by Western blot (A) and RT–qPCR (B) analyses in MDA‐MB‐468 cells depleted or not of p53R273H or ID4 expression using two different siRNAs for each factor.
- C
RIP assays performed in MDA‐MB‐468 cells, depleted or not of ID4 or mutant p53R273H expression, using an antibody directed to SRSF1 (A96, Santa Cruz). MALAT1 RNA abundance was evaluated by RT–qPCR and normalized over GAPDH mRNA.
- D
RIP assay performed in control and ID4‐depleted MDA‐MB‐468 cells crosslinked with formaldehyde using an antibody directed to SRSF1 (A96, Santa Cruz). Recruitment of SRSF1 along MALAT1 RNA was evaluated by using 14 couples of primers covering the whole MALAT1 RNA. Numbers indicate the nucleotide positions on MALAT1 RNA of the couples of primers used.
- E
PLA assay showing the number of interactions between SRFS1 and p53 protein per nucleus, in control and ID4‐depleted cells. The horizontal line represents the median, the box represents the inter‐quartile range and 10–90th percentile interval is shown in whiskers. The black circles represent outliers.
- F
Western blot showing ID4 and mutant p53 protein levels in MDA‐MB‐468 cells transfected with the indicated siRNAs and used for ChIRP assays.
- G, H
ChIRP assay showing the recovery of MALAT1 RNA (G) and its associated SRSF1 protein amount (H) by using a set of biotinylated oligonucleotides complementary to MALAT1 RNA sequence (Bio‐MALAT1), or a set of control oligonucleotides (Bio‐CTR), in lysates from control (si‐SCR), ID4‐depleted (si‐ID4), and mutant p53‐depleted (si‐p53) MDA‐MB‐468 cells. Enrichment for MALAT1 RNA was evaluated by RT–qPCR and normalized over GAPDH mRNA (G). Enrichment for SRSF1 protein was evaluated by dot‐blot analysis (H). Quantification was performed by densitometry on a UVITEC instrument, subtracting background signal, and is presented as folds of Bio‐MALAT1 signal over Bio‐CTR signal in si‐SCR sample.
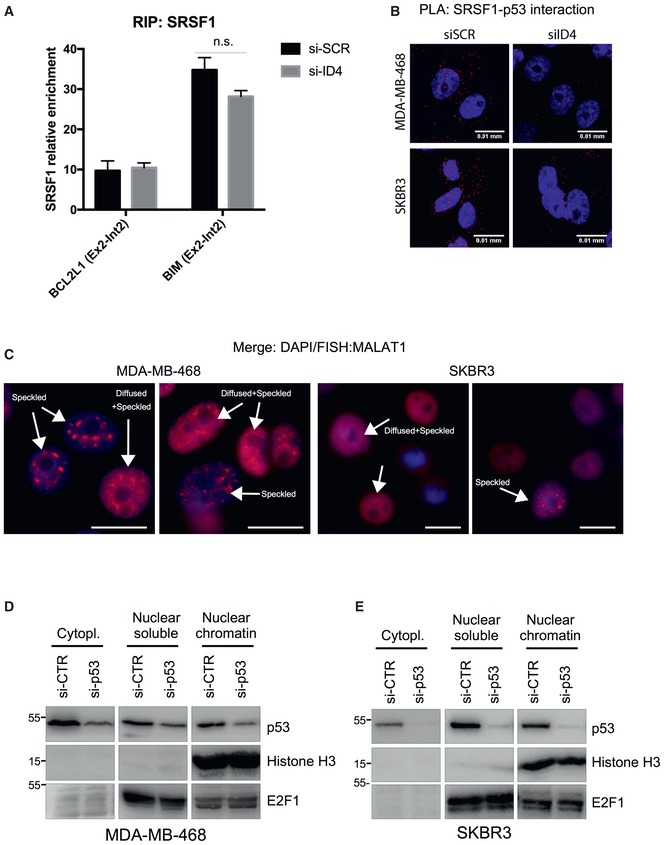
- A
RIP assay performed in control and ID4‐depleted MDA‐MB‐468 cells crosslinked with formaldehyde using an antibody directed to SRSF1 (A96, Santa Cruz). Results from three biological replicates are shown. Data are presented as mean ± SEM. Enrichment of SRSF1 protein on BCL2L1 and BIM pre‐mRNAs was evaluated using primers encompassing the junction between exon 2 and intron 2.
- B
Representative images of PLA assays are shown in Fig 3E analyzing the interaction between SRSF1 and mutant p53. Merged signals of DAPI and PLA are shown in the indicated cell lines. Scale bars, 0.01 mm.
- C
Representative images of MALAT1 staining obtained in RNA FISH analysis using fluorescence microscopy showing the presence of cells with “classical” speckled localization and cells showing a diffused staining in addition to the speckled localization of MALAT1. Scale bars, 10 μm.
- D, E
Western blot analysis of cell extracts derived by fractionation of lysates from MDA‐MB‐468 and SKBR3 cells, to obtain cytoplasmic, nuclear‐soluble, and chromatin‐associated nuclear fractions, performed using the indicated antibodies.
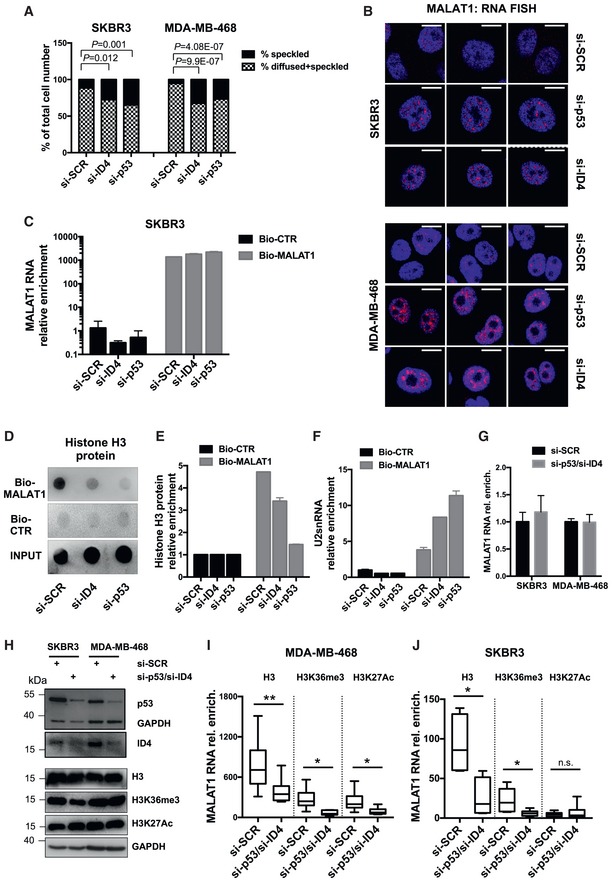
- A
RNA FISH was performed in control (si‐SCR), mutant p53‐depleted (si‐p53), and ID4‐depleted (si‐ID4) SKBR3 and MDA‐MB‐468 cells using Stellaris™ fluorescent RNA probes (Biosearch Technologies, Inc.), spanning the whole MALAT1 lncRNA, and visualized at fluorescence microscope. Nuclei presenting speckled or diffused+speckled MALAT1 signal were counted, and the results are presented in graph (A). Differences in the intranuclear distribution of MALAT1 were evaluated by a two‐tailed Student's t‐test.
- B
Images of cells presenting speckled localization of MALAT1 by RNA FISH analysis, as visualized by confocal microcopy. Merges of MALAT1 and DAPI signals are presented. Scale bars, 10 μm.
- C–F
ChIRP assay showing the recovery of MALAT1 RNA (C) and its associated histone H3 protein (D,E) by using a set of biotinylated oligonucleotides complementary to MALAT1 RNA sequence (Bio‐MALAT1), or a set of control oligonucleotides (Bio‐CTR), in lysates from control (si‐SCR), ID4‐depleted (si‐ID4), and mutant p53‐depleted (si‐p53) SKBR3 cells. Enrichment for MALAT1 RNA was evaluated by RT–qPCR and normalized over GAPDH mRNA (C). Enrichment for histone H3 protein was evaluated by dot‐blot analysis (D, E). Quantification was performed by densitometry on a UVITEC instrument, subtracting background signal, and is presented as folds of Bio‐MALAT1 signals over Bio‐CTR signals (E). Binding of U2 snRNA to MALAT1 in ChIRP was evaluated by RT–qPCR analysis; U2 snRNA relative enrichment was obtained by normalization over 18S rRNA (F).
- G–J
RIP assay was performed in the indicated cell lines, depleted or not of mutant p53 and ID4 expression (panels G, H), after crosslinking with formaldehyde, using antibodies directed to histone H3 and its modified forms H3K36me3 and H3K27Ac and IgG as negative control (I, J). Binding to MALAT1 RNA was evaluated by RT–qPCR using six couples of primers spanning MALAT1 sequence. Box plots represent the distribution of the enrichment values of the six considered regions. Enrichment for each region is calculated as fold over the IgG negative control and is normalized over RPL19 mRNA enrichment. The horizontal line represents the median, the box represents the inter‐quartile range and 10–90th percentile interval is shown in whiskers.

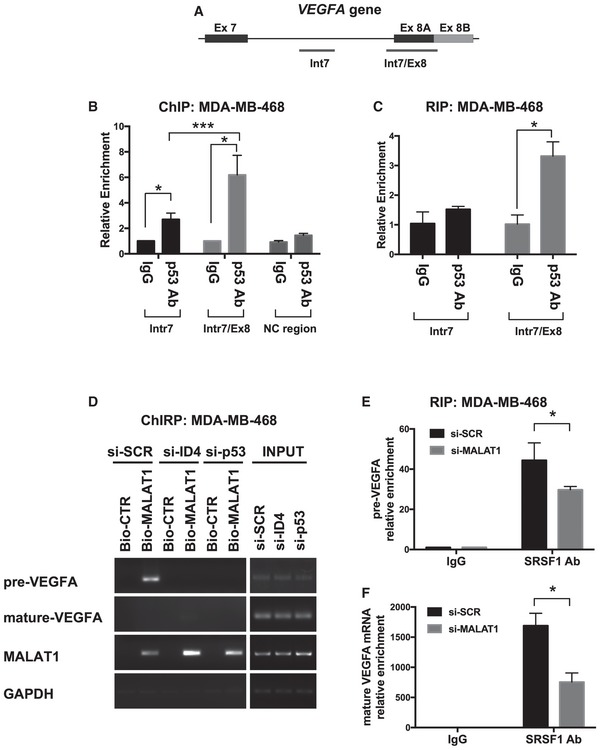
Schematic representation of the genomic organization of VEGFA gene exons 5‐8 and of the mRNAs obtained by their alternative splicing.
RT–qPCR analysis of transcripts encoding pro‐angiogenic (VEGFA165, VEGFA121) and anti‐angiogenic (VEGFA165b, VEGFA121b) VEGFA isoforms in MDA‐MB‐468 cells after interference of mutant p53, ID4, SRSF1, MALAT1, or hnRNP A1. Ratios of anti‐ versus pro‐angiogenic isoforms are shown.
Western blot analysis of total VEGFA and anti‐angiogenic VEGFA165b proteins. Ratios of VEGFA165b in MDA‐MB‐468 and SKBR3 cells depleted of p53, ID4, SRSF1, or MALAT1 over si‐SCR sample normalized to total VEGFA are shown.
A representative Western blot experiment of MDA‐MB‐468 cells. Numbers indicate ratio between VEGFA165b protein densitometry values in interfered cells (si‐p53, si‐ID4, si‐SRSF1, si‐MALAT1) over si‐SCR sample normalized to total VEGFA protein levels.
Ratio of the expression levels evaluated by RT–qPCR of isoform VEGFA121 over VEGFA165 in MDA‐MB‐468 cells after interference of mutant p53, ID4, SRSF1, MALAT1, or hnRNP A1.
Ratio of the expression levels of isoform VEGFA121 over VEGFA165 obtained by analysis of RNA‐seq data from breast cancer samples (TCGA study). The horizontal line represents the median, the box represents the inter‐quartile range and 10–90th percentile interval is shown in whiskers. P‐value was calculated by Wilcoxon signed‐rank test.
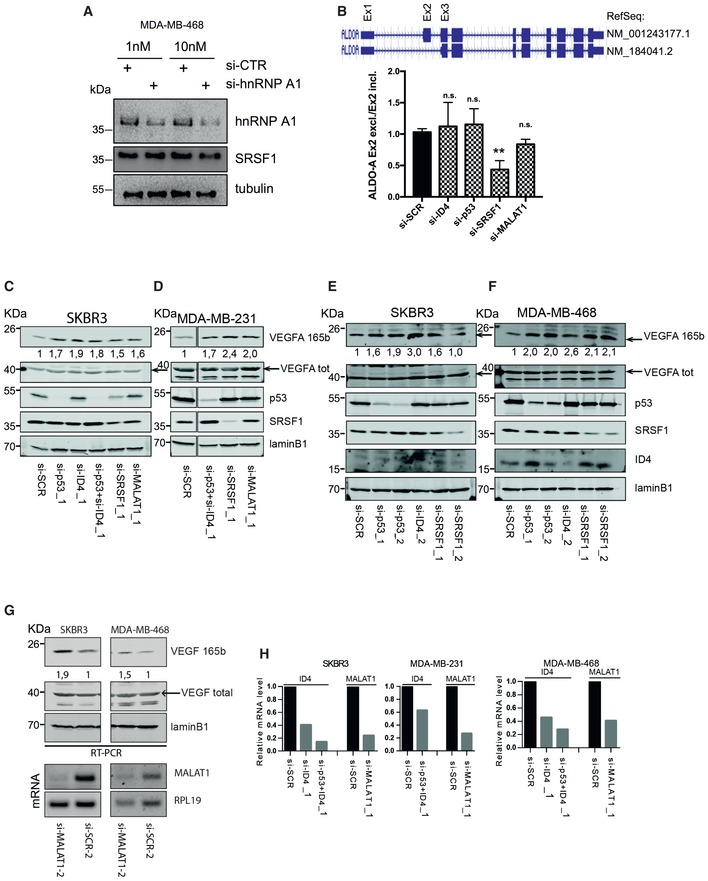
- A
Western blot analysis of MDA‐MB‐468 cells interfered or not for hnRNP A1 expression using two different concentrations of siRNAs.
- B
RT–qPCR analysis of two isoforms of aldolase A mRNA (ALDOA) differing for the inclusion/exclusion of exon 2. Ratio of exon 2 excluding isoform versus exon 2 including isoform is presented. Results from three biological replicates are shown. Data are presented as mean ± SEM. **P ≤ 0.005 (two‐tailed Student's t‐test).
- C–H
Representative Western blot experiments of SKBR3 (C, E, G), MDA‐MB‐231 (D), and MDA‐MB‐468 (F, G) cells transfected with the indicated siRNAs to p53, ID4, SRSF1, or MALAT1. Numbers indicate ratio between VEGFA165b protein densitometry values in interfered cells (si‐p53, si‐ID4, si‐SRSF1, si‐MALAT1) over si‐SCR sample normalized to total VEGFA protein levels. MALAT1 and ID4 depletion was assessed by RT–qPCR (H). Different siRNAs were used for each factor.
- A, B
Recruitment of mutant p53R273H protein on VEGFA genomic regions evaluated by chromatin immunoprecipitation (ChIP) in MDA‐MB‐468 cells. qPCR was performed using primers amplifying the regions indicated in panel (A) and a negative control region (NC = intronic region of cyclin B1 gene) previously reported 62.
- C
Recruitment of mutant p53R273H protein on VEGFA precursor RNA evaluated by RIP in MDA‐MB‐468 cells crosslinked with formaldehyde. qPCR was performed using primers amplifying the regions indicated in panel (A).
- D
ChIRP assay was performed to recover MALAT1 lncRNA and its associated RNAs by using a set of biotinylated oligonucleotides complementary to MALAT1 RNA sequence (Bio‐MALAT1), or a set of control oligonucleotides (Bio‐CTR), in lysates from control (si‐SCR), ID4‐depleted (si‐ID4), and mutant p53‐depleted (si‐p53) MDA‐MB‐468 cells. Enrichment for the indicated transcripts was evaluated by RT–PCR. Mature VEGFA mRNA was analyzed using primers recognizing all isoforms (reported in Appendix Table S5).
- E, F
RT–qPCR analysis of VEGFA precursor (E) and mature (F) RNAs performed on RIP experiments from control (si‐SCR) and MALAT1‐depleted (si‐MALAT1) MDA‐MB‐468 cells immunoprecipitated using an antibody directed to SRSF1. Mature VEGFA mRNA was analyzed using primers recognizing all isoforms (reported in Appendix Table S5).
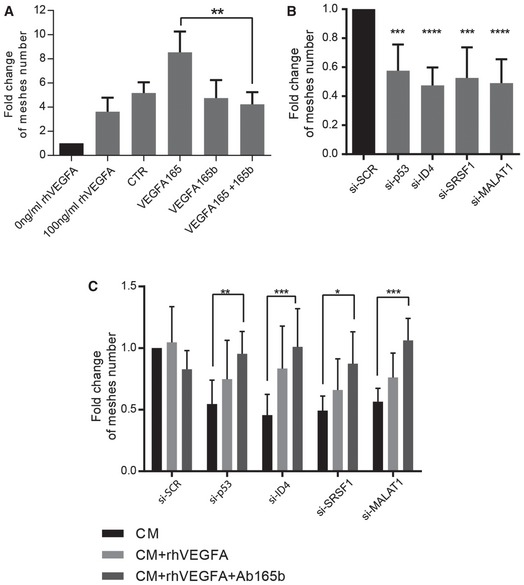
Angiogenic tube formation assays performed by growing EA.hy926 endothelial cells in the presence of serum‐free medium with (100 ng/ml) or without (0 ng/ml) recombinant VEGFA (rhVEGFA), or conditioned medium (CM) from SKBR3 cells transfected with an empty vector (CTR), an expression vector for VEGFA165 (VEGFA165) or an expression vector for VEGFA165b (VEGFA165b). The endothelial cells were also tested with a mixture of CM from VEGFA165‐ and VEGFA165b‐overexpressing SKBR3 cells.
Angiogenic tube formation assays performed by growing EA.hy926 endothelial cells in the presence of CM from SKBR3 cells transfected with control siRNAs (si‐SCR) or si‐RNAs directed to ID4 (si‐ID4), mutant p53 (si‐p53), SRSF1 (si‐SRSF1), or MALAT1 (si‐MALAT1).
Angiogenic tube formation assays performed by growing EA.hy926 endothelial cells in the presence of conditioned medium (CM) from SKBR3 cells interfered as in (A) or plus recombinant VEGFA165 protein (rhVEGFA) alone or in combination with a blocking antibody recognizing VEGFA165b protein (Ab165b).
- A
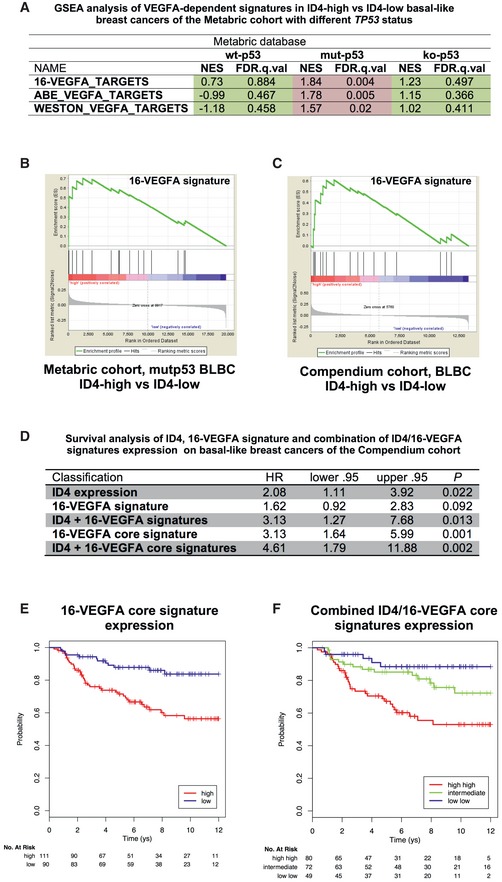
Gene‐set enrichment analysis (GSEA) of VEGFA‐dependent signatures in ID4‐high versus ID4‐low basal‐like breast cancers of the METABRIC cohort with different TP53 status. NES, normalized enrichment score; FDR, false discovery rate.
- B
Enrichment plot obtained through GSEA of the 16‐VEGFA signature in ID4‐high versus ID4‐low basal‐like breast cancer samples with mutated TP53 gene.
- C
Enrichment plot obtained through GSEA of 16‐VEGFA signature in high‐ID4 versus low‐ID4 basal‐like breast cancer samples from the Breast Cancer Compendium Cohort. The black vertical bars indicate the positions of single components of the VEGFA‐activity signature in the samples. The green line shows the cumulative score of the enrichment of the examined 16‐VEGFA signature. A positive enrichment score indicates positive correlation between the 16‐VEGFA signature and ID4 mRNA expression.
- D–F
Survival and Kaplan–Meier analyses performed on 201 basal‐like breast cancer patients from the Breast Cancer Compendium Cohort showing the predictive value on overall survival of the expression level of ID4 mRNA, VEGFA signatures, and their combinations. Tumors were divided into high‐ or low‐ID4 expression categories based on the median of ID4 expression in the series.
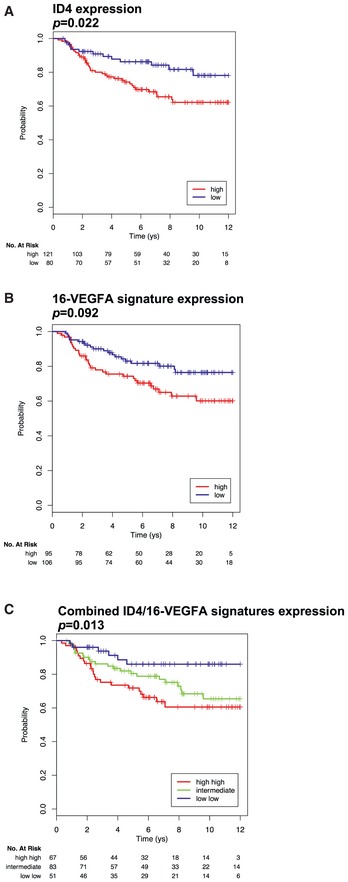
- A–C
Kaplan–Meier analyses representing the correlation between the expression of ID4 mRNA (A), 16‐VEGFA signature (B), or their combination (C), and overall survival in 201 basal‐like breast cancer patients from the Breast Cancer Compendium Cohort. Tumors were divided into high‐ or low‐ID4 expression categories based on the median of ID4 expression in the series.
Comment in
-
Insight into the regulatory mechanism of VEGFA isoforms in p53 mutant breast cancer: can it be substantiated with solely in vitro studies?J Thorac Dis. 2018 Feb;10(2):567-569. doi: 10.21037/jtd.2017.12.144. J Thorac Dis. 2018. PMID: 29607113 Free PMC article. No abstract available.
Similar articles
-
The execution of the transcriptional axis mutant p53, E2F1 and ID4 promotes tumor neo-angiogenesis.Nat Struct Mol Biol. 2009 Oct;16(10):1086-93. doi: 10.1038/nsmb.1669. Epub 2009 Sep 27. Nat Struct Mol Biol. 2009. PMID: 19783986
-
MALAT1-dependent hsa_circ_0076611 regulates translation rate in triple-negative breast cancer.Commun Biol. 2022 Jun 16;5(1):598. doi: 10.1038/s42003-022-03539-x. Commun Biol. 2022. PMID: 35710947 Free PMC article.
-
Expression of ID4 protein in breast cancer cells induces reprogramming of tumour-associated macrophages.Breast Cancer Res. 2018 Jun 19;20(1):59. doi: 10.1186/s13058-018-0990-2. Breast Cancer Res. 2018. PMID: 29921315 Free PMC article.
-
Diagnostic, prognostic, and therapeutic significance of long non-coding RNA MALAT1 in cancer.Biochim Biophys Acta Rev Cancer. 2021 Apr;1875(2):188502. doi: 10.1016/j.bbcan.2021.188502. Epub 2021 Jan 8. Biochim Biophys Acta Rev Cancer. 2021. PMID: 33428963 Review.
-
ID4 controls luminal lineage commitment in normal mammary epithelium and inhibits BRCA1 function in basal-like breast cancer.Endocr Relat Cancer. 2016 Sep;23(9):R381-92. doi: 10.1530/ERC-16-0196. Epub 2016 Jul 13. Endocr Relat Cancer. 2016. PMID: 27412917 Review.
Cited by
-
The nexus of long noncoding RNAs, splicing factors, alternative splicing and their modulations.RNA Biol. 2024 Jan;21(1):1-20. doi: 10.1080/15476286.2023.2286099. Epub 2023 Nov 28. RNA Biol. 2024. PMID: 38017665 Free PMC article. Review.
-
p53 Gain-of-Function Mutation Induces Metastasis via BRD4-Dependent CSF-1 Expression.Cancer Discov. 2023 Dec 12;13(12):2632-2651. doi: 10.1158/2159-8290.CD-23-0601. Cancer Discov. 2023. PMID: 37676642 Free PMC article.
-
Amplifying Tumor-Stroma Communication: An Emerging Oncogenic Function of Mutant p53.Front Oncol. 2021 Jan 11;10:614230. doi: 10.3389/fonc.2020.614230. eCollection 2020. Front Oncol. 2021. PMID: 33505920 Free PMC article. Review.
-
A Driver Never Works Alone-Interplay Networks of Mutant p53, MYC, RAS, and Other Universal Oncogenic Drivers in Human Cancer.Cancers (Basel). 2020 Jun 11;12(6):1532. doi: 10.3390/cancers12061532. Cancers (Basel). 2020. PMID: 32545208 Free PMC article. Review.
-
Regulated secretion of mutant p53 negatively affects T lymphocytes in the tumor microenvironment.Oncogene. 2024 Jan;43(2):92-105. doi: 10.1038/s41388-023-02886-1. Epub 2023 Nov 11. Oncogene. 2024. PMID: 37952080 Free PMC article.
References
-
- Ji P, Diederichs S, Wang W, Boing S, Metzger R, Schneider PM, Tidow N, Brandt B, Buerger H, Bulk E et al (2003) MALAT‐1, a novel noncoding RNA, and thymosin beta4 predict metastasis and survival in early‐stage non‐small cell lung cancer. Oncogene 22: 8031–8041 - PubMed
-
- Gutschner T, Hammerle M, Diederichs S (2013) MALAT1 – a paradigm for long noncoding RNA function in cancer. J Mol Med 91: 791–801 - PubMed
Publication types
MeSH terms
Substances
LinkOut - more resources
Full Text Sources
Other Literature Sources
Medical
Research Materials
Miscellaneous
