. 2017 Aug;18(8):877-888.
doi: 10.1038/ni.3789. Epub 2017 Jun 26.

Lineage specification of human dendritic cells is marked by IRF8 expression in hematopoietic stem cells and multipotent progenitors

Affiliations

Lineage specification of human dendritic cells is marked by IRF8 expression in hematopoietic stem cells and multipotent progenitors

Jaeyop Lee et al. Nat Immunol. 2017 Aug.

Erratum in

Abstract

The origin and specification of human dendritic cells (DCs) have not been investigated at the clonal level. Through the use of clonal assays, combined with statistical computation, to quantify the yield of granulocytes, monocytes, lymphocytes and three subsets of DCs from single human CD34+ progenitor cells, we found that specification to the DC lineage occurred in parallel with specification of hematopoietic stem cells (HSCs) to the myeloid and lymphoid lineages. This started as a lineage bias defined by specific transcriptional programs that correlated with the combinatorial 'dose' of the transcription factors IRF8 and PU.1, which was transmitted to most progeny cells and was reinforced by upregulation of IRF8 expression driven by the hematopoietic cytokine FLT3L during cell division. We propose a model in which specification to the DC lineage is driven by parallel and inheritable transcriptional programs in HSCs and is reinforced over cell division by recursive interactions between transcriptional programs and extrinsic signals.


Figures
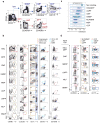
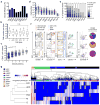
Figure 1
Figure 1. Marker-defined hematopoietic progenitors exhibit hierarchical and convergent potency
(a) Flow cytometry plot showing gating scheme of progenitor populations from a representative sample of seventeen human cord blood units. Starting gate: Lin(CD3/19/56/14/16/66b/1c/303/141)-. BNKP, B/NK progenitor; CMP, common myeloid progenitor; MEP, megaerythrokaryocyte progenitor; GMDP, granulocyte-monocyte-DC progenitor; MDP, monocyte-DC progenitor; CDP, common DC progenitor; HSC, hematopoietic stem cell; MPP, multipotent progenitor; LMPP, lymphoid-primed multi-potent progenitor; MLP, multi-lymphoid progenitor. (b) Flow cytometry plots showing output of granulocytes (brown), monocytes (orange), CD1c+ DCs (blue), CD141+ DCs (red), pDCs (cyan) and B and NK cells (purple) from 100 cells from each indicated population after culturing in MP+FSG condition for 14 days. Shown are live, singlet CD45+ cells and numbers indicate mean % of total CD45+ cells produced from five independent experiments. (c) Concatenated FACS plots showing number of cell divisions (CFSE signal dilution) of indicated populations descended from 1,000 HSCs that were sorted as in a, labeled with CFSE and cultured for 7 days. Populations were gated as shown in d. Plot is representative of four independent experiments. (d) Representative flow cytometry plots showing intermediate output from HSC/MPPs, CMPs, LMPPs, MLPs and BNKPs after culturing 1,000 cells of each population for 7 days. Shown are live, singlet CD45+Lin(CD3/19/56/14/16/1c/303/141)-CD34+ cells. Numbers indicate mean % from total CD34+ cells from four independent experiments.
Figure 2
Figure 2. Clonal potency indicates heterogeneity of marker-pure progenitor populations and developmental distance from HSCs
(a) Bar chart showing clonal efficiency for indicated populations after clonal culture in MP+FSG for 2-3 weeks. Clonal efficiency is defined as percentage of productive clones among total seeded wells for HSC (n=360), MPP (n=408), LMPP (n=791), MLP (n=720), BNKP (n=542), CMP (n=800), GMDP (n=890), MDP (n=357), and CDP (n=691). (b) Box-and-whisker plots (center line, median; lower and upper whiskers, 5% and 95% limit, respectively) showing yield of each cell type from all multipotent clones (n=105). (L): B/NK cells; (DC1): CD141+ DC; (DC2): CD1c+ DC; (M): monocyte; (G): granulocyte. Multiple unpaired two-tailed Student's t-test, n.s., not significant. (c) Scatter plots showing degree of correlation between clonal yield and potential. r, Spearman correlation factor; ****, p <0.0001. (d) Scatter plots and Box-and-whisker plots showing CD45+ cell yield of all clones in each population (red lines, mean). (e) Stacked columns summarizing qualitative potency of clones from each progenitor population. Bars are standard error of proportion of total positive clones. (f) Representative flow cytometry plots showing phenotype of live CD45+ cells produced from three individual multipotent clones. Pie charts showing relative abundance of cells for each corresponding clone. (g) Heat map showing normalized output for all six mature blood cell types (rows) from each single progenitor cell (columns). Colored bars on the top indicating four major clusters identified by unsupervised hierarchical clustering.
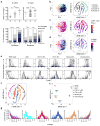
Figure 3
Figure 3. Statistical modeling of clonal potency reveals developmental patterns and lineage biases
(a) Scatter plots and stacked bar charts showing clonal output and potency composition of CD45+ cells derived from division 0, 3, and 6 of CFSE-labeled HSCs, either cultured in MP+FSG (left) or transferred to NSG mice (right) for 6 days. Lines are means and bars s.e.m. (b-d) Principal Component Analysis (PCA, left) and t-distributed stochastic neighbor embedding (t-SNE, right) showing clustered clonal data from Fig. 2a, in terms of assigned cluster (b), yield (c), and lineages produced (d). (e) Plots showing pattern similarities between PCA and t-SNE analysis. Clones were plotted according to their degree of commitment toward a specific cell type (top label) vs. either PCA dimension 2 (upper panels) or t-SNE dimension 1 (lower panels). (f) t-SNE map showing each clone assigned to a track based on its shortest distance. (g) Lines showing the degree of relative commitment, calculated in terms of offspring composition for each clone (line) on the indicated tracks in f. (h) Multidimensional scaling (MDS) plot showing developmental relationship among six cell types in terms of the likelihood that two lineages will arise from a common progenitor. *, p <0.05; **, p <0.01; ***, p <0.001; ****, p <0.0001; n.s., not significant (a: unpaired two-tailed Student's t-test, and Fisher's exact test on the frequency of unipotent cells). Data represent cumulative clones from three independent experiments (a), or seventeen cord blood donors (b-h).
Figure 4
Figure 4. Lineage bias is prevalent and starting early in HSCs
(a-b) Bar charts showing frequency distribution of all non-unipotent clones based on their degree of equipotency, as determined by the ratio of minimal lineage yield to maximal lineage yield (a); or by their degree of cell-type-specific potency bias, determined by the ratio of second-highest lineage yield to maximal lineage yield (b). Numbers indicate the cumulative % of clones for which the ratio is <0.5 (left line) or >0.5 (right line). (c and d) Scatter plots showing correlation between equipotency (c) or bias degree (d) and clonal yield for clones in panel a and b. r, Spearman correlation coefficient. (e) Scattered dots showing yield of the largest (1st) lineage and second largest (2nd) lineage produced by non-unipotent clones whose bias are <0.5 (n=115) or >0.5 (n=162), and of unipotent progenitors (n=931). Red lines are means and bars are s.e.m. (f) Stacked bars showing the proportion of HSC/MPP clones that are either unproductive or biased toward erythrocyte (Er), megakaryocytes (Mk), granulocyte (G), or monocyte/DC/lymphocyte (M/DC/L) lineages in MP+FSG (left, n=768) and JD (right, n=286) culture conditions. Bars are standard error of proportion. * p <0.05; **** p <0.0001; n.s., not significant (e: one-way ANOVA; f: Fisher's exact test on proportions of productive and non-productive clones, or of M/DC/L and G lineages between the two culture systems). Data represent cumulative clones from seventeen cord blood donors (a-f).
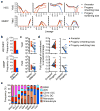
Figure 5
Figure 5. Lineage bias is transmitted to most progeny and can be further amplified toward full commitment along division
(a) Lines showing the yield for six lineages from ancestors (black) and progeny with potency profiles that are similar (red) or different (blue) from the ancestral clone. (b) Bar graphs showing the frequency of granddaughter cells that have inherited (red) or switched (blue) their ancestor's lineage bias (HSC, n=89; GMDP, n=109). (c) Plots comparing the average yield of siblings with inherited (red) or switched (blue) bias (HSC, n=13; GMDP, n=16). (d) Fold-change of commitment degree in progeny that inherited (left; HSC, n=66; GMDP, n=47) or switched (right; HSC, n=19; GMDP, n=26) from their ancestor's lineage bias. (e) Stacked columns showing relative composition of clonal bias for progenitor subtypes isolated from cord blood. Bars, mean values; error bars, standard error of proportion (calculated from total number of positive clones for each progenitor). ***, p <0.001; ****, p <0.0001 (b: unpaired two-tail Student's t-test; c-d: paired two-tail Student's t-test). Data shown are representative of cumulative clones from three (a-d) or from seventeen cord blood donors (e).
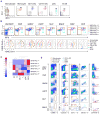
Figure 6
Figure 6. Distinct and inheritable pattern of IRF8 and PU.1 expression in progenitors correlates with lineage bias
(a-b) Flow cytometry plots showing protein levels of IRF8 and PU.1 in six types of mature immune cells (a) and nine types of progenitors (b, top). Boxes correspond to the gates for relative IRF8 and PU.1 expression level in each of the six mature cell lineages. t-SNE maps in b (bottom) show distribution of clones derived from progenitors, with colors indicating their corresponding lineage biases. (c) Heat map showing Pearson correlation coefficients between percentages of subpopulations identified by IRF8/PU.1 dosage and percentages of lineage composition of different progenitors as determined for b. The correlation matrices were hierarchically clustered and are shown in the heat map. (d) Flow cytometry plots showing in vivo potency of HSC/MPP, CMP, GMDP, LMPP, MLP and BNKP populations in NSG-SGM3 mice 14 days after intratibial injection. Numbers show percentages of parental gate. * p <0.05; ** p <0.01; *** p <0.001; **** p <0.0001 (c: paired two-tail Student's t-test for transformed correlation). Data shown are representative of three independent experiments (a-d).
Figure 7
Figure 7. Early expression of IRF8 in HSCs facilitates the specification of DC1 lineage
(a) Flow cytometry plots and histograms showing gating scheme of bone marrow Lin-Sca+Kit+ (LSK) cells from B6 and Irf8gfp mice. (b) FACs plots showing production of differentiated DCs from GFP+ and GFP- LSK cells after 7 days of co-culture with CD45.1 bone marrow cells with Flt3L. Scatter plots (right) showing yield of differentiated DCs. Bars are mean + s.e.m. (c) Histogram showing proliferation (top) and dot plots showing Sca1 and cKit phenotype of LSK cells from Irf8+/+, Irf8+/-, Irf8-/- mice after 3 days of culture as in a. Scatter plot showing yield of differentiated DCs after 7 days of culture. Bars are mean ± s.e.m. (d) FACs plots showing CFSE dilution of CB-derived HSC/MPPs, CMPs, and LMPP/MLPs after 6 days of MP+FSG culture (left). Numbers indicate rounds of divisions. Remaining panels (right) show protein levels of IRF8 and PU.1 per division. (e-f) FACs plots showing expression of IRF8 (top) and PU.1 (bottom) along division after 6 days of MP+FSG (e) or MP+SG culture (f). Numbers indicate percentage of IRF8+ (top) and PU.1+ cells (bottom). (g) Histogram showing division of indicated progenitors in MP+FSG or MP+SG culture. (h) Plots showing IRF8 and PU.1 expression for each progenitor after six days in MP+SG culture. Data are representative from four (a) and three (d-h) independent experiments, or from four (b) and three (c) mice per group.

Comment in

  • Counting the cost of lineage decisions.
    Yáñez A, Goodridge HS, Grimes HL. Yáñez A, et al. Nat Immunol. 2017 Jul 19;18(8):872-873. doi: 10.1038/ni.3794. Nat Immunol. 2017. PMID: 28722717 No abstract available.

Similar articles

Cited by

References

    1. Manz MG, Traver D, Miyamoto T, Weissman IL, Akashi K. Dendritic cell potentials of early lymphoid and myeloid progenitors. Blood. 2001;97(11):3333–3341. - PubMed
    1. D'Amico A, Wu L. The early progenitors of mouse dendritic cells and plasmacytoid predendritic cells are within the bone marrow hemopoietic precursors expressing Flt3. J Exp Med. 2003;198(2):293–303. - PMC - PubMed
    1. Karsunky H, Merad M, Cozzio A, Weissman IL, Manz MG. Flt3 ligand regulates dendritic cell development from Flt3+ lymphoid and myeloid-committed progenitors to Flt3+ dendritic cells in vivo. J Exp Med. 2003;198(2):305–313. - PMC - PubMed
    1. Geissmann F, Manz MG, Jung S, Sieweke MH, Merad M, Ley K. Development of monocytes, macrophages, and dendritic cells. Science. 2010;327(5966):656–661. - PMC - PubMed
    1. Akashi K, Traver D, Miyamoto T, Weissman IL. A clonogenic common myeloid progenitor that gives rise to all myeloid lineages. Nature. 2000;404(6774):193–197. - PubMed

Substances