Phosphorylation of Argonaute proteins affects mRNA binding and is essential for microRNA-guided gene silencing in vivo
- PMID: 28645918
- PMCID: PMC5510005
- DOI: 10.15252/embj.201696386
Phosphorylation of Argonaute proteins affects mRNA binding and is essential for microRNA-guided gene silencing in vivo
Abstract
Argonaute proteins associate with microRNAs and are key components of gene silencing pathways. With such a pivotal role, these proteins represent ideal targets for regulatory post-translational modifications. Using quantitative mass spectrometry, we find that a C-terminal serine/threonine cluster is phosphorylated at five different residues in human and Caenorhabditis elegans In human, hyper-phosphorylation does not affect microRNA binding, localization, or cleavage activity of Ago2. However, mRNA binding is strongly affected. Strikingly, on Ago2 mutants that cannot bind microRNAs or mRNAs, the cluster remains unphosphorylated indicating a role at late stages of gene silencing. In C. elegans, the phosphorylation of the conserved cluster of ALG-1 is essential for microRNA function in vivo Furthermore, a single point mutation within the cluster is sufficient to phenocopy the loss of its complete phosphorylation. Interestingly, this mutant retains its capacity to produce and bind microRNAs and represses expression when artificially tethered to an mRNA Altogether, our data suggest that the phosphorylation state of the serine/threonine cluster is important for Argonaute-mRNA interactions.
Keywords: RISC; Argonaute proteins; gene silencing; microRNA; phosphorylation.
© 2017 The Authors.
Figures
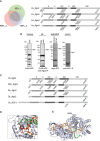
Mass spectrometric measurements of human Ago proteins. Left: Venn diagrams depict overlapping phosphorylation sites of biological replicates. Striped area indicates overlaps between three biological replicates. Right: Schematic representation of phosphorylation sites in Ago proteins. Scheme depicts the human Ago domain structure and phosphorylation sites that were detected by mass spectrometry after anti‐TNRC6 co‐IP/FLAG‐Ago‐APP. Green bars represent phosphorylation sites of Ago1–4 measured in at least three biological replicates, and phosphorylated sites that are measured in only two biological replicates are indicated in orange.
Ago protein purification from different species. To analyze conservation of Ago phosphorylation sites, endogenous proteins were purified by Ago‐APP, FLAG‐APP, and Ago/ALG‐1‐IP from mouse tissue, rat H32 cells, zebrafish embryos, and a mixed population of worms. Samples were eluted with Laemmli buffer, separated by electrophoresis, and stained with Coomassie Blue.
Conservation of Ago2 phosphorylation sites in different species. Overview of conserved phosphorylation sites of Ago proteins from various species. Green bars represent phosphorylation sites that are measured in at least three biological replicates, and phospho‐sites that are measured in two biological replicates are indicated in orange. Hs: Homo sapiens, Mm: Mus musculus, Rn: Rattus norvegicus, Dr: Danio rerio, Ce: Caenorhabditis elegans.
Position of MID domain phospho‐sites on the human Ago2 structure. Location of the residues 555:61 are shown in red, based on the model 4W5O (Schirle & MacRae, 2012).
Position of the C‐terminal cluster phosphorylation. The structure is based on the model 4W5O (Schirle & MacRae, 2012). Residues 824:34 are located on a flexible loop (not shown) from E821 to G836. The miRNA is indicated in orange, and parts of the mRNA are shown in green.
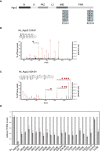
Schematic representation of the Ago2 domain organization. The positions of identified phosphorylation sites are shown in red bars. The single phosphorylation sites of 555:61 and the cluster phosphorylations of 824:34 are highlighted in blue boxes.
Representative CID fragment spectra of phosphorylated human Ago2 peptides from a LC‐UHR‐QTOF run. Monophosphorylated Ago2 peptide TpTPQTLSNLCLK. Monoisotopic mass: 1397.65 Da, Mascot ion score: 45, expectation value: 3.2e‐005, Δ mass: 0.01 Da.
Quadruplyphosphorylated Ago2 peptide YHLVDKEHDpSAEGpSHTpSGQpSNGR. Phospho‐site localization at positions S824, S828, S831, S834 according to Mascot. Monoisotopic mass: 2829.98 Da, Mascot ion score: 31, expectation value: 0.00085, Δ mass: 0.0017 Da.
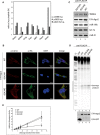
Tethering assays with F/H‐tagged wt Ago2 as well as several mutants. Renilla luciferase (RNL) activity was detected in extracts of HeLa cells. Cells were co‐transfected with constructs expressing the RNL‐5BoxB reporter, firefly luciferase (FF) and λNAgo2 and phospho‐mutants. λNTNRC6 served as positive control. The expression levels of Renilla luciferase were normalized to co‐transfected firefly luciferase signals (n ≥ 3, SEM).
Quantification of Ago2 phosphorylation levels in primary mouse tissues. The two most prominent phosphorylation sites, pS388 and the cluster pS825:35, were analyzed by quantitative mass spectrometric measurements (SRMs). Therefore, Ago1–4 were purified by FLAG‐APPs. Isotope‐labeled phosphorylated peptides were spiked into the tryptic digest. Bars represent the ratio phosphorylated:non‐phosphorylated peptide (p/n.p.). S388 is phosphorylated at very low levels (1%, white bars), whereas S825 is phosphorylated at around 10–25% (light gray bars). The cluster peptide with phosphorylations at S825, S829, S832, and S835 can be detected in high levels (dark gray).
Immunofluorescence of overexpressed Ago2 variants. HeLa cells were transfected with F/H‐Ago2 wt and 824:34 mutants. Ago2 and mutants were detected in immunofluorescence with anti‐HA antibody staining (shown in green). For co‐localization studies, LSm4, a P body marker, was stained with a specific antibody (shown in red). DAPI staining (blue) indicates the nucleus.
Co‐immunoprecipitation of TNRC6 proteins and miR‐19b. F/H‐Ago2 wt and 824:34 mutants were overexpressed in HEK 293T cells, immunopurified by anti‐FLAG‐IP, separated on a SDS–PAGE, and analyzed by Western blotting. Co‐immunoprecipitated TNRC6 proteins were detected by pan‐TNRC6‐antibody, clone 7A9, and F/H‐Ago2 were detected by anti‐HA antibody. Co‐immunoprecipitated miR‐19b, miR‐21, and let‐7a were detected by Northern blotting.
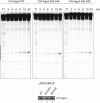
In vitro cleavage assay of Ago2 cluster mutants. Cleavage activity of non‐phosphorylatable and phospho‐mimicking mutants of Ago2. F/H‐tagged Ago2 and the 824:34 cluster mutants were overexpressed in HEK 293T cells, immunoprecipitated, and incubated with a radiolabeled substrate perfectly complementary to the endogenously co‐precipitating miR‐19b. A partial digest of the radiolabeled substrate by RNase T1 is indicated by “T1”. The region complementary to miR‐19b is shown by a black bar. A part of the immunoprecipitated protein was used for Western blot control (lower panels).
Quantification of relative cleavage activity of wt Ago2 and 824:34 A and E mutants. Cleavage assays were performed as described before, but with different reaction times (2, 4, 6, 8, 15, 30 min). The cleavage products of Ago2 wt and mutants were normalized to uncleaved substrate in each reaction (replicates ≥ 3, SEM).

Alignment of human and C. elegans microRNA‐specific Ago proteins. Alignment of human Ago1–4 (Q9UL18, Q9UKV8, Q9H9G7, and Q9HCK5) and C. elegans ALG‐1 isoform‐a and isoform‐b (G5EGR6, G5EES3) using Clustal Omega.
Representative CID fragment spectrum of a triply phosphorylated C. elegans ALG‐1 peptide from a LC‐UHR‐QTOF analysis. Peptide YHLVDREHDSGEGpSQPpSGpTSEDTTLSNMAR is present in both ALG‐1 isoforms a and b. Phospho‐site localization at ALG‐1_iso‐b positions S992, S995, T997 according to Mascot. Monoisotopic mass: 3,515.34 Da, Mascot ion score: 53, expectation value: 4.8e‐006, Δ mass: 0.01 Da.
Phospho‐lacking 824:834 cluster transgenes cannot rescue the loss of alg‐1. Animals of wild‐type genotype, alg‐1(0) or alg‐1(0) carrying extrachromosomal transgene arrays of alg‐1 were used to assess the ability of different phosphorylation transgenic ALG‐1 mutants that correspond to the 824:834 human Ago2 cluster (phospho‐lacking: 5A (serines 988, 992, 995, and 998 along with threonine 997 mutated to A) and S992A; phospho‐mimicking: 4E (serines 988, 992, 995, and 998 mutated to glutamate and S992E) to rescue the alae formation defects of alg‐1 depleted animals. Young adult animals were monitored with Nomarski DIC microscopy to determine the structure of alae (complete, gapped, or no alae). The number of animals scored (n) is indicated.
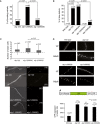
Lethality through bursting vulva. Percentage of the alg‐1(0), alg‐1(S992A), and alg‐1(S992E) mutant animal population that burst through the vulva once reaching adulthood. The P‐values indicated were measured by two‐tailed Fisher's exact test. The number of animals screened (n) is indicated.
Alae formation. Young adult animals were assayed with Nomarski DIC microscopy to evaluate the incidence of alae formation defects. The P‐values indicated were measured by two‐tailed Fisher's exact test. The number of animals scored (n) is indicated. The absence of alae defects for heterozygous animals demonstrates that S992A is a recessive mutation.
Seam cell number at adulthood. alg‐1(0), phospho‐mimicking (S992E), and phospho‐lacking (S992A) ALG‐1 expressing mutants were crossed with a strain expressing GFP in the seam cells, and the number of seam cells was scored in young adults. Top: The box‐and‐whisker plot showing the distribution of seam cells number of alg‐1(0), alg‐1(S992A), and alg‐1(S992E) animals (26, 23, and 19 animals were scored, respectively). The bottom and top of the box represent the first and third quartile and the middle horizontal line is the median. Whiskers represent the maximum and minimum number of seam cells observed. The dashed line represents the number of seam cells scored in adult wild‐type animals (n = 26). The P‐values indicated were measured by two‐tailed Fisher's exact test. Bottom: Representative images with number of seam cells (in parenthesis) are shown. The scale bar represents 50 μm.
Functional analysis using a let‐7 microRNA reporter. Animals carrying the GFP reporter transgene under the control of a hypodermis‐specific col‐10 promoter and the lin‐41 3′UTR containing the let‐7 microRNA binding sites (red: diagram) were crossed into either alg‐1(0), phospho‐lacking (S992A), or phospho‐mimicking (S992E) alg‐1 mutant animals. Top: Representative pictures of GFP expression during early larval stages (L2) and in young adult animals (Adult). The scale bar represents 20 μm. Bottom: Quantification of GFP in adult animals was performed by measuring the mean of the GFP detected in five different cells for each animal. The P‐values were calculated with a two‐tailed Student's t‐test. The number of animals scored (n) is indicated.

Quantification of microRNA expression. The levels of let‐7, lin‐4, miR‐48, mir‐80, miR‐51, and miR‐54 in alg‐1(0), alg‐1(S992A), and alg‐1(S992E) adult animals were measured by qRT–PCR and normalized to the levels of wt animals. Small nucleolar RNA sn2841 was used as reference. The dashed line represents wt miRNA levels. The error bars represent the 95% confidence interval from three independent experiments, and P‐values were calculated with a two‐tailed Student's t‐test; *P < 0.05.
ALG‐1 immunoprecipitation from young adult animal populations expressing either wild‐type alg‐1 (wt), alg‐1(S992A), or alg‐1(S992E) was performed using a specific ALG‐1 polyclonal antibody. Top: 90% of immunoprecipitated (IPed) complexes were used to detect levels of miRNAs by qRT–PCR. Samples were spiked with human miR‐20a before extraction and used as a technical control. The dashed line represents the level of miRNA associated to wt ALG‐1 immunoprecipitated complexes. The error bars represent the 95% confidence interval from three independent experiments, and a two‐tailed Student's t‐test was applied on the normalized Ct values to obtain P‐values (no significant changes were observed (not shown)). Bottom: 10% of the immunoprecipitated (IP) complexes were used to detect ALG‐1. Inputs represent 5% of total protein extracts used for immunoprecipitation.

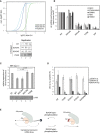
RIP experiments using F/H‐Ago2 as well as phosphorylation mutants. The plots show the cumulative distribution of the log2‐fold changes (log2FC) of Ago2 mutants vs. wild type. The 824:34A mutant binds comparably or slightly stronger than wt Ago2 (most of the points from the cumulative distribution fall to the right of the plot). The 824:34E mutant precipitates far less mRNAs than wt Ago2, while the mode of binding seems similar to 824:34A. For the Y529E mutant, which lacks a bound miRNA, we observe for most mRNAs weaker binding compared to the 824:34E mutant. In addition, the binding mode appears different from the phosphorylation mutants. The transcripts are enriched in IPs (median of three replicates) vs. input from wild‐type Ago2 overexpressing cells. Vertical line at 0 represents a log2FC of zero compared to wild‐type Ago2. Replicates of Ago2 wt, 824:34A, E, and Y529E mutants were analyzed by Western blot using anti‐HA antibody.
Validation of the RIP experiments via qRT–PCR. For validation of RIP experiments, F/H‐Ago2 constructs were overexpressed in HEK 293T cells, immunoprecipitated, RNA extracted, and cDNA produced. Different targets (NFICI, ST6GALNAC6, SERBP1, F8A1, HAND1) were tested upon binding to Ago2 mutants via qRT‐PCR. GFP served as negative control. Relative enrichment over input was normalized to Ago2 wt. Analyses were done with at least three biological replicates and calculated as mean (SEM).
Luciferase assay of Ago2 and mutants. Luciferase assay performed on HMGA2‐3′UTR to observe the repression by overexpressed F/H‐Ago2 and mutants in MEF Ago2−/− cells (replicates ≥ 3, SEM; P‐values were calculated using a two‐tailed Student's t‐test).
Quantification of Ago2 phosphorylation levels in different Ago2 mutants. The phosphorylation sites pS387 and the cluster pS824:34 were analyzed by quantitative mass spectrometric measurements (SRMs). Therefore, F/H‐Ago2 and its mutants were purified by anti‐FLAG‐IP. Isotope‐labeled phosphorylated peptides were spiked into the tryptic digest. Bars represent the ratio phosphorylated:non‐phosphorylated peptide (p/n.p.). S387 is phosphorylated at same levels in wt and mutants, indicating equal measurements (white bars), whereas S824 is phosphorylated at around 3% in wt and 555:61A mutant, but weak phosphorylated in Y529E, 555:61E, and 620/694W mutant (light gray bars). The cluster peptide with phosphorylations at 824, 828, 831, and 834 can be detected in wt and 555:61A, but almost no phosphorylation can be measured at the other mutants (dark gray). Analyses were performed with four biological replicates and calculated as mean (SEM).
Mechanistic model summarizing how Ago hyper‐phosphorylation might trigger mRNA dissociation. After incorporation into repressive mRNPs, Ago can become hyper‐phosphorylated at the 824:34 cluster. The negatively charged phosphates repel the mRNA from Ago proteins, and mRNA target is released. After dephosphorylation of Ago, it can be recycled and guided to a new target mRNA, or it leads to degradation of Ago. Alternatively, phosphorylation might also be a decay signal.

Similar articles
-
Casein kinase 1 and 2 phosphorylate Argonaute proteins to regulate miRNA-mediated gene silencing.EMBO Rep. 2023 Nov 6;24(11):e57250. doi: 10.15252/embr.202357250. Epub 2023 Sep 15. EMBO Rep. 2023. PMID: 37712432 Free PMC article.
-
Caenorhabditis elegans ALG-1 antimorphic mutations uncover functions for Argonaute in microRNA guide strand selection and passenger strand disposal.Proc Natl Acad Sci U S A. 2015 Sep 22;112(38):E5271-80. doi: 10.1073/pnas.1506576112. Epub 2015 Sep 8. Proc Natl Acad Sci U S A. 2015. PMID: 26351692 Free PMC article.
-
A specific type of Argonaute phosphorylation regulates binding to microRNAs during C. elegans development.Cell Rep. 2022 Dec 13;41(11):111822. doi: 10.1016/j.celrep.2022.111822. Cell Rep. 2022. PMID: 36516777 Free PMC article.
-
A multitasking Argonaute: exploring the many facets of C. elegans CSR-1.Chromosome Res. 2013 Dec;21(6-7):573-86. doi: 10.1007/s10577-013-9383-7. Chromosome Res. 2013. PMID: 24178449 Review.
-
Quantifying Argonaute proteins in and out of GW/P-bodies: implications in microRNA activities.Adv Exp Med Biol. 2013;768:165-82. doi: 10.1007/978-1-4614-5107-5_10. Adv Exp Med Biol. 2013. PMID: 23224970 Free PMC article. Review.
Cited by
-
Prediction of miRNA targets by learning from interaction sequences.PLoS One. 2020 May 5;15(5):e0232578. doi: 10.1371/journal.pone.0232578. eCollection 2020. PLoS One. 2020. PMID: 32369518 Free PMC article.
-
Oncogenic K-Ras suppresses global miRNA function.Mol Cell. 2023 Jul 20;83(14):2509-2523.e13. doi: 10.1016/j.molcel.2023.06.008. Epub 2023 Jul 3. Mol Cell. 2023. PMID: 37402366 Free PMC article.
-
Control of hepatic gluconeogenesis by Argonaute2.Mol Metab. 2018 Dec;18:15-24. doi: 10.1016/j.molmet.2018.10.003. Epub 2018 Oct 9. Mol Metab. 2018. PMID: 30348590 Free PMC article.
-
CRISPR-RfxCas13d screening uncovers Bckdk as a post-translational regulator of the maternal-to-zygotic transition in teleosts.bioRxiv [Preprint]. 2024 May 23:2024.05.22.595167. doi: 10.1101/2024.05.22.595167. bioRxiv. 2024. PMID: 38826327 Free PMC article. Preprint.
-
CSDE1 attenuates microRNA-mediated silencing of PMEPA1 in melanoma.Oncogene. 2021 May;40(18):3231-3244. doi: 10.1038/s41388-021-01767-9. Epub 2021 Apr 8. Oncogene. 2021. PMID: 33833398
References
-
- Ambros V, Horvitz HR (1984) Heterochronic mutants of the nematode Caenorhabditis elegans . Science 226: 409–416 - PubMed
MeSH terms
Substances
Grants and funding
LinkOut - more resources
Full Text Sources
Other Literature Sources
Molecular Biology Databases

