. 2017 Jun 21:8:15896.
doi: 10.1038/ncomms15896.

Single-molecule analysis of steroid receptor and cofactor action in living cells

Affiliations

Single-molecule analysis of steroid receptor and cofactor action in living cells

Ville Paakinaho et al. Nat Commun. .

Abstract

Population-based assays have been employed extensively to investigate the interactions of transcription factors (TFs) with chromatin and are often interpreted in terms of static and sequential binding. However, fluorescence microscopy techniques reveal a more dynamic binding behaviour of TFs in live cells. Here we analyse the strengths and limitations of in vivo single-molecule tracking and performed a comprehensive analysis on the intranuclear dwell times of four steroid receptors and a number of known cofactors. While the absolute residence times estimates can depend on imaging acquisition parameters due to sampling bias, our results indicate that only a small proportion of factors are specifically bound to chromatin at any given time. Interestingly, the glucocorticoid receptor and its cofactors affect each other's dwell times in an asymmetric manner. Overall, our data indicate transient rather than stable TF-cofactors chromatin interactions at response elements at the single-molecule level.


Conflict of interest statement

The authors declare no competing financial interests.

Figures
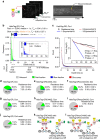
Figure 1
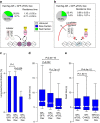
Figure 1. Single-molecule tracking (SMT) of GR molecules.
(a) The SMT technique visualizes individual molecules as bright diffraction-limited spots and tracks their movement or lack thereof over time. HaloTag-GR (cartoon) labelled with Janelia Fluor 549 (JF549) can be visualized as such diffraction-limited spots under HILO microscopy. Cort, corticosterone. Scale bar, 5 μm. A stack of images is taken from a single live cell with a fixed acquisition time and a specific interval time. If molecules remain stationary, the time-projection stack will reveal a continuous signal that represents a bound molecule (red box). (b) Distribution of residence times from individual GR(+Cort) stationary tracks, either in a histogram or in a Box-plot. A continuum of bi-exponentially distributed bound molecules is typically observed, based on the fitting of the survival distribution. The fast short-lived (Tns, non-specific) and slow long-lived (Ts, specific) fractions are colour-coded (green and blue, respectively). Inset shows only the Ts population (orange arrow, median). The number (n) of tracks obtained, and the median dwell time in Tns and Ts fraction is shown above the histogram. (c) Single molecules of GR(+Cort) data represented as collected tracks (black circles) in a survival distribution plot, fitted to a single- (blue line), double- (red line) or three-exponential (dashed light blue line) decay model. Inset view with y axis plotted as a log10. F-test determines the statistical significance of the fit between different decay models. (dj) Pie-charts represent percentage of molecules unbound (grey), bound at the fast, short-lived fraction (green), and bound at the slow, long-lived fraction (blue) of HaloTag-GR under different conditions as indicated. In the case of HaloTag-GRmonC440G(+Cort) (i), a single-exponential (one component, red) was sufficient to explain the data. The average residence time of fast, short-lived and slow, long-lived fraction is presented next to their representative fractions. (k,l) The cartoons illustrate the likely ‘interference’ between HaloTag-GR and the endogenous GR molecules. Exposure time 10 ms; interval time 200 ms.
Figure 2
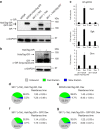
Figure 2. Single-molecule behaviour of transiently expressed of HaloTag-GR reflects well the behaviour of stably integrated HaloTag-GR.
(a) Immunoblotting against GR showing the different protein levels in 3617 cells knockout of endogenous GR (KOGR), stably integrated HaloTag-GR cells (KOGR+HaloTag-GR), 3617 cells treated with (+Tet) or without (-Tet) tetracycline to suppress or express stably integrated GFP-GR, and 3617 cells transiently transfected with HaloTag-GR. The band representing HaloTag-GR in transiently transfected conditions is marked with a red asterisk. Immunoblotting with GAPDH antibody was used as a loading control. (b) Immunoblotting with GR antibody with a longer exposure time reveals the lower levels of transiently transfected HaloTag-GR compared to the endogenous protein. (c) mRNA expression of GR target genes, Period 1 (Per1), serum and glucocorticoid-regulated kinase (Sgk), and orosomucoid (Orm) after 1 h Dex treatment in 3617 knockout of endogenous GR (3617 KOGR) and 3617 KOGR with stably integrated HaloTag-GR (3617 KOGR Stable HaloTag-GR) cells. Bar graph represent mean fold induction±s.d. Data represent at least two biological replicates. (dg) The bound fractions and the average residence time for transiently transfected HaloTag-GR in 3617 cells (d), stably integrated HaloTag-GR in KOGR cells (e), transiently transfected HaloTag-GR+GFP in 3617 cells (f), and transiently transfected HaloTag-GR in 3617 cells grown without Tet to induce expression of stably integrated GFP-GR (g). Pie charts presented as in Fig. 1. Exposure time 10 ms; interval time 200 ms.
Figure 3
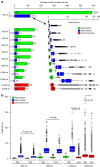
Figure 3. HaloTag-GR single-molecule tracking data with different interval times.
(a) Acquisition parameter effects. SMT of HaloTag-GR labelled with JF549 in Dex-treated cells as a function of different interval acquisition times. The figure shows the average number of tracks per cell on each fraction and the Box-plot data of residence times under the indicated interval times. White bars represent the average number of outliers within each population. For each condition, the data have been corrected for photobleaching. (b) Comparison of dwell time distribution of HaloTag-GR treated with Dex or Cort under different interval times as indicated. Box-plot represents the distribution of dwell times for all molecules in the fast short-lived (green boxes) and slow long-lived (blue boxes) fraction for GR. GR in Cort-treated cells with 1,000 and 2,000 ms interval time and GR in Dex-treated cells with 2,000 ms interval time are presented as one-component fraction (red boxes). Statistical outliers are shown as black circles. P values represent a Two-sample Kolmogorov–Smirnov test defined by the brackets. Exposure time 10 ms; interval time as indicated.
Figure 4
Figure 4. Single-molecule analysis indicates an increase in residence time and bound fraction of steroid receptors after hormonal activation.
(a) The bound fractions and the average residence time for HaloTag-ER, -GR, -PR and -AR in untreated cells (left panel), and in cognate hormone-treated cells (17β-estradiol (E2) for ER, Dex for GR, Progesterone (Prog) for PR, and dihydrotestosterone (DHT) for AR) (right panel). Pie charts presented as in Fig. 1. (b) Bar chart represents the long-lived fraction for ER in untreated and E2-treated cells, GR in untreated and Dex-treated cells, PR in untreated and Prog-treated cells, and AR in untreated and DHT-treated cells. P values from a Student’s t-test defined by the brackets. Bar graph represents the mean long-lived bound fraction±s.d. Data collected from at least two independent microscopy sessions. The number of cells and tracks analysed per condition are described in Supplementary Data 1. (c) Box-plot represents the distribution of dwell times for all molecules in the slow long-lived fraction for ER in untreated and E2-treated cells, GR in untreated and Dex-treated cells, PR in untreated and Prog-treated cells, and AR in untreated and DHT-treated cells. P values represent a Two-sample Kolmogorov–Smirnov test defined by the brackets. (d) Cartoon illustrates activation of the receptor leads to a decrease in unbound and increase in bound receptors. H, steroid hormone; HRE, hormone response element; SR, steroid receptor. Exposure time 10 ms; interval time 200 ms.
Figure 5
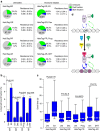
Figure 5. Asymmetric modulation between GR and cofactors at the single-molecule level.
(a) The bound fractions and the average residence time for HaloTag-GRIP1, -GRIP1mutant (GRIP1mut) and SNAP-tag-BRG1 in untreated and in Dex-treated cells. Pie charts presented as in Fig. 1. (b) Cartoons of the respective pie charts illustrate the interaction of GR with GRIP1 and BRG1 after Dex treatment, and the inhibition of interaction with GRIP1mut. (c,d) The bound fractions and the average residence time for HaloTag-GR in Dex-treated cells exposed to control siRNA (siSCR) (c), or GRIP1 siRNA (siGRIP1) (d). (e) Bar chart represents the long-lived fraction for GRIP1, and GRIP1mut in untreated and Dex-treated cells. P values represent a Student’s t-test defined by the brackets. Bar graph represents the mean long-lived bound fraction±s.d. Data collected from at least two independent microscopy sessions. The number of cells and tracks analysed per condition are described in Supplementary Data 1. (f) Box-plot represents the distribution of dwell times for all molecules in the long-lived fraction for GRIP1, and GRIP1mut in untreated and Dex-treated cells. P value represents a Two-sample Kolmogorov–Smirnov test defined by the brackets. (g) Bar chart represents the long-lived fraction for GR in siSCR- and siGRIP1-treated cells. P values represent a Student’s t-test defined by the brackets. (h) Box-plot represents the distribution of dwell times for all molecules in the long-lived fraction for GR in siSCR- and siGRIP1-treated cells. P value represents a Two-sample Kolmogorov–Smirnov test defined by the brackets. Exposure time 10 ms; interval time 200 ms.
Figure 6
Figure 6. The residence time and bound fraction of c-JUN and c-FOS are Dex-independent.
(a) The bound fractions and the average residence time for HaloTag-c-FOS, -a-FOS and c-JUN in untreated cells, and HaloTag-c-FOS, and -c-JUN in Dex-treated cells. Pie charts presented as in Fig. 1. (b) Bar chart represents the long-lived fraction for c-FOS, a-FOS and c-JUN in untreated and c-FOS, and c-JUN in Dex-treated cells. P values represent a Student’s t-test defined by the brackets. Bar graph represents the mean long-lived bound fraction±s.d. Data collected from at least two independent microscopy sessions. The number of cells and tracks analysed per condition are described in Supplementary Data 1. (c) Box-plot represents the distribution of dwell times for all molecules in the long-lived fraction for c-FOS, a-FOS and c-JUN in untreated, and c-FOS and c-JUN in Dex-treated cells. P values represent a Two-sample Kolmogorov–Smirnov test defined by the brackets. Exposure time 10 ms; interval time 200 ms. (d) Confocal microscopy images of cells expressing HaloTag-c-JUN with GFP-c-FOS (left panels) or GFP-a-FOS (right panels). Top panels represent c-JUN (red), middle panels FOS (green) and lower panels merge of c-JUN and FOS. Scale bar, 5 μm.
Figure 7
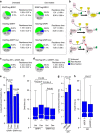
Figure 7. Disruption of AP-1 reduces GR residence time and bound fraction to a similar level as GR DNA-binding mutant.
(a,b) The bound fractions and the average residence time for HaloTag-GR in the presence of GFP-c-FOS (a), and GFP-a-FOS (b) in Dex-treated cells. GFP was used to visualize the FOS-positive cells. Pie charts presented as in Fig. 1. Cartoons below the pie charts illustrate the importance of AP-1 in regulating GR chromatin binding. (c) Bar chart represents the long-lived fraction for GR+GFP, GR+GFP-c-FOS and GR+a-FOS in Dex-treated cells. P values represent a Student’s t-test defined by the brackets. Bar graph represents the mean long-lived bound fraction±s.d. Data collected from at least two independent microscopy sessions. The number of cells and tracks analysed per condition are described in Supplementary Data 1. (d) Box-plot represents the distribution of dwell times for all molecules in the long-lived fraction for GR+GFP, GR+GFP-c-FOS and GR+a-FOS in Dex-treated cells. P values represent a Two-sample Kolmogorov–Smirnov test defined by the brackets. (e) Box-plot represents the distribution of dwell times for all molecules in the long-lived fraction for GR+a-FOS, GRC440G and GRmonC440G in Dex-treated cells. P values represent a Two-sample Kolmogorov–Smirnov test defined by the brackets. Exposure time 10 ms; interval time 200 ms.

Similar articles

Cited by

References

    1. Liu Z. et al.. Enhancer activation requires trans-recruitment of a mega transcription factor complex. Cell 159, 358–373 (2014). - PMC - PubMed
    1. Mueller F., Stasevich T. J., Mazza D. & McNally J. G. Quantifying transcription factor kinetics: at work or at play? Crit. Rev. Biochem. Mol. Biol. 48, 492–514 (2013). - PubMed
    1. Thanos D. & Maniatis T. Virus induction of human IFN beta gene expression requires the assembly of an enhanceosome. Cell 83, 1091–1100 (1995). - PubMed
    1. Coulon A., Chow C. C., Singer R. H. & Larson D. R. Eukaryotic transcriptional dynamics: from single molecules to cell populations. Nat. Rev.Genet. 14, 572–584 (2013). - PMC - PubMed
    1. McNally J. G., Mueller W. G., Walker D., Wolford R. G. & Hager G. L. The glucocorticoid receptor: rapid exchange with regulatory sites in living cells. Science 287, 1262–1265 (2000). - PubMed

Publication types

MeSH terms