. 2017 Jun 12:8:15760.
doi: 10.1038/ncomms15760.

Identification of the elementary structural units of the DNA damage response

Affiliations

Identification of the elementary structural units of the DNA damage response

Francesco Natale et al. Nat Commun. .

Abstract

Histone H2AX phosphorylation is an early signalling event triggered by DNA double-strand breaks (DSBs). To elucidate the elementary units of phospho-H2AX-labelled chromatin, we integrate super-resolution microscopy of phospho-H2AX during DNA repair in human cells with genome-wide sequencing analyses. Here we identify phospho-H2AX chromatin domains in the nanometre range with median length of ∼75 kb. Correlation analysis with over 60 genomic features shows a time-dependent euchromatin-to-heterochromatin repair trend. After X-ray or CRISPR-Cas9-mediated DSBs, phospho-H2AX-labelled heterochromatin exhibits DNA decondensation while retaining heterochromatic histone marks, indicating that chromatin structural and molecular determinants are uncoupled during repair. The phospho-H2AX nano-domains arrange into higher-order clustered structures of discontinuously phosphorylated chromatin, flanked by CTCF. CTCF knockdown impairs spreading of the phosphorylation throughout the 3D-looped nano-domains. Co-staining of phospho-H2AX with phospho-Ku70 and TUNEL reveals that clusters rather than nano-foci represent single DSBs. Hence, each chromatin loop is a nano-focus, whose clusters correspond to previously known phospho-H2AX foci.


Conflict of interest statement

The authors declare no competing financial interests.

Figures
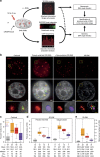
Figure 1
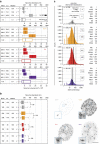
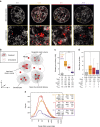
Figure 1. Characterization of γH2AX foci at different resolution levels.
(a) Schematics of the experimental approach. (b) Mid-nuclear sections of confocal microscopy (z: 200 nm) and 3D-SIM (z: 125 nm) representative images of cells, 24 h post IR. Only for 3D-SIM, the same exemplary cell is shown as re-computed pseudo-wide-field image before or after deconvolution as well as the original 3D-SIM output. The total number of detected foci (highlighted in colours) in the whole nuclear volume is shown in the DAPI panels. The lower panels show magnified views of the yellow dashed frame. Scale bars, 5 μm and 500 nm for main micrographs and magnified regions, respectively. γH2AX foci number distributions before and during DDR, from confocal images (c), 3D-SIM re-computed pseudo-wide-field of identical cell nuclei, before or after deconvolution (d) and original 3D-SIM images (e). n: total number of imaged cells from three independent experiments. All boxes and whiskers represent 25–75 percentiles and three times the IQD. The mean number of foci and corresponding s.d., the median as well as the 95% confidence intervals (CI) for the median are shown below each box. NA: not applicable. For ce: one-way ANOVA with Dunnett's correction; ***P<10−3.
Figure 2
Figure 2. Metrics of γH2AX nano-foci dimensions and DNA content.
(a) Quantification of nano-foci diameters in the three dimensions (filled boxes, top) during DDR. From these three dimensions, the volumes were calculated (empty boxes, bottom). The difference between lateral and axial measurements is due to the lower resolution in the axial direction. Figures in nm or nm3 × 106 are shown. (b) STED microscopy of γH2AX immunofluorescence. (left) Quantification of lateral diameters of γH2AX nano-foci. Statistics and size scale are as in a. (right) Exemplary STED images of cells before and after IR are shown together with the magnified views of the light-blue boxes. Scale bars, 5 μm and 500 nm for main micrographs and magnified regions, respectively. (c) DNA content distributions of γH2AX nano-foci before and during DDR. Only in IR-exposed cells, we found nano-foci larger than 1 Mbp (dashed boxes), and their frequency never exceeded 1% (0.14%, 0.28%, 0.95% for 0.5 h, 3 h and 24 h, respectively). Kruskal–Wallis χ2=18,503, df=3, P<2.2 × 10⁻¹⁶. Statistics (in kb) are shown next to each distribution. All boxes and whiskers are as in Fig. 1. n: total number of measured nano-foci from all imaged cells in two independent experiments, for 3D-SIM (a,c) or STED (b).
Figure 3
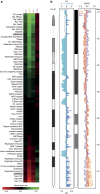
Figure 3. Temporal correlation of γH2AX ChIP-Seq signal and genomic features.
(a) Genome-wide correlation between ChIP-Seq γH2AX profiles and genomic features, before and during DDR. Spearman's ρ correlation coefficient is calculated between 10 kb-binned γH2AX profiles and the genomic features (Supplementary Table 3), and colour-coded from red (anti-correlation) to green (correlation). All genomic features are ordered decreasingly, according to the highest correlation value (γH2AX and GC, 0.5 h: 0.81). For all correlations: P<<2.2 × 10⁻¹⁶. (b) Exemplary ChIP-Seq γH2AX profile on chromosome 21. (left) H3K9me3, H3K36me3 and GC content (grey line); (right) γH2AX levels during DDR.
Figure 4
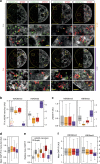
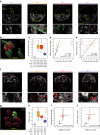
Figure 4. 3D-SIM chromatin composition analysis of γH2AX nano-foci before and during DDR.
(a) Exemplary 3D-SIM images of γH2AX (red) and H3K9me3/H3K36me3 (green) co-immunostaining before and after IR. Top panels: mid-nuclear sections showing γH2AX and histone marks with (right half) or without (left half) DAPI counterstaining. The dashed lines depict the nuclear contour. Bottom panels: magnification of the yellow dashed boxes with corresponding reference number. Scale bars, 5 μm and 500 nm for main micrographs and magnified regions, respectively. (b) Quantification of the H3K36me3 and H3K9me3 fluorescence intensities measured in γH2AX nano-foci volumes. Kruskal–Wallis χ2=19.875, df=3, P=1.802 × 10⁻⁴ and Kruskal–Wallis χ2=24,451, df=3, P=2.011 × 10⁻⁵. (c) Quantification of the γH2AX fluorescence intensity in H3K36me3- (Kruskal–Wallis χ2=261,960, df=191,020, P<2.2 × 10⁻¹⁶) and H3K9me3- (Kruskal–Wallis χ2=246,300, df=232,750, P<2.2 × 10⁻¹⁶) decorated chromatin. (d) Mean DAPI intensity in γH2AX nano-foci. Kruskal–Wallis χ2=247,910, df=245,320, P=1.129 × 10⁻⁴. (e) Quantification of maximum DAPI intensity in the volume occupied by γH2AX nano-foci (regular boxes) and shells (pattern), relative to the maximum integrated nuclear intensity. Shells represent 3D hollow structures surrounding γH2AX nano-foci (Supplementary Fig. 5E and ‘Methods' section). Wilcoxon rank sum all <2.2 × 10⁻¹⁶. (f) Mean DAPI fluorescence intensity in H3K36me3- or H3K9me3-decorated chromatin. Kruskal–Wallis χ2=303,050, df=292,700, P<2.2 × 10⁻¹⁶ and Kruskal–Wallis χ2=25,500, df=25,002, P=0.01338. Dotted lines: mean DAPI intensity measured over the whole analysed nuclei. All boxes and whiskers are as in Fig. 1. AU: arbitrary units. Results are from two independent experiments.
Figure 5
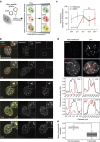
Figure 5. Analysis of γH2AX and H3K9me3 levels at heterochromatin-targeted CRISPR-Cas9-mediated DSBs.
(a) Schematics of the CRISPR-Cas9-mediated DSBs induction at murine major satellites DNA. C2C12 cells were transfected with Cas9 and major satellites gRNAs plasmids and fixed after the indicated times. (b) Representative immunofluorescence images of γH2AX and H3K9me3 in C2C12 cells. Scale bars, 10 μm and 2 μm for micrograph and inset, respectively. (c) Quantification of γH2AX and H3K9me3 fluorescence intensity from DAPI-segmented chromocentres. Mean and s.d. from (b) are shown. n=5 cells (2–19 chromocentres), 5 cells (6–15 chromocentres), 5 cells (8–19 chromocentres), 5 cells (13–19 chromocentres) and 4 cells (9–19 chromocentres), for untransfected, 3 h, 6 h, 12 h and 24 h time points, respectively. See image analysis in the ‘Methods' section for details. (d) Representative STED immunofluorescence images of γH2AX and SiR-labelled DNA as indicated. Yellow lines: line profiles (shown below). For the latter, fluorescence intensities were normalized to the min–max range of values of each profile. Lines were smoothed by a 5-window running median. (e) Chromocentres decondensation after major satellite-targeted Cas9, assessed as mean chromocentre circularity in transfected (n=9) and untransfected (n=10) cells. For each cell, the circularity of chromocentres (>100 px2) within the nucleus was determined as described in the ‘Methods' section, yielding shape information for 165 (transfected cells) and 148 (untransfected cells) chromocentres. Statistics: Wilcoxon rank sum test (***P<10−3). Scale bar, 2 μm.
Figure 6
Figure 6. Analysis of γH2AX nano-foci spatial clustering.
(a) Exemplary 3D-SIM images of γH2AX immunofluorescence before and during DDR. Shown are the mid-nuclear section with DAPI and γH2AX signals, and magnified view from the yellow frame. Scale bars, 2 μm and 400 nm for main micrographs and magnified regions, respectively. (b) Schematics of γH2AX 3D-clusters analysis. All centroids (red dots) within a sphere defined by a given cutoff radius (500 nm in further analysis) are included in a cluster. For all nano-foci belonging to each given cluster, the sum of the volume of single nano-foci (integrated cluster volume), the volume delimited by the centroids (inter-focal volume), the shortest path connecting all centroids as well as the mean distance between centroids (mean inter-centroid distance) are computed (Supplementary Fig. 6C–F). (c) γH2AX 3D-clusters per nucleus. One-way ANOVA with Dunnett's correction; ***P<10−3. (d) γH2AX nano-foci per 3D-clusters. Kruskal–Wallis χ2=1,926.3, df=3, P<2.2 × 10⁻¹⁶. (e) DNA content distributions of γH2AX 3D-clusters during DDR. The DNA content of each nano-focus belonging to a given cluster is summed. The dashed line depicts the distribution of γH2AX 3D-clusters before IR. Kruskal–Wallis χ2=5,964.1, df=3, P<2.2 × 10⁻¹⁶. Statistics are presented as in Fig. 2. All boxes and whiskers are as in Fig. 1. n: number of analysed cells (c) or 3D-clusters (d).
Figure 7
Figure 7. Single phospho-Ku70- or TUNEL-labelled DNA DSBs are embedded in γH2AX clusters.
(a) Exemplary 3D-SIM images of γH2AX and phospho-ku70 immunofluorescence before and during DDR. Shown are the mid-nuclear section (top) and enlarged views from the yellow frames (bottom). (b) 3D rendering of γH2AX and phospho-Ku70 immunostaining, 24 h after IR. (c) Phospho-Ku70 foci number distributions before and during DDR, from 3D-SIM images (one-way ANOVA with Dunnett's correction: P<10−3). Scatter plots of phospho-Ku70 foci and γH2AX nano-foci (d) or γH2AX clusters (e). Each dot represents a single-cell nucleus. (f) Exemplary 3D-SIM images of γH2AX and TUNEL immunofluorescence before and during DDR. Shown are the mid-nuclear section (top) and enlarged views from the yellow frames (bottom). (g) 3D rendering of γH2AX and TUNEL immunostaining, 24 h after IR. (h) TUNEL foci number distributions before and during DDR, from 3D-SIM images (one-way ANOVA with Dunnett's correction: P<10−3). Comparison between TUNEL and phospho-Ku70 (i) or γH2AX clusters (j) distributions, before and during DDR (P<10−3). Scale bars, 5 μm and 500 nm for main micrographs and magnified regions, respectively. All boxes and whiskers are as in Fig. 1. n: number of analysed cells. Results are from two independent experiments.
Figure 8
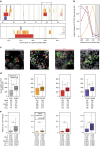
Figure 8. Genomic and microscopic analysis of CTCF spatial distribution in γH2AX-decorated chromatin.
(a) Genomic localization of γH2AX ChIP-Seq domains (coloured bars) and CTCF genomic footprint (dashed green lines) in a representative region of chromosome 16. Dashed black line: magnification. Coloured arrowheads: orientation of CTCF-binding sites (red: forward; green: reverse). Details about γH2AX ChIP-Seq domains are in Supplementary Methods and Supplementary Fig. 4. ChIP-Seq CTCF profiles were retrieved from publicly available databases (UCSC Accession: Encode wgEH000080, wgEH000543, wgEH000401 and wgEH000470). (b) CTCF occupancy outside or inside γH2AX ChIP-Seq domains. The intensity of each CTCF peak in 100 kb bins upstream and downstream of the border of γH2AX ChIP-Seq domains (grey box) is summed and then presented as one-sided distribution. The bins range from ±300 to ±200, ±200 to ±100, ±100 to 0 and 0 to ±100 kb (inside the domain), with 0 being the border of each domain. AU: arbitrary unit. Genome-wide CTCF footprint localization relative to γH2AX ChIP-Seq domains' borders. For each domain, the distance in kb between its boundaries and the closest CTCF peak is measured and plotted as a bar (dashed lines). (c) Representative 3D-SIM images of immuno-stained γH2AX and CTCF before and during DDR. Scale bar, 500 nm. (d) Quantification of the closest centroid-to-centroid distance between CTCF and γH2AX nano-foci from 3D-SIM images. Measured (filled boxes) and simulated (patterned boxes) distances are shown. The latter were obtained from simulated random distributions of CTCF and γH2AX nano-foci (100 iterations). (e) Quantification of maximum CTCF intensity in γH2AX nano-foci and in surrounding shells. Maximum CTCF fluorescence in the segmented space normalized over the maximum CTCF fluorescence of the entire nucleus is plotted. All boxes and whiskers are as in Fig. 1. n: measured distances (d) or analysed shells (e) from two independent experiments. d,e: Mann–Whitney test: P<10−3.
Figure 9
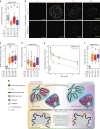
Figure 9. CTCF depletion inhibits γH2AX nano-foci and cluster formation and diminishes the DNA repair capability.
(a) Number of CTCF foci in esiRNA-depleted cells before and during DDR. Black dots: median number of CTCF foci in wild-type cells. (b) Impairment of γH2AX nano-foci and 3D-clusters formation during DDR as assessed by immunofluorescence of 3D-SIM images in CTCF-depleted cells. Scale bar, 5 μm. (c) γH2AX nano-foci number distributions before and after IR, in CTCF siRNA-treated cells. Black dots: median number of γH2AX nano-foci of untreated cells (from Fig. 1).NS: two-tailed t-test, P>0.05. (d) γH2AX nano-foci DNA content distributions before and after IR, in CTCF siRNA-treated cells. Black dots: median DNA content of γH2AX nano-foci of untreated cells (from Fig. 2). (e) DNA fragmentation measured by the neutral comet assay. Boxes represent the mean of medians from four replicates (two biological replicates in duplicate), each consisting of 60 comet measurements. NS: not significant (t-test, P>0.05). (f) γH2AX cluster distributions before and after IR, in CTCF siRNA-treated cells. Black dots: median number of γH2AX clusters in untreated cells (from Fig. 6). All boxes and whiskers are as in Fig. 1. Comparisons between time points (one-way ANOVA with Dunnett's correction) or between esiRNA-treated and wild-type cells (Wilcoxon/Mann–Whitney rank sum) are all statistically significant unless otherwise specified. (g) Model for cluster special arrangement during DDR, showing the time-dependent euchromatin-to-heterochromatin repair trend (top) and how γH2AX spreading is hampered by CTCF depletion with the concomitant loss of 3D-arrangement of chromatin loops (bottom).

Similar articles

Cited by

References

    1. Rogakou E. P., Pilch D. R., Orr A. H., Ivanova V. S. & Bonner W. M. DNA double-stranded breaks induce histone H2AX phosphorylation on serine 139. J. Biol. Chem. 273, 5858–5868 (1998). - PubMed
    1. Stucki M. & Jackson S. P. GammaH2AX and MDC1: anchoring the DNA-damage-response machinery to broken chromosomes. DNA Repair 5, 534–543 (2006). - PubMed
    1. Bartkova J. et al.. DNA damage response as a candidate anti-cancer barrier in early human tumorigenesis. Nature 434, 864–870 (2005). - PubMed
    1. Gorgoulis V. G. et al.. Activation of the DNA damage checkpoint and genomic instability in human precancerous lesions. Nature 434, 907–913 (2005). - PubMed
    1. Turinetto V. & Giachino C. Multiple facets of histone variant H2AX: a DNA double-strand-break marker with several biological functions. Nucleic Acids Res. 43, 2489–2498 (2015). - PMC - PubMed

Publication types