SIRT1 ameliorates oxidative stress induced neural cell death and is down-regulated in Parkinson's disease
- PMID: 28578695
- PMCID: PMC5455114
- DOI: 10.1186/s12868-017-0364-1
SIRT1 ameliorates oxidative stress induced neural cell death and is down-regulated in Parkinson's disease
Abstract
Background: Sirtuins (SIRTs) are NAD+ dependent lysine deacetylases which are conserved from bacteria to humans and have been associated with longevity and lifespan extension. SIRT1, the best studied mammalian SIRT is involved in many physiological and pathological processes and changes in SIRT1 have been implicated in neurodegenerative disorders, with SIRT1 having a suggested protective role in Parkinson's disease. In this study, we determined the effect of SIRT1 on cell survival and α-synuclein aggregate formation in SH-SY5Y cells following oxidative stress.
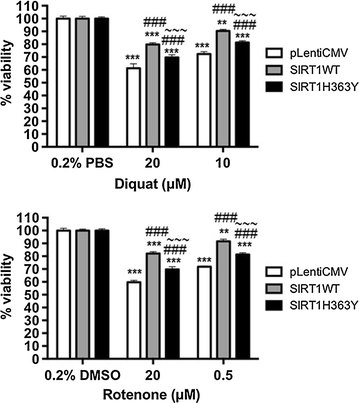
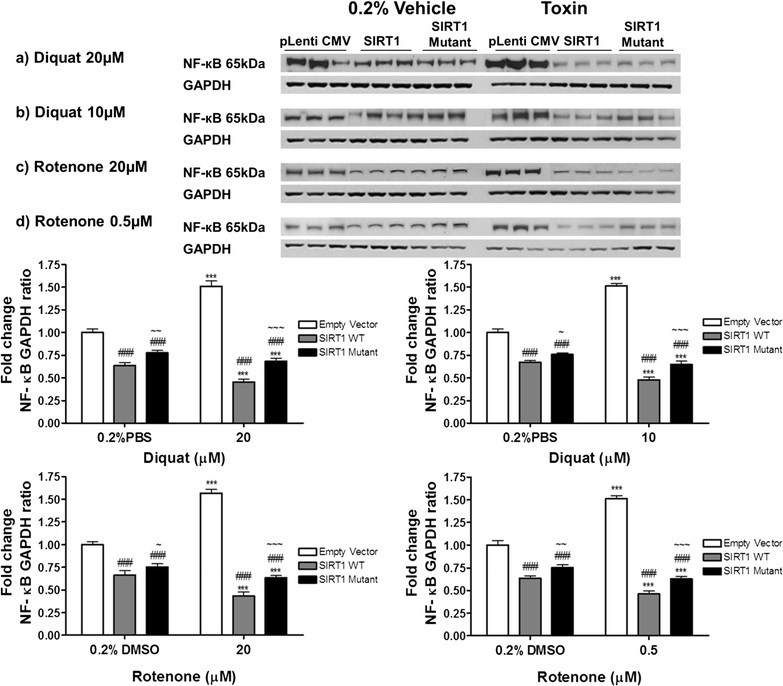
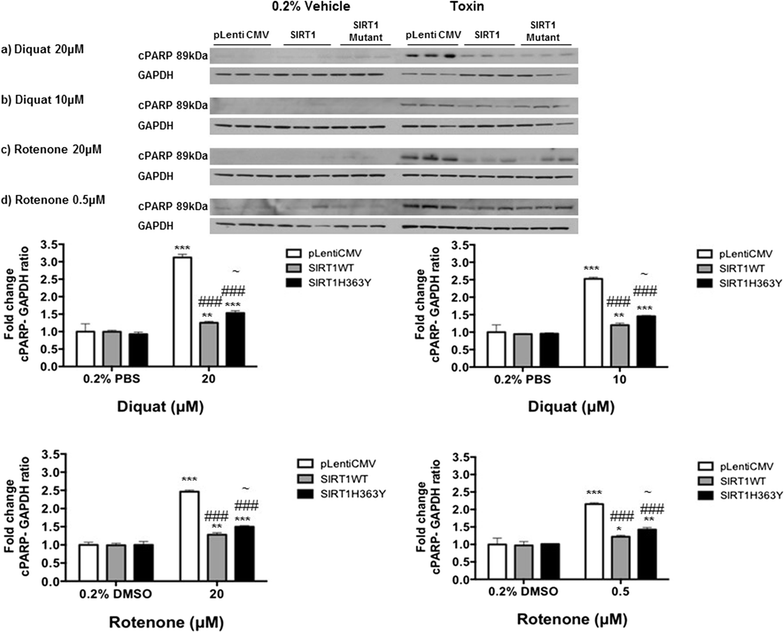
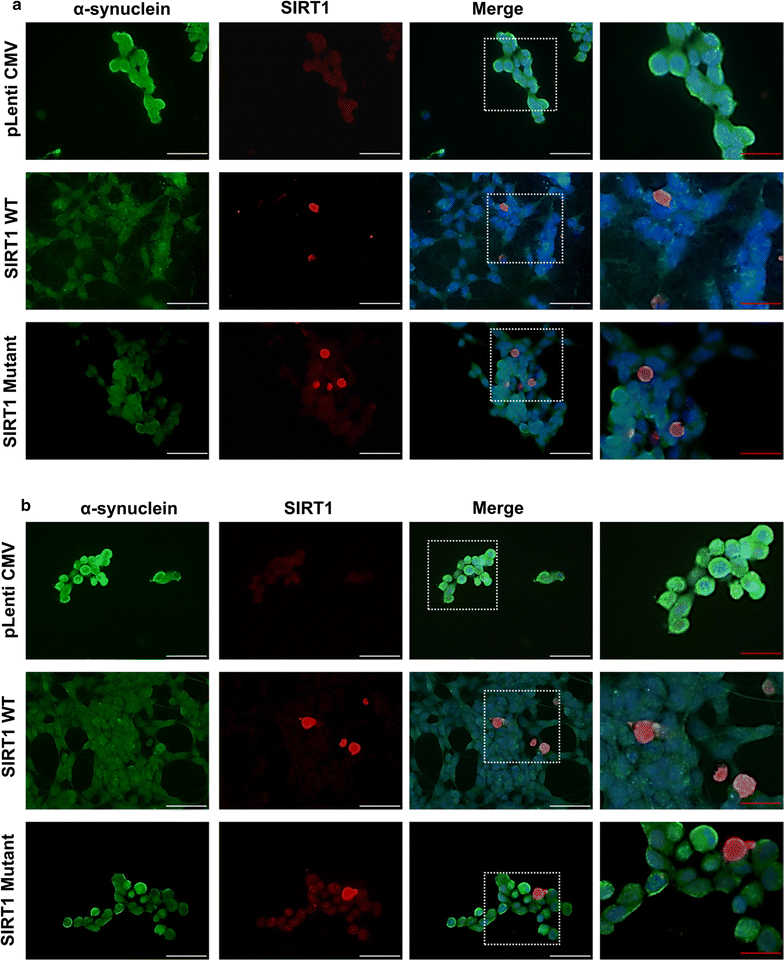
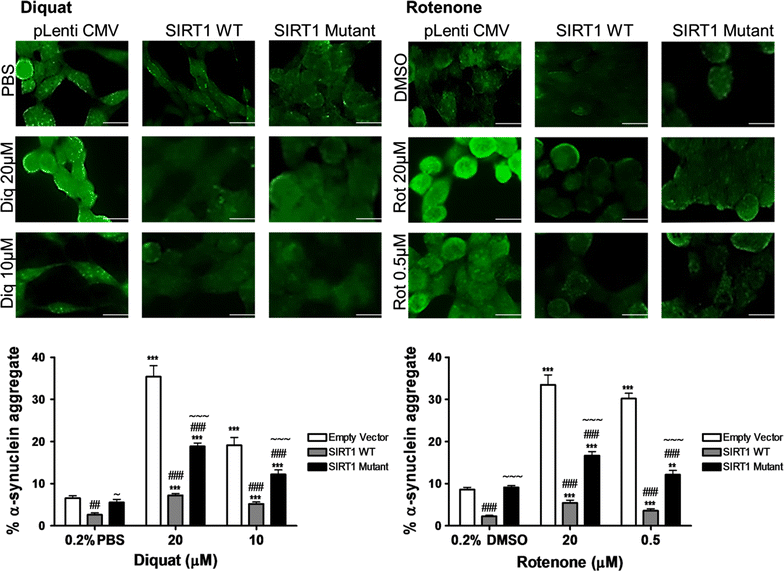
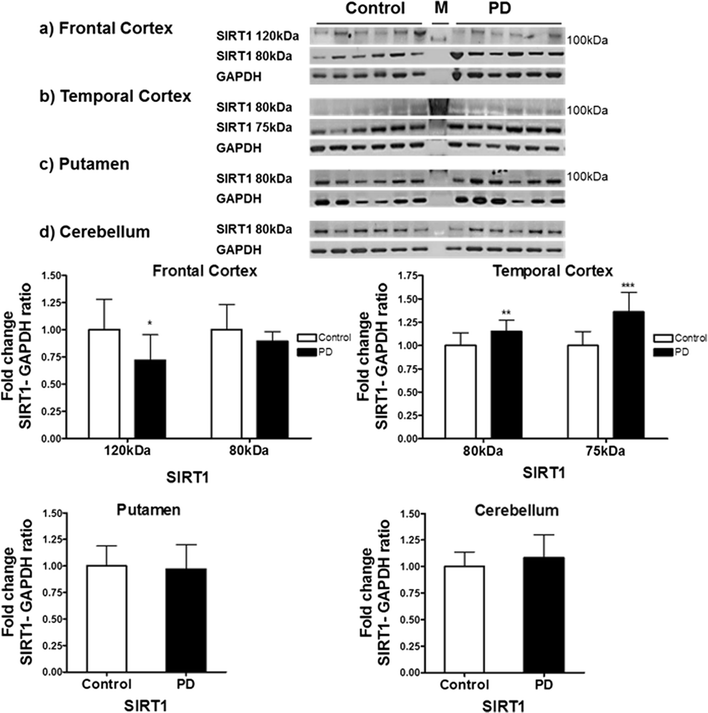
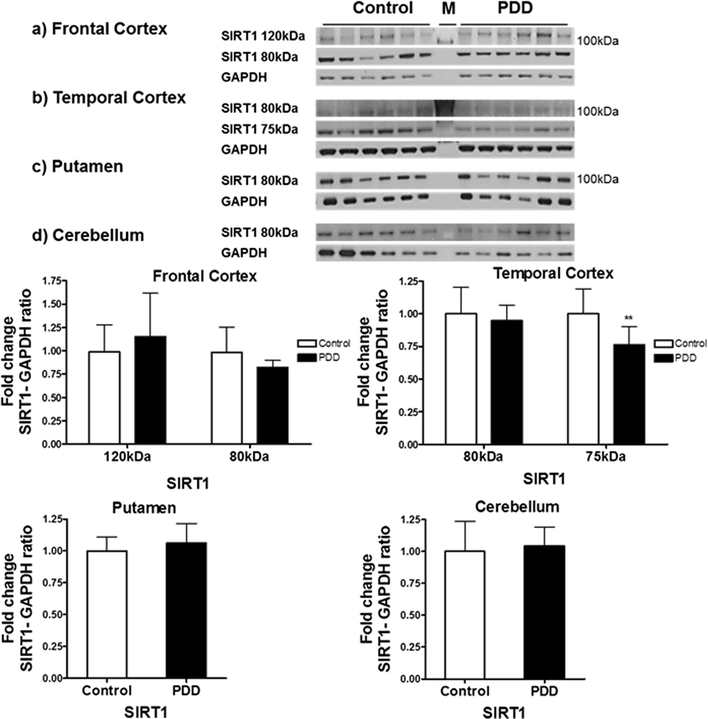
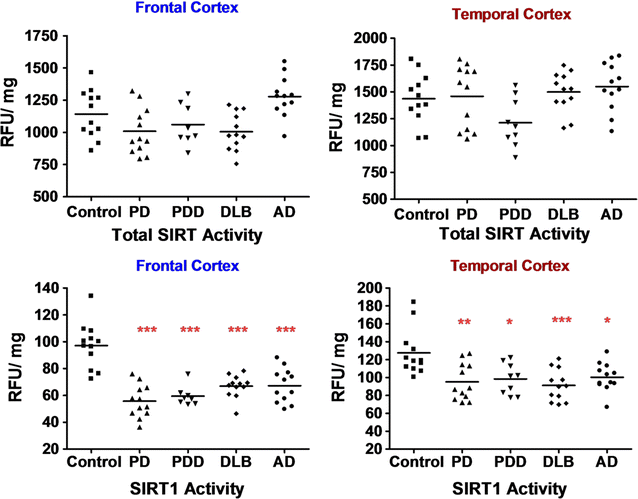
Results: Over-expression of SIRT1 protected SH-SY5Y cells from toxin induced cell death and the protection conferred by SIRT1 was partially independent of its deacetylase activity, which was associated with the repression of NF-кB and cPARP expression. SIRT1 reduced the formation of α-synuclein aggregates but showed minimal co-localisation with α-synuclein. In post-mortem brain tissue obtained from patients with Parkinson's disease, Parkinson's disease with dementia, dementia with Lewy bodies and Alzheimer's disease, the activity of SIRT1 was observed to be down-regulated.
Conclusions: These findings suggests a negative effect of oxidative stress in neurodegenerative disorders and possibly explain the reduced activity of SIRT1 in neurodegenerative disorders. Our study shows that SIRT1 is a pro-survival protein that is downregulated under cellular stress.
Keywords: Alpha-synuclein; Cell survival; Oxidative stress; Parkinson’s disease; SIRT1.
Figures
Similar articles
-
The Beneficial Role of Sirtuin 1 in Preventive or Therapeutic Options of Neurodegenerative Diseases.Neuroscience. 2022 Nov 10;504:79-92. doi: 10.1016/j.neuroscience.2022.09.021. Epub 2022 Oct 3. Neuroscience. 2022. PMID: 36202276 Review.
-
Chlorpyrifos activates cell pyroptosis and increases susceptibility on oxidative stress-induced toxicity by miR-181/SIRT1/PGC-1α/Nrf2 signaling pathway in human neuroblastoma SH-SY5Y cells: Implication for association between chlorpyrifos and Parkinson's disease.Environ Toxicol. 2019 Jun;34(6):699-707. doi: 10.1002/tox.22736. Epub 2019 Mar 5. Environ Toxicol. 2019. PMID: 30835941
-
The SIRT1 activator resveratrol protects SK-N-BE cells from oxidative stress and against toxicity caused by alpha-synuclein or amyloid-beta (1-42) peptide.J Neurochem. 2009 Sep;110(5):1445-56. doi: 10.1111/j.1471-4159.2009.06228.x. Epub 2009 Jun 22. J Neurochem. 2009. PMID: 19558452
-
Cdk5 suppression blocks SIRT1 degradation via the ubiquitin-proteasome pathway in Parkinson's disease models.Biochim Biophys Acta Gen Subj. 2018 Jun;1862(6):1443-1451. doi: 10.1016/j.bbagen.2018.03.021. Epub 2018 Mar 21. Biochim Biophys Acta Gen Subj. 2018. PMID: 29571747
-
SIRT1: new avenues of discovery for disorders of oxidative stress.Expert Opin Ther Targets. 2012 Feb;16(2):167-78. doi: 10.1517/14728222.2012.648926. Epub 2012 Jan 10. Expert Opin Ther Targets. 2012. PMID: 22233091 Free PMC article. Review.
Cited by
-
Reduced serum SIRT1 levels in patients with Parkinson's disease: a cross-sectional study in China.Neurol Sci. 2021 May;42(5):1835-1841. doi: 10.1007/s10072-020-04711-z. Epub 2020 Sep 9. Neurol Sci. 2021. PMID: 32909152
-
Piceid Octanoate Protects Retinal Cells against Oxidative Damage by Regulating the Sirtuin 1/Poly-ADP-Ribose Polymerase 1 Axis In Vitro and in rd10 Mice.Antioxidants (Basel). 2024 Feb 4;13(2):201. doi: 10.3390/antiox13020201. Antioxidants (Basel). 2024. PMID: 38397799 Free PMC article.
-
MicroRNA expression analysis identifies a subset of downregulated miRNAs in ALS motor neuron progenitors.Sci Rep. 2018 Jul 4;8(1):10105. doi: 10.1038/s41598-018-28366-1. Sci Rep. 2018. PMID: 29973608 Free PMC article.
-
Regulation of PGC-1α mediated by acetylation and phosphorylation in MPP+ induced cell model of Parkinson's disease.Aging (Albany NY). 2020 May 26;12(10):9461-9474. doi: 10.18632/aging.103219. Epub 2020 May 26. Aging (Albany NY). 2020. PMID: 32452827 Free PMC article.
-
The Interplay between Intracellular Iron Homeostasis and Neuroinflammation in Neurodegenerative Diseases.Antioxidants (Basel). 2023 Apr 12;12(4):918. doi: 10.3390/antiox12040918. Antioxidants (Basel). 2023. PMID: 37107292 Free PMC article. Review.
References
Publication types
MeSH terms
Substances
Grants and funding
LinkOut - more resources
Full Text Sources
Other Literature Sources
Medical
Research Materials

