. 2017 Jul;24(7):1288-1302.
doi: 10.1038/cdd.2017.80. Epub 2017 Jun 2.

Signalome-wide RNAi screen identifies GBA1 as a positive mediator of autophagic cell death

Affiliations

Signalome-wide RNAi screen identifies GBA1 as a positive mediator of autophagic cell death

Santosh K Dasari et al. Cell Death Differ. 2017 Jul.

Abstract

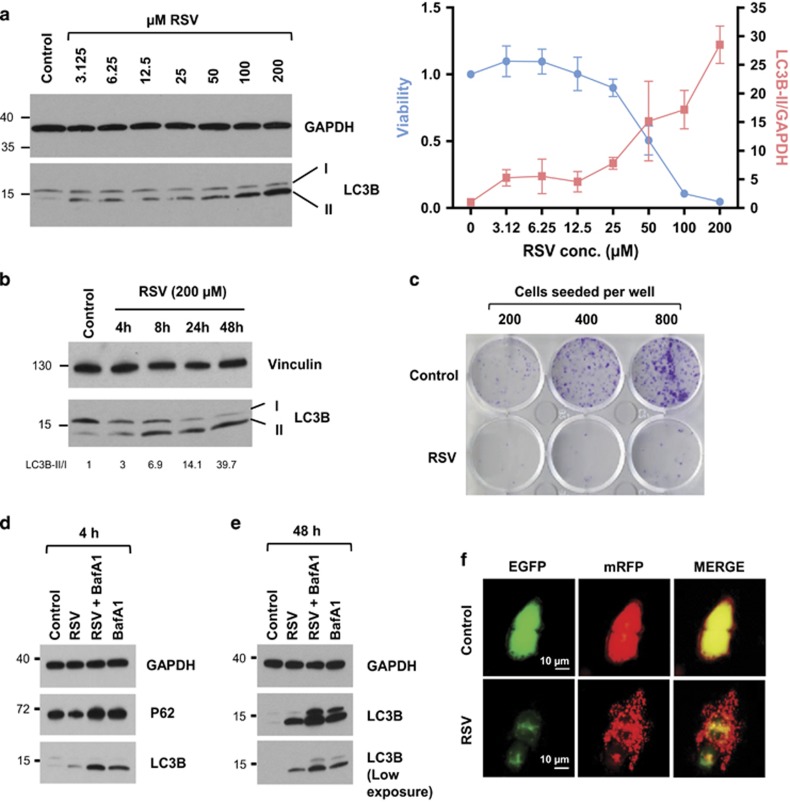
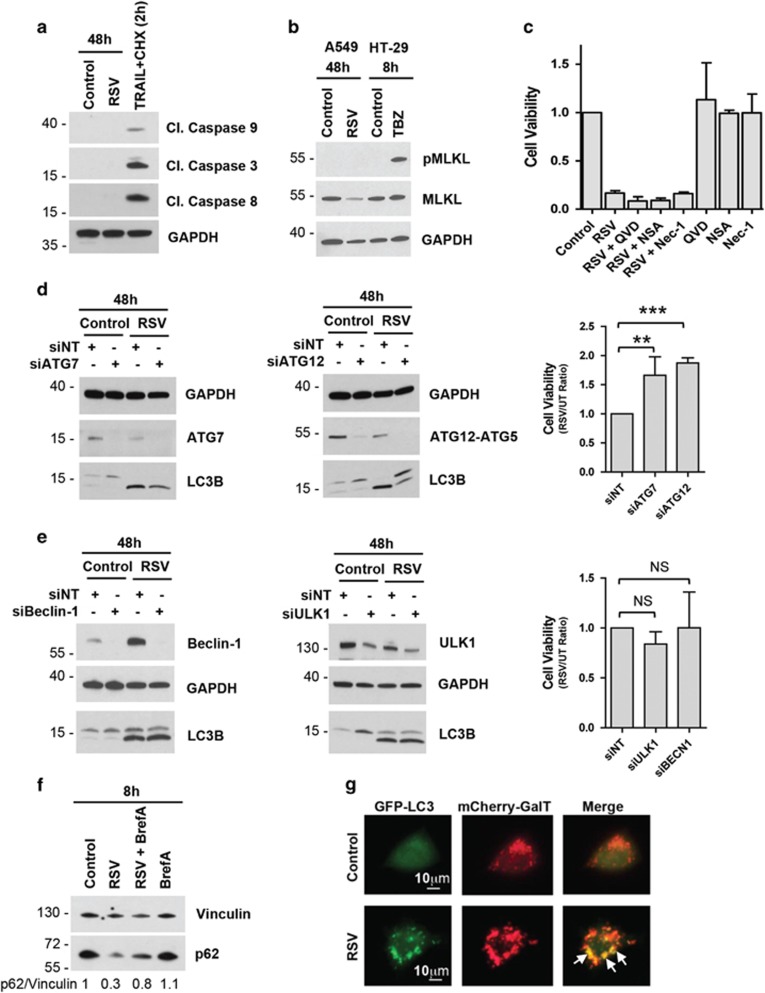
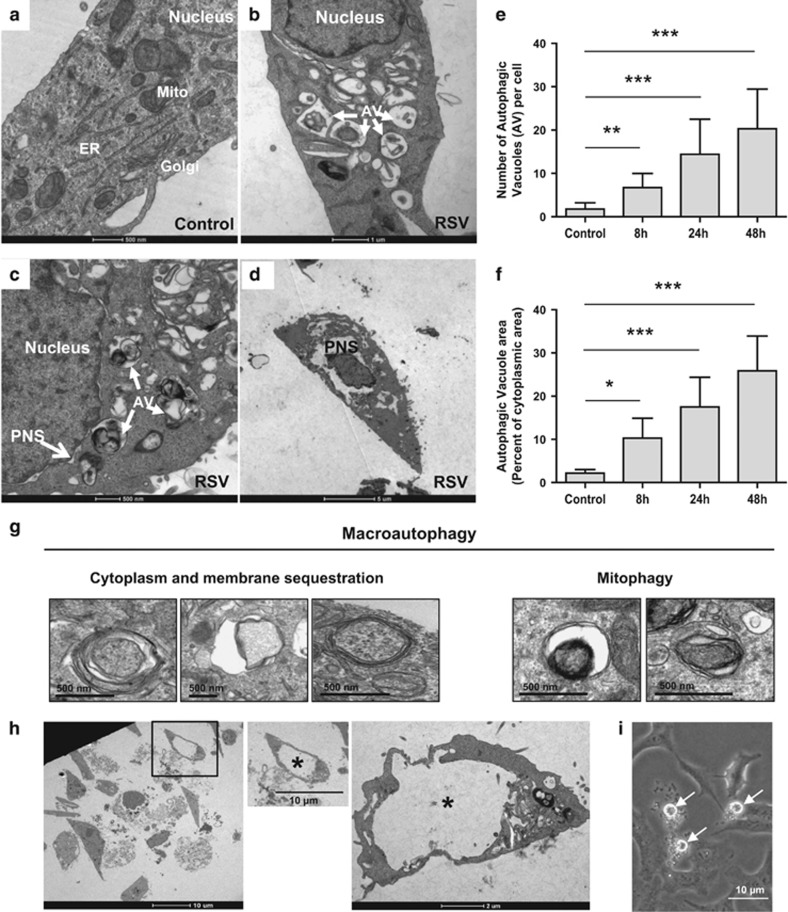
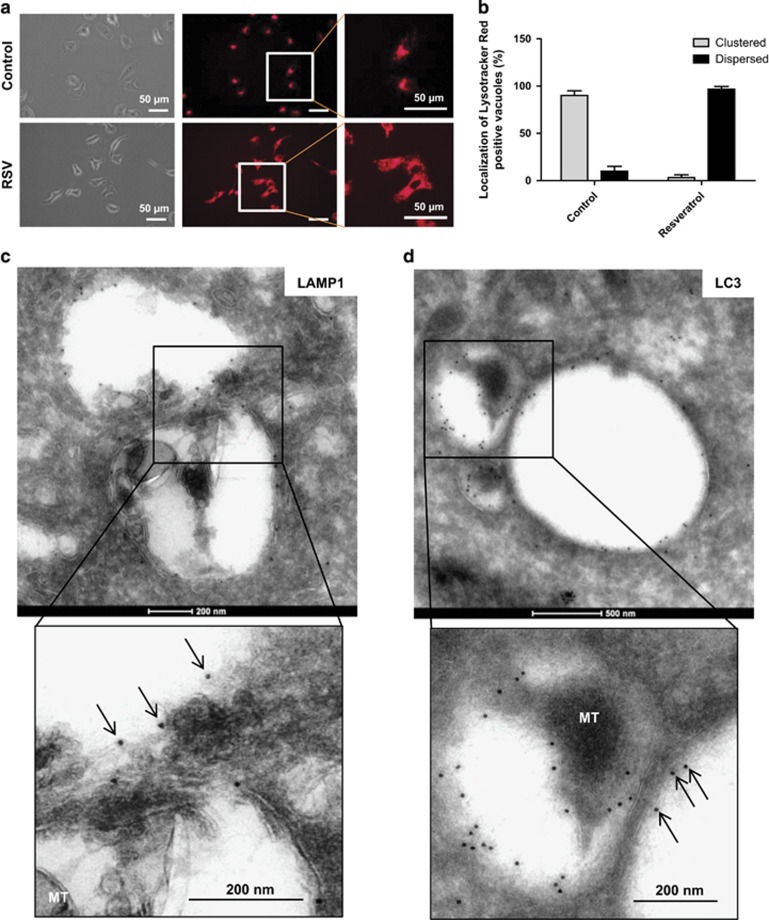
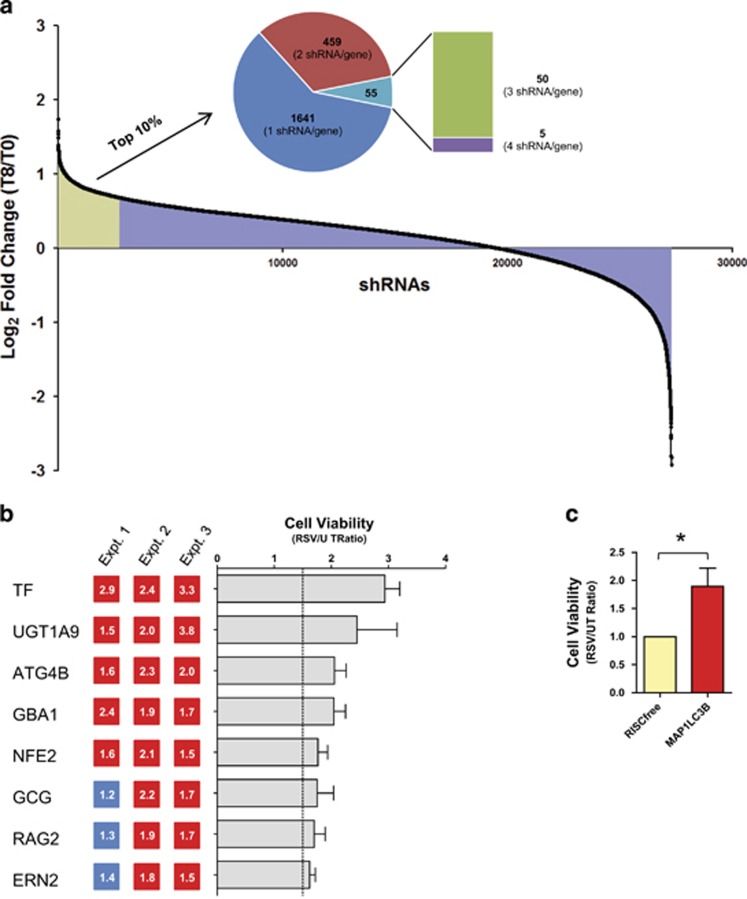
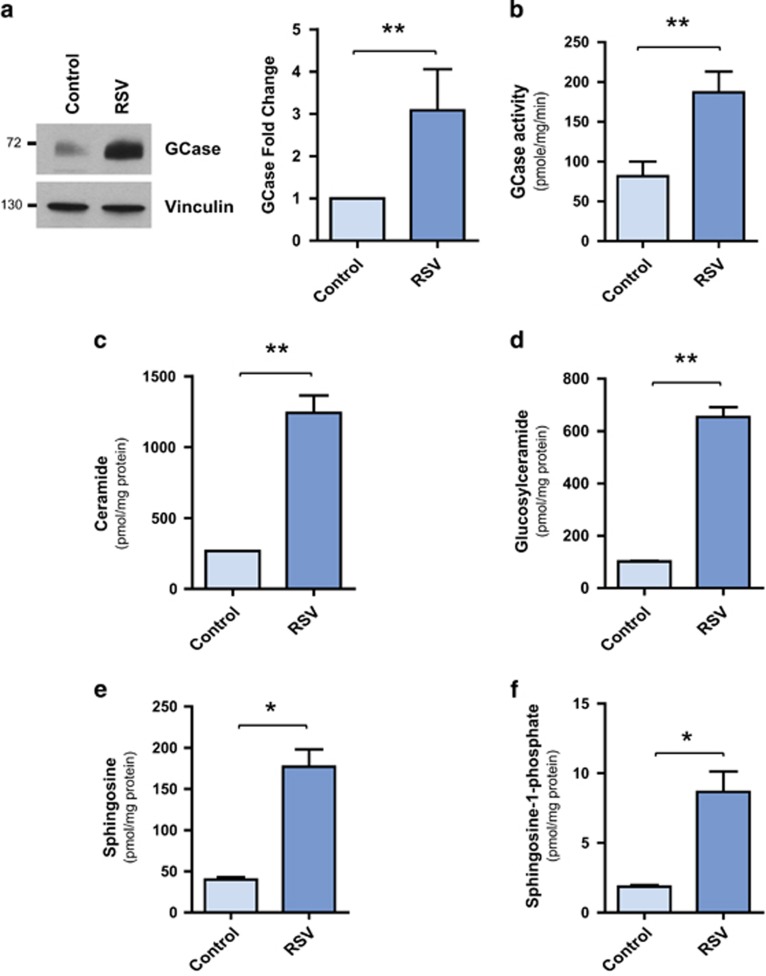
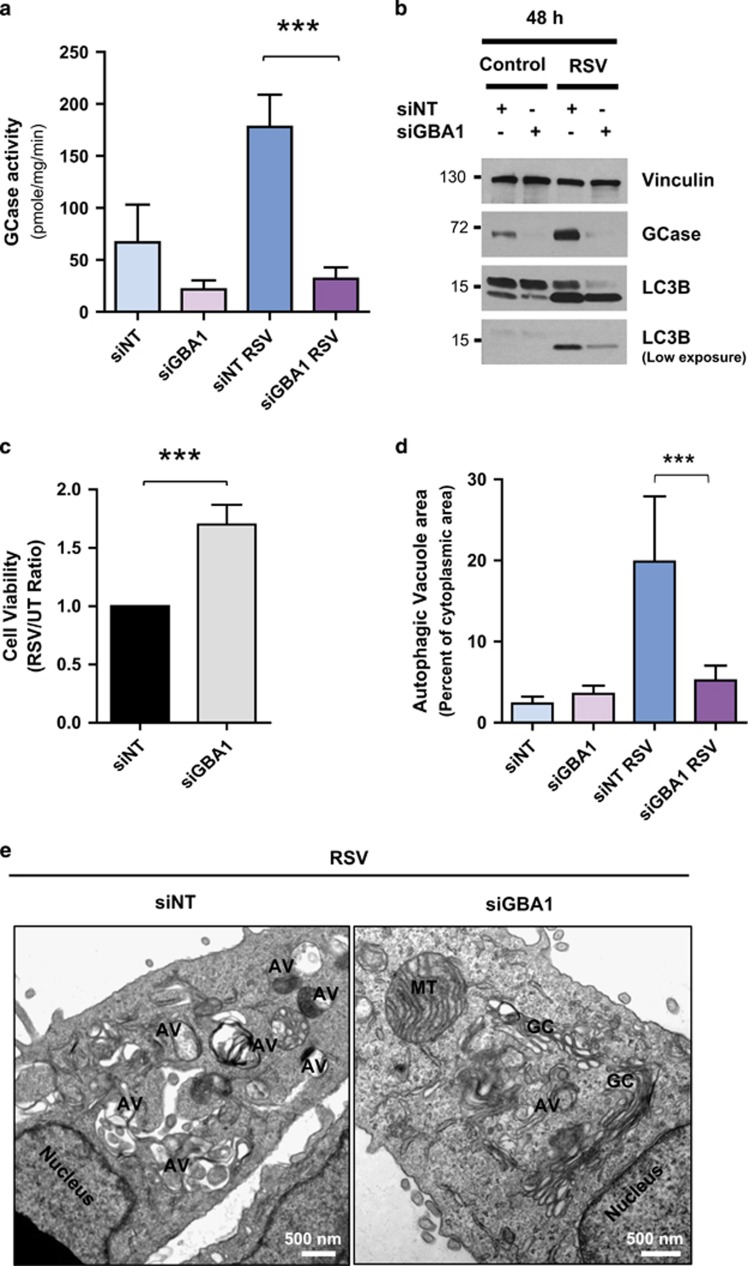
Activating alternative cell death pathways, including autophagic cell death, is a promising direction to overcome the apoptosis resistance observed in various cancers. Yet, whether autophagy acts as a death mechanism by over consumption of intracellular components is still controversial and remains undefined at the ultrastructural and the mechanistic levels. Here we identified conditions under which resveratrol-treated A549 lung cancer cells die by a mechanism that fulfills the previous definition of autophagic cell death. The cells displayed a strong and sustained induction of autophagic flux, cell death was prevented by knocking down autophagic genes and death occurred in the absence of apoptotic or necroptotic pathway activation. Detailed ultrastructural characterization revealed additional critical events, including a continuous increase over time in the number of autophagic vacuoles, in particular autolysosomes, occupying most of the cytoplasm at terminal stages. This was followed by loss of organelles, disruption of intracellular membranes including the swelling of perinuclear space and, occasionally, a unique type of nuclear shedding. A signalome-wide shRNA-based viability screen was applied to identify positive mediators of this type of autophagic cell death. One top hit was GBA1, the Gaucher disease-associated gene, which encodes glucocerebrosidase, an enzyme that metabolizes glucosylceramide to ceramide and glucose. Interestingly, glucocerebrosidase expression levels and activity were elevated, concomitantly with increased intracellular ceramide levels, both of which correlated in time with the appearance of the unique death characteristics. Transfection with siGBA1 attenuated the increase in glucocerebrosidase activity and the intracellular ceramide levels. Most importantly, GBA1 knockdown prevented the strong increase in LC3 lipidation, and many of the ultrastructural changes characteristic of this type of autophagic cell death, including a significant decrease in cytoplasmic area occupied by autophagic vacuoles. Together, these findings highlight the critical role of GBA1 in mediating enhanced self-consumption of intracellular components and endomembranes, leading to autophagic cell death.


Conflict of interest statement

The authors declare no conflict of interest.

Figures

Figure 1
Figure 1
RSV induces autophagic cell death. (a) A549 cells were treated with different concentrations of RSV for 48 h. Cell lysates were subjected to western blotting analysis of LC3B and GAPDH as loading control. Graph shows inverse correlation between RSV-induced LC3 lipidation (Red) and cell viability (blue), determined by CellTiter-Glo assay. Data represent mean±S.D. of three replicate experiments. (b) A549 cells treated with 200 μM RSV for 4, 8, 24 and 48 h were subjected to western blotting analysis with LC3B and GAPDH. (c) Representative images of clonogenic assay of A549 cells treated with 200 μM RSV for 48 h followed by growth for additional 7–10 days. (d and e) Cells were treated with 200 μM RSV for 4 h (d) or 48 h (e) in the absence and presence of 100 or 5 nM BafA1, respectively, and western blotted for LC3B, p62 and GAPDH. (f) Representative images of A549 cells transfected with tandem RFP-GFP-LC3 and treated with or without RSV (200 μM, 24 h). Scale bar, 10 μm
Figure 2
Figure 2
RSV induces apoptosis- and necroptosis-independent cell death. (a and b) Immunoblot analysis of apoptotic (a) and necroptotic (b) markers in RSV (200 μM; 48 h) treated A549 cells. A549 cells treated with 100 ng/ml TRAIL and 20 μg/ml cycloheximide (CHX) for 2 h were used as a positive control for apoptosis, and HT29 cells treated with 100 ng/ml TNF, 1 μM IAP antgonist BV6 and 20 μM Z-VAD (TBZ) for 8 h served as a positive control for necroptosis. Cleaved caspase-3 blot was reprobed with caspase-8 antibody. Phosphorylated MLKL (pMLKL) blot was reprobed with total MLKL antibody. (c) A549 cells treated with RSV (200 μM; 48 h) in the presence and absence of pan-caspase inhibitor Q-VD (10 μM), MLKL inhibitor NSA (10 μM) or RIPK1 inhibitor necrostatin-1 (Nec-1, 10 μM) were assessed for cell viability using CellTiter-Glo assay. Data represents mean±S.D. of three replicate experiments. (d) A549 cells transfected with either ATG7 or ATG12 siRNAs were treated with RSV (200 μM; 48 h) and subjected to western blotting analysis for LC3B lipidation. Cell viability was assessed using CellTiter-Glo assay and represented as fold-change in RSV-treated cells compared with untreated cells. Data represents mean±S.D. of four replicate experiments; statistical significance was assessed using one-way analysis of variance (ANOVA) followed by Tukey’s post hoc test, **P<0.01; ***P<0.001. (e) A549 cells transfected with either Beclin 1 or ULK-1 siRNAs were treated with RSV (200 μM; 48 h) and subjected to western blotting analysis for LC3B lipidation. Cell viability was assessed using CellTiter-Glo and represented as a ratio of ATP levels in RSV-treated cells versus untreated cells. Data represent mean±S.D. of three independent experiments, statistical significance was assessed using one-way ANOVA followed by Tukey’s post hoc test; NS: non-significant. (f) A549 cells were treated with RSV (200 μM; 8 h) in the absence or presence of Brefeldin A and subjected to western blotting. Shown is a representative immunoblot of p62 degradation. (g) GFP-LC3 and mCherry-GalT expressing A549 cells treated with RSV (200 μM; 24 h) were processed to determine colocalization between GFP-LC3-positive and mCherry-GalT-positive puncta. Arrows point to regions of Golgi showing colocalization with GFP-LC3 puncta in RSV-treated cells
Figure 3
Figure 3
Ultrastructural features of RSV-induced autophagic cell death. A549 cells were treated with 200 μM RSV for 48 h and viewed by TEM. (a) Control cells with normal ultrastructure. (bd) Representative RSV-treated cells showing increased number of AVs, defective mitochondria (b) and increased perinuclear space (PNS, c and d). (e and f) Quantitation of AV number per cell (n=30–50 cells) and the percentage of cytoplasmic area covered by AVs (n=10 cells) for control and RSV-treated cells (200 μM for 8, 24 and 48 h). Data represent mean±S.D. of three replicate experiments; statistical significance was assessed using one-way analysis of variance followed by Tukey’s post hoc test, *P<0.05; **P<0.01; ***P<0.001. (g) Representative images of AVs harboring partially degraded mitochondria, cytoplasmic material and subcellular membranes. (h) Representative images of enucleated cells observed in RSV-induced autophagic cell death. Asterisk denotes cellular area previously occupied by nucleus. (i) Representative image of floating nuclei (indicated by arrows) surrounded by cellular debris attached to the plate
Figure 4
Figure 4
RSV enhances autolysosomal numbers. (a) Control and RSV (200 μM, 24 h) treated A549 cells were stained with Lysotracker Red and visualized by light (left panels) and fluorescent microscopy. Panel on right is magnification of boxed region in the middle panel. (b) Quantitative representation of percentage of cells showing perinuclear clustering or dispersed Lysotracker Red staining in the absence or presence of RSV for 24 h. Values are expressed as mean±S.D. of three experiments, with >200 cells counted per experiment. (c and d) Immunogold labeling for LAMP1-GFP (c) and mRFP-EGFP-LC3 (d) in 24 h RSV-treated A549 cells. Panels shown on bottom are magnifications of boxed areas shown on top. Arrows indicate gold particles associated with the membrane of empty vacuoles. MT, mitochondria
Figure 5
Figure 5
RNAi-mediated screen for modulators of autophagic cell death. (a) Graphical representation of pooled Lentiviral shRNA-based primary screen results, ranked from most enriched to most depleted. The y axis represents the average log2 fold-change (T8/T0) value from two replicate screens. Pie chart represents top 10% significant hits obtained from the pooled shRNA screen. In total, 55 genes with ≥3 shRNA hits overrepresented in T8 sample compared with T0 sample were taken for further analysis. (b) Custom cherry-picked siRNA library plates (96 well) prepared from high-ranking hits were reverse transfected and 48 h later, treated with RSV for another 48 h. Cell viability was measured with CellTiter-Glo, and the fold changes were normalized to RISC-free siRNA-transfected wells. Shown are the KDs resulting in at least 50% cell death rescue (demarcated by dotted line). Values are the mean±S.E.M. of three independent experiments; results of individual experiments are shown at left. KD conditions showing >50% rescue are indicated in red, whereas siRNA KD showing <50% rescue are indicated in blue. (c) Graph comparing extent rescue in cell viability of the positive control MAP1LC3B to negative control. Data represent fold-change as mean±S.E.M. of three replicate experiments. Statistical significance determined by two-tailed unpaired Student’s t-test, *P<0.05
Figure 6
Figure 6
RSV induces autophagic cell death through GCase-regulated sphingolipid metabolism. (a) Western blotting of GCase in untreated and RSV (200 μM; 48 h) treated A549 cells (left) and quantitation by densitometry of GCase levels represented as mean±S.D. of four independent experiments, with untreated levels set at 1. (b) GCase activity measured in untreated and RSV (200 μM; 48 h) treated cells. Values are means±S.D. of three independent experiments. (cf) Lipid mass spectrometric analysis of ceramide (c), GlcCer (d), sphingosine (e) and S1P (f) from untreated and RSV (200 μM; 48 h) treated A549 cells. Panels (cf) represent mean±S.D. of two independent experiments; statistical significance determined by two-tailed unpaired Student’s t-test, *P<0.05; **P<0.01
Figure 7
Figure 7
GBA1 KD inhibits RSV-induced autophagic cell death. (a) GCase activity in siNT- and siGBA1-transfected cells treated with or without RSV (200 μM; 48 h). Data represents mean±S.D. of three replicate experiments; statistical significance was assessed using one-way analysis of variance (ANOVA) followed by Tukey’s post hoc test, ***P<0.001. (b) Western blotting of GCase and LC3 lipidation in siNT- and siGBA1-transfected cells treated with or without RSV (200 μM; 48 h). (c) Cell viability was determined by CellTiter-Glo assay after 48 h RSV treatment in siNT- and siGBA1-transfected A549 cells. Data are represented as a ratio of ATP levels in RSV-treated cells to untreated cells in siNT- and siGBA1-transfected A549 cells. Data represents mean±S.D. of six replicate experiments. Statistical significance determined by two-tailed unpaired Student’s t-test, ***P<0.0001. (d) Quantitation of total cytoplasmic area covered by AVs (n=10 cells) for siNT and siGBA1 cells untreated or treated with RSV (200 μM, 24 h). (e) Representative images of siNT and siGBA1 KD cells treated with RSV for 24 h. Data represent mean±S.D. of three replicate experiments. Statistical significance was assessed using one-way ANOVA followed by Tukey’s post hoc test, ***P<0.001
Figure 8
Figure 8
GBA1 KD changes sphingolpid levels. (ae) Lipid mass spectrometric analysis of ceramide (a), sphingosine (b), S1P (c), GlcCer (d) and different chain length ceramide species (e) in siNT- and siGBA-transfected cells treated with and without RSV (200 μM; 48 h). Data represent mean±S.D. of two replicate experiments. Statistical significance was assessed using one-way analysis of variance followed by Tukey’s post hoc test, **P<0.01

Similar articles

Cited by

References

    1. Mizushima N, Komatsu M. Autophagy: renovation of cells and tissues. Cell 2011; 147: 728–741. - PubMed
    1. Young MM, Takahashi Y, Khan O, Park S, Hori T, Yun J et al. Autophagosomal membrane serves as platform for intracellular death-inducing signaling complex (iDISC)-mediated caspase-8 activation and apoptosis. J Biol Chem 2012; 287: 12455–12468. - PMC - PubMed
    1. Laussmann MA, Passante E, Dussmann H, Rauen JA, Wurstle ML, Delgado ME et al. Proteasome inhibition can induce an autophagy-dependent apical activation of caspase-8. Cell Death Differ 2011; 18: 1584–1597. - PMC - PubMed
    1. Pyo JO, Jang MH, Kwon YK, Lee HJ, Jun JI, Woo HN et al. Essential roles of Atg5 and FADD in autophagic cell death: dissection of autophagic cell death into vacuole formation and cell death. J Biol Chem 2005; 280: 20722–20729. - PubMed
    1. Jin Z, Li Y, Pitti R, Lawrence D, Pham VC, Lill JR et al. Cullin3-based polyubiquitination and p62-dependent aggregation of caspase-8 mediate extrinsic apoptosis signaling. Cell 2009; 137: 721–735. - PubMed