. 2017 May 31:8:15637.
doi: 10.1038/ncomms15637.

WIPI3 and WIPI4 β-propellers are scaffolds for LKB1-AMPK-TSC signalling circuits in the control of autophagy

Affiliations

WIPI3 and WIPI4 β-propellers are scaffolds for LKB1-AMPK-TSC signalling circuits in the control of autophagy

Daniela Bakula et al. Nat Commun. .

Abstract

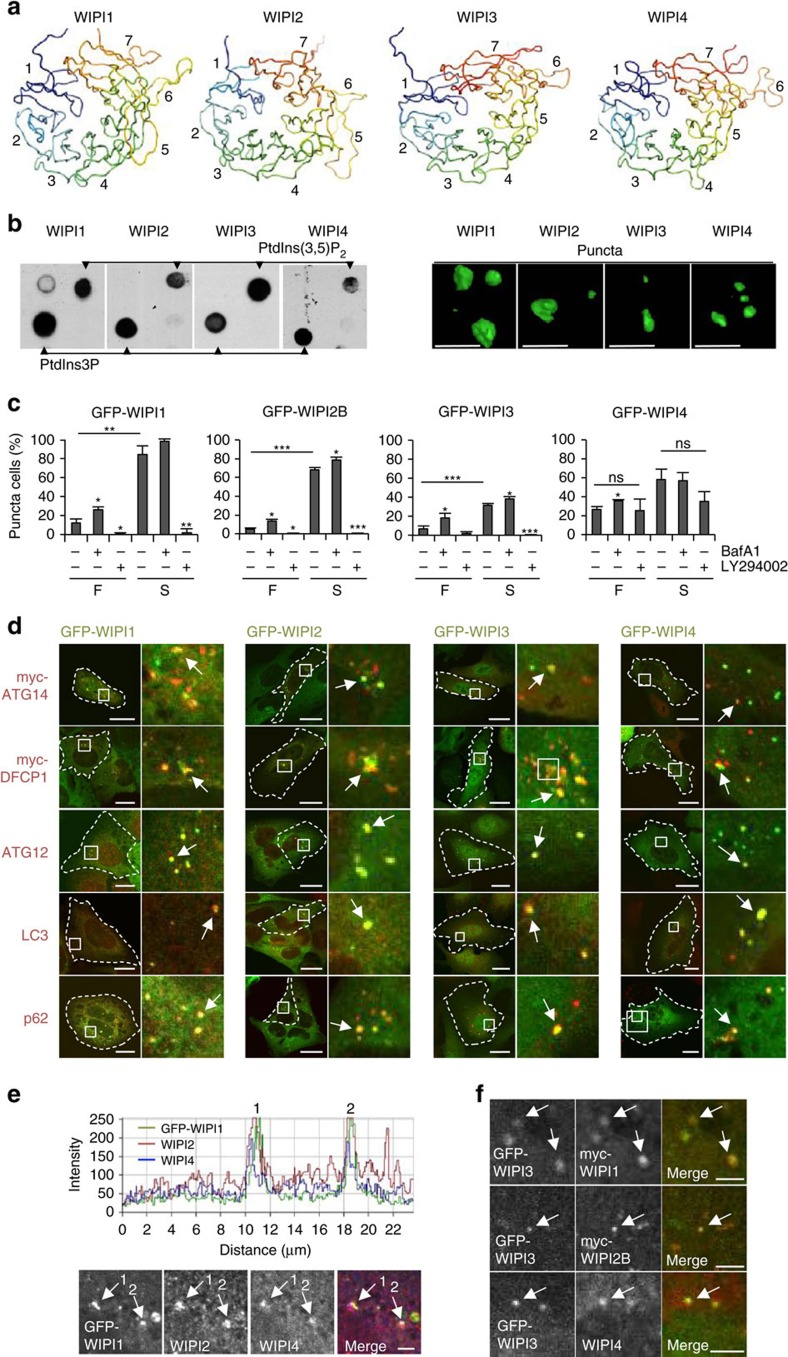
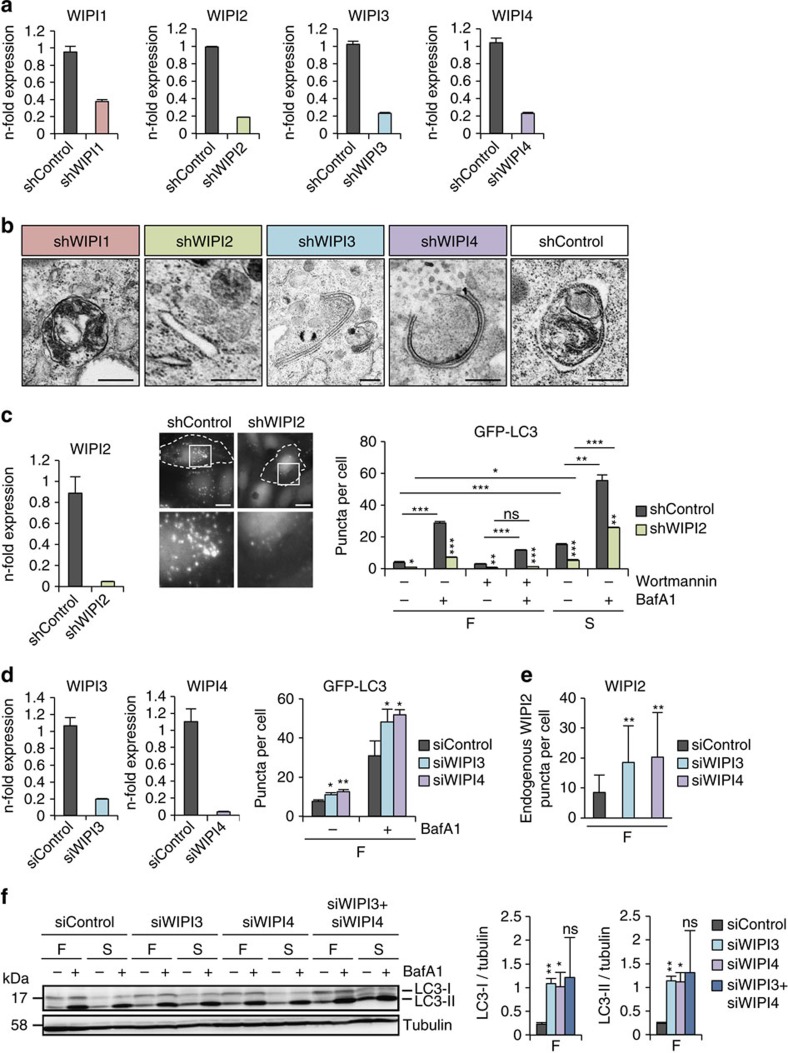
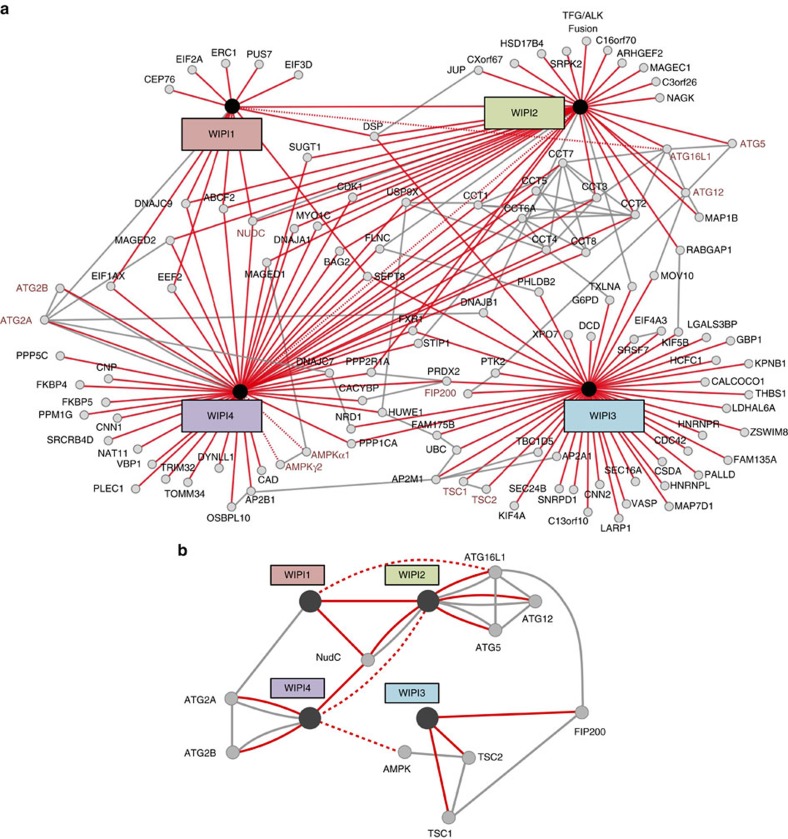
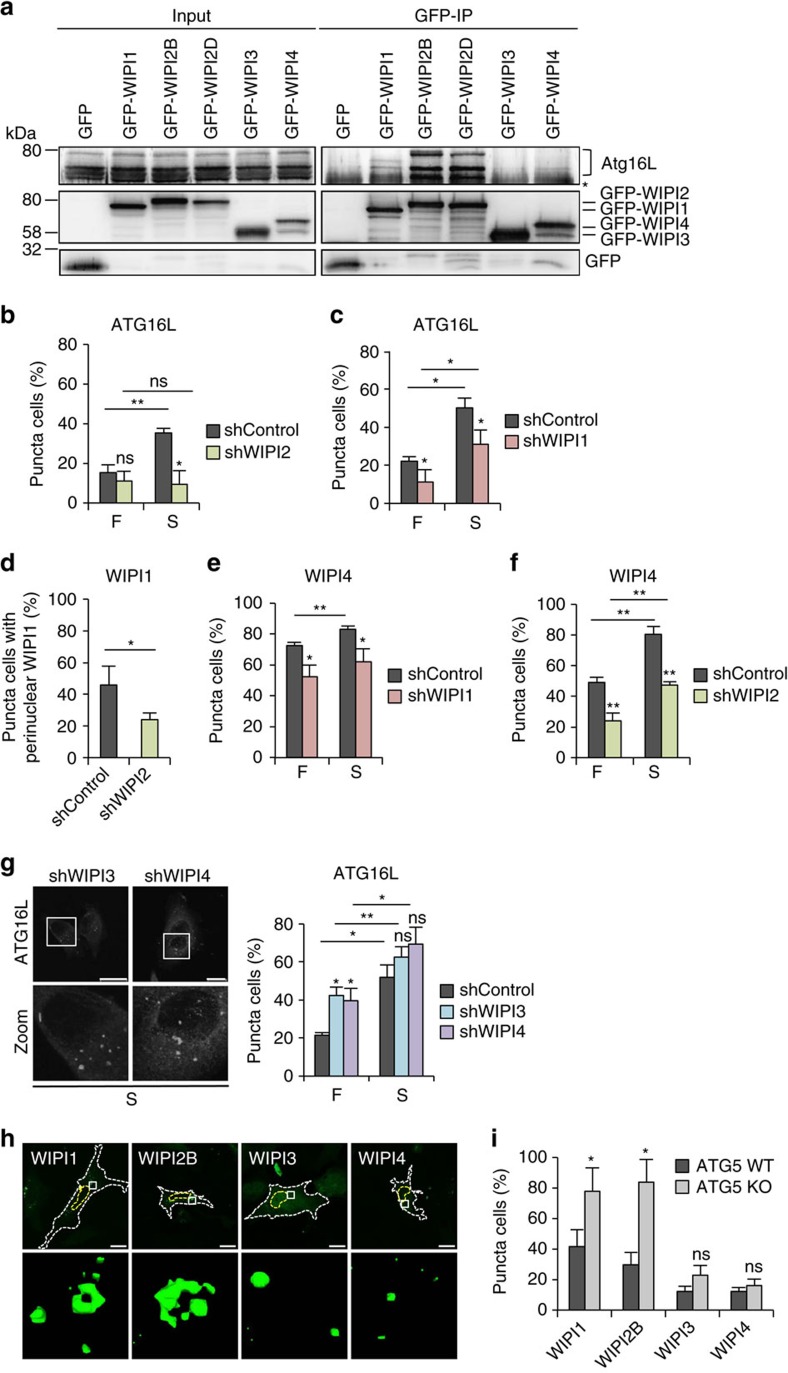
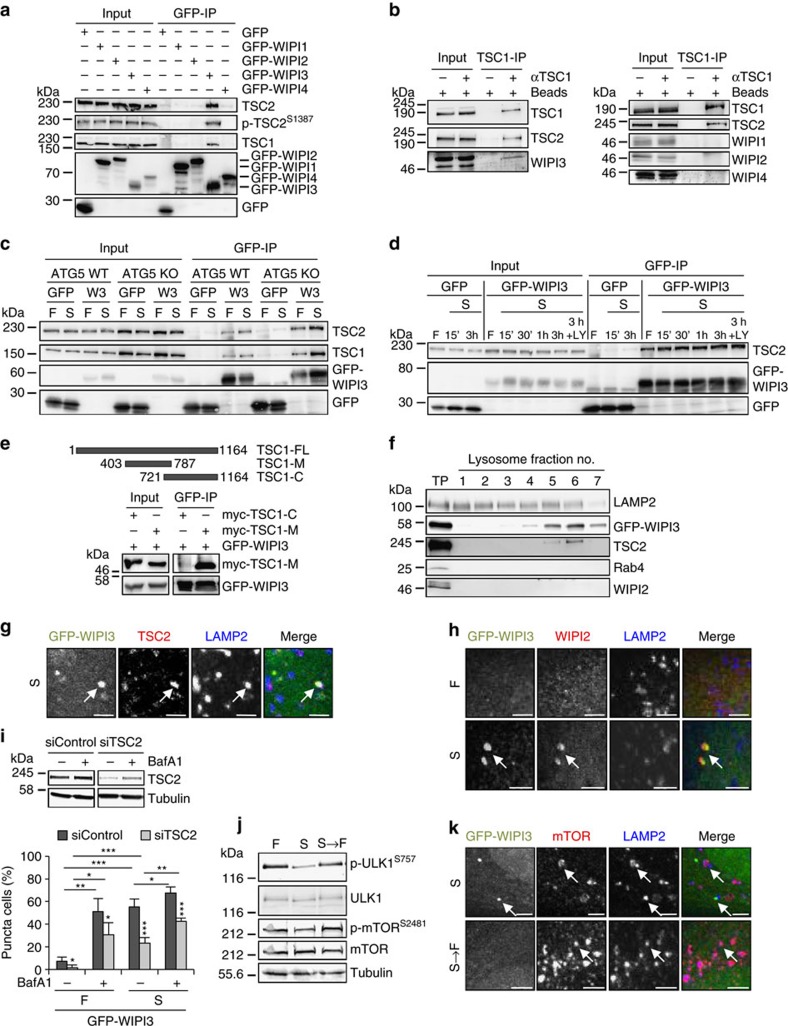
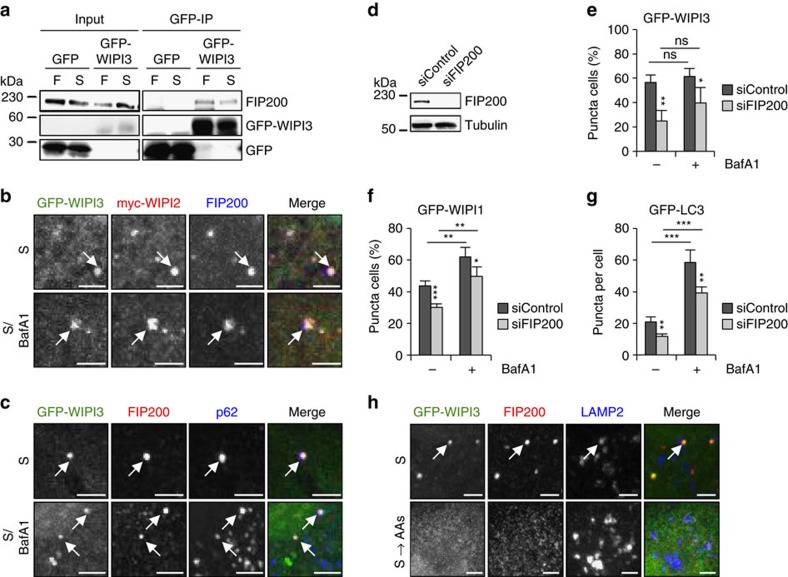
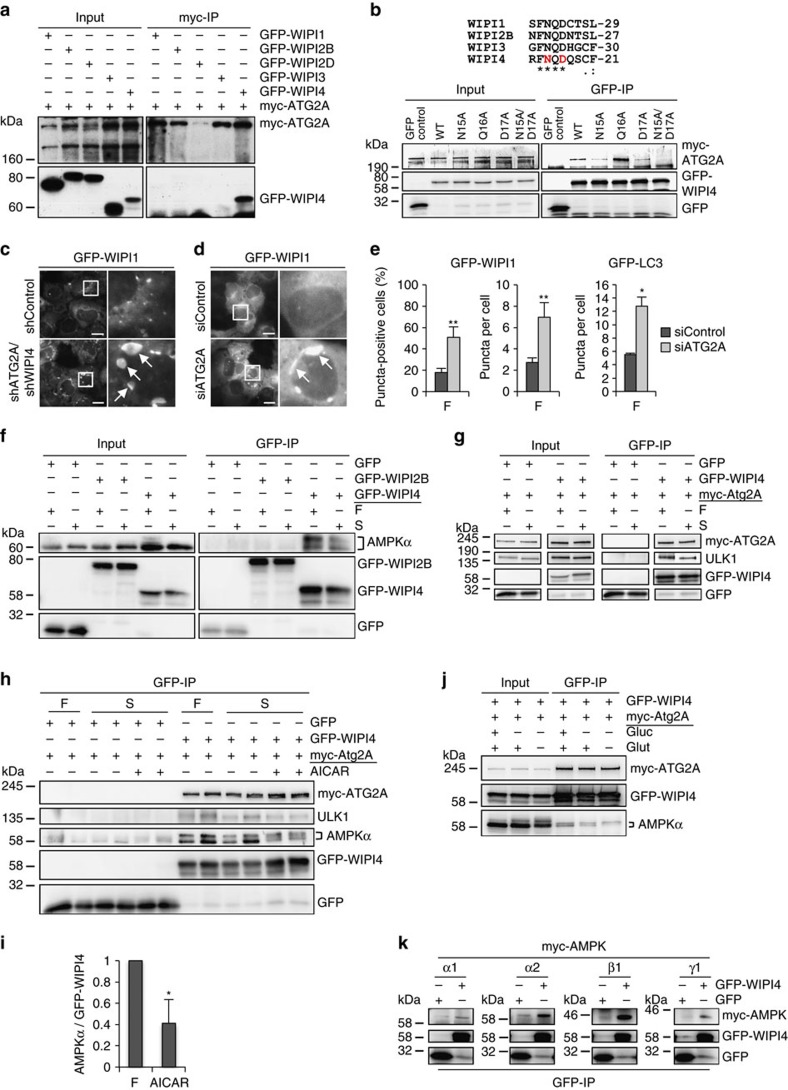
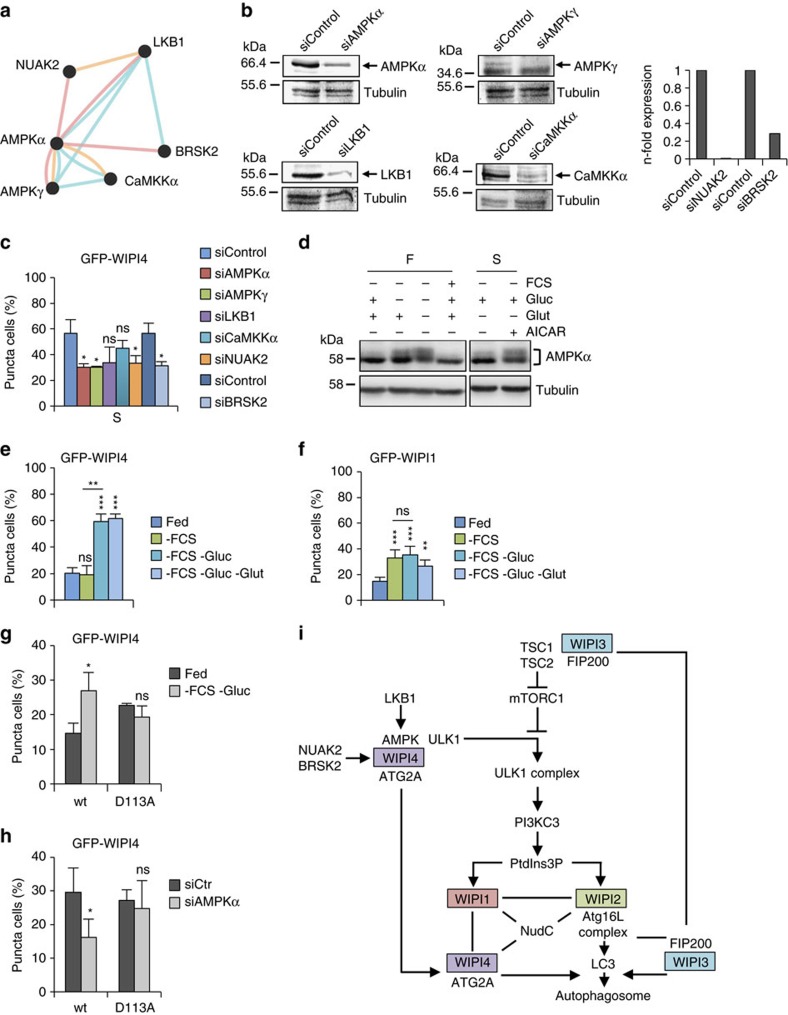
Autophagy is controlled by AMPK and mTOR, both of which associate with ULK1 and control the production of phosphatidylinositol 3-phosphate (PtdIns3P), a prerequisite for autophagosome formation. Here we report that WIPI3 and WIPI4 scaffold the signal control of autophagy upstream of PtdIns3P production and have a role in the PtdIns3P effector function of WIPI1-WIPI2 at nascent autophagosomes. In response to LKB1-mediated AMPK stimulation, WIPI4-ATG2 is released from a WIPI4-ATG2/AMPK-ULK1 complex and translocates to nascent autophagosomes, controlling their size, to which WIPI3, in complex with FIP200, also contributes. Upstream, WIPI3 associates with AMPK-activated TSC complex at lysosomes, regulating mTOR. Our WIPI interactome analysis reveals the scaffold functions of WIPI proteins interconnecting autophagy signal control and autophagosome formation. Our functional kinase screen uncovers a novel regulatory link between LKB1-mediated AMPK stimulation that produces a direct signal via WIPI4, and we show that the AMPK-related kinases NUAK2 and BRSK2 regulate autophagy through WIPI4.


Conflict of interest statement

The authors declare no competing financial interests.

Figures

Figure 1
Figure 1. All WIPI members fold into seven-bladed β-propeller proteins that bind PtdIns3P and co-localize at nascent autophagosomes.
(a) Structural homology modelling using HHpred. Propeller blades are indicated (1 to 7), and unstructured sequences are omitted. (b) Protein-phospholipid binding overlay assays using G361 cell extracts followed by the detection of endogenous WIPI1, WIPI2 or WIPI4 or using a monoclonal U2OS cell line stably expressing GFP-WIPI3 followed by anti-GFP enhanced chemiluminescence (ECL) detection (left panels). Monoclonal U2OS cell lines stably expressing GFP-WIPI1, GFP-WIPI2B or GFP-WIPI3 or transiently expressing GFP-WIPI4 were starved for 3 h with nutrient-free medium. Images were acquired by confocal LSM and processed using Volocity to generate 3D-reconstruction fly-through movies (Supplementary Movies 1–4). Representative still images are presented (right panels). Scale bars: 3 μm. (c) U2OS cells stably expressing GFP-WIPI1, GFP-WIPI2B or GFP-WIPI3 or transiently expressing GFP-WIPI4 were fed (F) or starved (S) for 3 h with or without bafilomycin A1 (BafA1) or LY294002 (LY). The percentage GFP-WIPI puncta cells were calculated (up to 429 cells per condition, n=3). (d) U2OS cells stably expressing GFP-WIPI1, GFP-WIPI2B or GFP-WIPI3 or transiently expressing GFP-WIPI4 were starved (3 h), and endogenous ATG12, LC3, p62 (anti-ATG12, anti-LC3, anti-p62 and IgG-Alexa Fluor 546 antibodies) or transiently expressed myc-tagged ATG14 or DFCP1 detected (anti-myc/IgG-Alexa Fluor 546 antibodies). Merged confocal LSM images are presented (left panels, dashed lines: cell boundaries; right panels: magnified subsections). Scale bars: 20 μm. (e) Confocal LSM examinations of starved (3 h) U2OS cells stably expressing GFP-WIPI1 and immunostained with anti-WIPI2/IgG-Alexa Fluor 546 and anti-WIPI4/IgG-Alexa Fluor 633 antibodies. Intensity profiles of co-localizations (peaks 1 and 2, upper panel) are displayed, along with the corresponding magnified image sections. Scale bar: 2.5 μm. (f) U2OS cells stably expressing GFP-WIPI3 and transiently expressing myc-tagged WIPI1 or WIPI2B were starved (3 h) and immunostained using anti-myc or anti-WIPI4 and IgG-Alexa Fluor 546 antibodies. Scale bar: 2.5 μm. Arrows in magnified image sections indicate co-localization events (df). Supplementary Material is available: Supplementary Fig. 1, Supplementary Note. Statistics and source data can be found in Supplementary Data 1. Mean±s.d.; heteroscedastic t-testing; P values: *P<0.05, **P<0.01, ***P<0.001, ns: not significant.
Figure 2
Figure 2. Differential contributions of WIPI members to the formation of functional autophagosomes.
G361 cell lines stably expressing shRNAs targeting WIPI1 (shWIPI1), WIPI2 (shWIPI2), WIPI3 (shWIPI3), WIPI4 (shWIPI4) or non-targeting shRNA (shControl) were assessed by quantitative RT–PCR (a) or electron microscopy analysis upon starvation (3 h), scale bars: 500 nm (b). (c) Monoclonal U2OS cell lines stably expressing GFP-LC3 and shWIPI2 or shControl were assessed by quantitative RT–PCR (left panel). Automated high-throughput image acquisition (middle panel, upper row: dashed lines indicate cell boundaries; lower row: magnified sections) and analysis (right panel). The numbers of GFP-LC3 puncta in control (shRNA) or WIPI2-KD (shWIPI2) cells were calculated under fed (F) or starved (S) conditions with or without wortmannin (WM) or bafilomycin A1 (BafA1). The mean number of GFP-LC3 puncta per cell was calculated (up to 15,401 cells per condition, n=3). Scale bars: 20 μm. (d) U2OS cells stably expressing GFP-LC3 were transiently transfected (48 h) with control siRNA (siControl) or siRNAs targeting WIPI3 (siWIPI3) or WIPI4 (siWIPI4). Total RNA was extracted for quantitative RT–PCR (left panel: WIPI3, middle panel: WIPI4). In addition, fed cells (F) cells were treated with or without of BafA1 for automated high-throughput image analysis (right panel). Mean numbers of GFP-LC3 puncta per cell are presented (up to 2,680 cells per condition, n=3). (e) Endogenous WIPI2 puncta formation was examined (anti-WIPI2/IgG-Alexa Fluor 488 antibodies) by confocal LSM and ImageJ (least 15 cells, n=3) using stable G361 WIPI3-KD (shWIPI3), WIPI4-KD (shWIPI4) and control cells (shControl). (f) G361 cells were transiently transfected with control siRNA (siControl), siWIPI3, siWIPI4 or a siWIPI3/siWIPI4 combination and fed (F) or starved (S) for 3 h with or without BafA1. Cell lysates were analysed by anti-LC3 and anti-tubulin western blotting. The migrations of LC3-I and LC3-II are indicated (left panel). LC3-I (middle panel) and LC3-II (right panel) abundances were quantified and results achieved in fed conditions (F) are presented (n=3). Supplementary Material is available: Supplementary Fig. 2. Statistics and source data can be found in Supplementary Data 1. Mean±s.d.; heteroscedastic t-testing; P values: *P<0.05, **P<0.01, ***P<0.001, ns: not significant.
Figure 3
Figure 3. The WIPI protein interactome.
Monoclonal U2OS cell lines stably expressing GFP-WIPI1, GFP-WIPI2B, GFP-WIPI2D, GFP-WIPI3, GFP-WIPI4 or GFP alone were analysed by anti-GFP immunoprecipitation followed by nano liquid chromatography (LC)-MS/MS analysis (for detailed information, see Materials and Methods). (a) GeneMANIA was used to visualize identified WIPI protein–protein interactions. Red lines represent interactions identified in this study, and grey lines represent previously reported and predicted interactions (GeneMANIA, see Materials and Methods). ATG proteins and autophagy regulators are indicated with red letters. Complete results can be found in Supplementary Data 2. Interactions identified using GFP-WIPI2B and GFP-WIPI2D were combined and are presented as WIPI2 interactions. Proteins exclusively interacting with either of the two WIPI2 isoforms can be found in Supplementary Data 2. (b) A sub-network of the WIPI protein interactome focusing on autophagy-related and autophagy-relevant proteins is shown. Red lines represent interactions identified in this study, with dotted red lines representing interactions with low peptide counts in our LC-MS/MS analysis. Grey lines represent previously reported and predicted interactions (GeneMANIA, see Materials and Methods). In addition, the reported interactions of FIP200-ATG16L, TSC1-FIP200 and AMPK-TSC2 that did not appear when using GeneMANIA are also shown in grey. Supplementary Data demonstrating WIPI1, WIPI2B, WIPI2D and WIPI4 co-immunoprecipitation with NudC (Supplementary Fig. 4) is available.
Figure 4
Figure 4. WIPI1 assists WIPI2 in recruiting ATG16L for LC3 lipidation.
(a) U2OS cells transiently expressing GFP-WIPI1, GFP-WIPI2B, GFP-WIPI2D, GFP-WIPI3, GFP-WIPI4 or GFP alone were starved for 3 h and analysed by anti-GFP immunoprecipitation followed by anti-GFP or anti-ATG16L immunoblotting. The asterisk in the right panel (GFP-IP) represents a nonspecific band. Endogenous ATG16L isoforms co-precipitated with GFP-WIPI1, GFP-WIPI2B and GFP-WIPI2D as indicated in the right panel. (b,c) G361 cells stably expressing shRNA targeting WIPI2 (b, shWIPI2), WIPI1 (c, shWIPI1) or the non-targeting control (shControl) were fed (F) or starved (S) for 3 h, and endogenous ATG16L was detected using anti-ATG16L/IgG-Alexa Fluor 488 antibodies and fluorescence microscopy. Mean percentages of ATG16L-puncta-positive cells (up to 369 individual cells per condition, n=3) are presented. (d) Monoclonal U2OS cells stably expressing GFP-WIPI1 and shWIPI2 or shControl were starved (S) for 3 h, and the percentage of cells displaying an accumulation of perinuclear GFP-WIPI1 was calculated using fluorescence microscopy. Mean values (400 cells per condition, n=4) are presented. (e,f) G361 cells stably expressing shRNAs targeting WIPI1 (e, shWIPI1) or WIPI2 (f, shWIPI2) were fed (F) or starved (S) for 3 h and immunostained using anti-WIPI4/IgG-Alexa Fluor 488 antibodies. Mean percentages of WIPI4-puncta-positive cells (up to 340 cells per condition, n=3) are presented. (g) G361 cells stably expressing shRNAs targeting WIPI3 (shWIPI3), WIPI4 (shWIPI4) or the non-targeting shRNA control (shControl) were fed (F) or starved (S) for 3 h and immunostained using anti-ATG16L/IgG-Alexa Fluor 488 antibodies for analysis by fluorescence microscopy (left panel). Mean percentages of ATG16L-puncta-positive cells (up to 387 cells per condition, n=3) are presented (right panel). (h,i) ATG5 wild-type (WT) or knockout (KO) mouse embryonic fibroblasts (MEFs) transiently expressing GFP-WIPI1, GFP-WIPI2B, GFP-WIPI3 or GFP-WIPI4 were analysed by confocal LSM, and images from ATG5 WT MEFs (h, upper panel) were processed using Volocity to generate 3D-reconstruction fly-through movies (Supplementary Movies 5–8), from which still images are presented (h, lower panel). Mean percentages of GFP-WIPI puncta-positive cells (300 cells, n=3). Mean±s.d.; heteroscedastic t-testing; P values: *P<0.05, ns: not significant. Scale bars: 20 μm. Statistics and source data can be found in Supplementary Data 1.
Figure 5
Figure 5. WIPI3 interacts with the TSC complex.
(a) Stable GFP-WIPI1, GFP-WIPI2B, GFP-WIPI3 or GFP-WIPI4 U2OS cells were starved (3 h), and subjected to anti-GFP immunoprecipitation and anti-TSC2, anti-phospho-TSC2 (S1387), anti-TSC1 or anti-GFP immunoblotting. (b) U2OS cells were analysed by anti-TSC1 immunoprecipitation (TSC1-IP), anti-TSC1, anti-TSC2 and anti-WIPI1 (right panel), anti-WIPI2 (right panel), anti-WIPI3 (left panel) or anti-WIPI4 (right panel) immunoblotting. (c) ATG5 WT or KO MEFs expressing GFP-WIPI3 (W3) or GFP were subjected to anti-GFP immunoprecipitation and anti-TSC1, anti-TSC2 and anti-GFP immunoblotting. Conditions (3 h): fed (F) or starved (S). (d) Stable GFP-WIPI3 or GFP U2OS cells were analysed by anti-GFP immunoprecipitation and anti-TSC2 and anti-GFP immunoblotting. Conditions (15 min. to 3 h): fed (F), starved (S), starved with LY294002 (S+LY). (e) Myc-tagged TSC1 fragments (TSC1-M, TSC1-C; full length: TSC-FL) were expressed in stable GFP-WIPI3 U2OS cells and subjected to anti-GFP immunoprecipitation and anti-GFP or anti-myc immunoblotting. (f) Lysosomal fractions (no. 1–7; total protein control: TP) from stable GFP-WIPI3 U2OS cells (BafA1, 3 h) were immunoblotted using anti-GFP, anti-LAMP2, anti-TSC2, anti-WIPI2 or anti-Rab4 antibodies. (g) Stable GFP-WIPI3 U2OS cells were starved (3 h) and immunostained with anti-TSC2/IgG-Alexa Fluor 546 and anti-LAMP2/IgG-Alexa Fluor 633 antibodies for confocal LSM. (h) Stable GFP-WIPI3 U2OS cells were immunostained with anti-Lamp2/IgG-Alexa Fluor 633 and anti-WIPI2/IgG-Alexa Fluor 546 for confocal LSM. Conditions (3 h): fed (F), starved (S). (i) Stable GFP-WIPI3 U2OS cells with siControl or siTSC2 were fed (F) or starved (S) with or without BafA1 (3 h). Upper panel: anti-TSC2 immunoblotting, lower panel: GFP-WIPI3 puncta assessment (up to 493 cells per condition, n=4). (j) U2OS cells were subjected to immunoblotting using anti-phospho-mTOR (S2481), anti-mTOR, anti-phospho-ULK1 (S757), anti-ULK1 and anti-tubulin antibodies. Treatments: fed (F, 4 h), starved (S, 4 h), starved (3 h) and fed (1 h) (S→F). (k) Stable GFP-WIPI3 U2OS cells were immunostained with anti-mTOR/IgG-Alexa Fluor 546 and anti-LAMP2/IgG-Alexa Fluor 633 antibodies. Treatments: starved (S, 2 h), starved (2 h) and fed (1 h) (S→F). Co-localizations are indicated with arrows (g,h,k). Supplementary Material is available: Supplementary Fig. 5. Statistics and source data: Supplementary Data 1. Mean±s.d.; heteroscedastic t-testing; P values: *P<0.05, **P<0.01, ***P<0.001. Scale bars: 3 μm.
Figure 6
Figure 6. WIPI3 interacts with FIP200 at nascent autophagosomes and at LAMP2-positive lysosomes/late endosomes.
(a) Mouse embryonic fibroblasts transiently expressing GFP-WIPI3 or GFP alone were fed (F) or starved (S) for 3 h and analysed by immunoprecipitation using anti-GFP antibodies and anti-FIP200 or anti-GFP immunoblotting. (b) U2OS cells stably expressing GFP-WIPI3 were transfected with myc-WIPI2B and starved (S) in the absence or presence of BafA1 for 3 h. Cells were immunostained with anti-myc/IgG-Alexa Fluor 546 or anti-FIP200/IgG-Alexa Fluor 633 antibodies and visualized by confocal LSM. (c) U2OS cells stably expressing GFP-WIPI3 were starved (S) in the absence or presence of BafA1 for 3 h, immunostained with anti-FIP200/IgG-Alexa Fluor 546 and anti-p62/IgG-Alexa Fluor 633 antibodies and visualized by confocal LSM. (d,e) U2OS cells stably overexpressing GFP-WIPI3 were transfected with control siRNA or FIP200 siRNA. Subsequently, the cells were starved for 3 h in the absence or presence BafA1. FIP200 downregulation was confirmed by immunoblotting using anti-FIP200 and anti-tubulin antibodies (d). Mean percentages of GFP-WIPI3-puncta-positive cells (up to 481 cells per condition, n=4) are presented (e). (f) U2OS cells stably overexpressing GFP-WIPI1 were transfected with control siRNA or FIP200 siRNA. Subsequently, the cells were starved for 3 h with nutrient-free medium in the absence or presence BafA1. Using automated image acquisition and analysis, the mean percentages of GFP-WIPI1-puncta-positive cells (up to 5,856 cells per condition, n=4) were calculated. (g) In parallel, this experiment was conducted using GFP-LC3-expressing U2OS cells and mean numbers of GFP-LC3 puncta per cell (up to 4,798 cells per condition, n=4) calculated. (h) U2OS cells stably expressing GFP-WIPI3 were starved (S) for 2 h or starved and replenished with amino acids for 1 h (S→AAs). Subsequently, cells were immunostained with anti-FIP200/IgG-Alexa Fluor 546 and anti-LAMP2/IgG-Alexa Fluor 633 antibodies and visualized by confocal LSM. Image magnifications are presented (b,c,h) and co-localizations indicated with white arrows. Supplementary Material is available: Supplementary Fig. 6. Statistics and source data can be found in Supplementary Data 1. Mean±s.d.; heteroscedastic t-testing; P values: *P<0.05, **P<0.01, ***P<0.001, ns: not significant. Scale bars: 3 μm.
Figure 7
Figure 7. WIPI4 interacts with ATG2, AMPK and ULK1.
(a) U2OS cells transiently expressing GFP-tagged WIPI proteins and myc-ATG2A were starved and analysed by anti-myc immunoprecipitation and anti-myc and anti-GFP immunoblotting. (b) U2OS cells expressing myc-ATG2A and GFP, GFP-WIPI4 WT or GFP-WIPI4 mutants (N15A, Q16A, D17A, N15A/D17A) were analysed by anti-GFP immunoprecipitation, and anti-myc and anti-GFP immunoblotting. Amino acids in WIPI4 conferring ATG2 binding are highlighted in red (upper panel). (c) Stable GFP-WIPI1 U2OS cells with shRNAs targeting WIPI4 and ATG2 (shATG2/shWIPI4) or with shControl were analysed by automated imaging. Aberrant GFP-WIPI1 accumulations are indicated. (d,e) Stable GFP-WIPI1 or GFP-LC3 U2OS cells were transfected with siATG2 or siControl (fed conditions, F) and images of GFP-WIPI1 cells are shown (d). (e) GFP-WIPI1 (left, middle panel) and GFP-LC3 puncta (right panel) formation was assessed using up to 13,614 GFP-WIPI1 U2OS cells (n=3) or up to 9,457 GFP-LC3 U2OS cells (n=3) per condition. (f) Stable GFP-WIPI2B, GFP-WIPI4 or GFP U2OS cells expressing myc-ATG2A were fed (F) or starved (S) and analysed by anti-GFP immunoprecipitation and anti-GFP or anti-AMPKα immunoblotting (n=2). (g) Stable GFP-WIPI4 or GFP U2OS cells expressing myc-ATG2A were fed (F) or starved (S) for 3 h and analysed by anti-GFP immunoprecipitation and immunoblotting (anti-GFP, anti-myc or anti-Ulk1 antibodies) (n=3 with duplicates). (h) Stable GFP-WIPI4 or GFP U2OS cells expressing myc-ATG2A were analysed by anti-GFP immunoprecipitation and anti-GFP, anti-myc, anti-Ulk1 or anti-AMPKα immunoblotting. Conditions (3 h): fed (F), starved (S), starved with AICAR (n=3 with duplicates). (i) The abundance of AMPK co-purifying with GFP-WIPI4 upon AICAR treatment was quantified (n=3). (j) Stable GFP-WIPI4 cells expressing myc-ATG2A were treated (3 h) with complete medium (without FCS) lacking glucose (Gluc) or glucose/glutamine (Gluc/Glut), and analysed by anti-GFP immunoprecipitation and anti-myc, anti-AMPKα and anti-GFP immunoblotting. (k) U2OS cells expressing GFP or GFP-WIPI4 with myc-tagged AMPKα1, α2, β1 or γ1 were analysed by anti-GFP immunoprecipitation and anti-myc and anti-GFP immunoblotting. Additional Supplementary Material is available: Supplementary Fig. 7. Statistics and source data: Supplementary Data 1. Mean±s.d.; heteroscedastic t-testing; P values: *P<0.05, **P<0.01, ***P<0.001, ns: not significant. Scale bars: 20 μm.
Figure 8
Figure 8. Glucose-starvation-mediated AMPK activation regulates WIPI4.
(a) A lentiviral-based shRNA screening approach targeting the human kinome used for the assessment of autophagy identified AMPK and the AMPK-related protein kinases NUAK2 and BRSK2, along with CaMKKα, as autophagy regulators (for details see Methods section and Supplementary Fig. 8). Reported (red) and predicted (yellow) proteins interactions, and pathway interactions (blue) are indicated (GeneMANIA). (b) Stable GFP-WIPI1 U2OS cells were transfected with siRNAs for AMPKα, AMPKγ, LKB1, CaMKKα, NUAK2 or BRSK2 and knock-down confirmed by immunoblotting (left panels) or quantitative RT–PCR (right panels). (c) Stable GFP-WIPI4 U2OS cells with siRNAs targeting AMPKα, AMPKγ, LKB1, CaMKKα, NUAK2 or BRSK2 were starved (S) for 3 h. Mean percentages of GFP-WIPI4-puncta-positive cells (300 cells per condition, n=3) are presented. (d) U2OS cells were fed (F) or starved (S) with or without glucose, glutamine or AICAR and immunoblotted using anti-AMPKα and anti-tubulin antibodies. Stable GFP-WIPI4 U2OS cells (e) or GFP-WIPI1 (f) were fed or treated with complete medium without FCS (−FCS), without glucose (−FCS −Gluc) or without glucose and glutamine (−FCS −Gluc −Glut). Mean percentages of GFP-WIPI4-puncta-positive cells (300 cells per condition, n=3) (e) and GFP-WIPI1-puncta-positive cells (up to 3,904 cells per condition, n=6) (f) are presented. (g) U2OS cells expressing GFP-WIPI4 WT or GFP-WIPI4 D113A mutant were fed or glucose-starved (−FCS −Gluc) for 3 h. Mean percentages of GFP-WIPI4-puncta-positive cells (300 cells per condition, n=3) are presented. (h) U2OS cells expressing GFP-WIPI4 WT or GFP-WIPI4 D113A mutant with siControl (siCtr) or siAMPKα were glucose-starved (−FCS −Gluc) for 3 h. Mean percentages of GFP-WIPI4-puncta-positive cells (500 cells per condition, n=5) are presented. (i) A predicted model for the differential contributions of human WIPI β-propeller proteins in autophagy. Statistics and source data can be found in Supplementary Data 1. Mean±s.d.; heteroscedastic t-testing; P values: *P<0.05, **P<0.01, ***P<0.001, ns: not significant.

Similar articles

Cited by

References

    1. Ohsumi Y. Historical landmarks of autophagy research. Cell Res. 24, 9–23 (2014). - PMC - PubMed
    1. Lamb C. A., Yoshimori T. & Tooze S. A. The autophagosome: origins unknown, biogenesis complex. Nat. Rev. Mol. Cell Biol. 14, 759–774 (2013). - PubMed
    1. Stolz A., Ernst A. & Dikic I. Cargo recognition and trafficking in selective autophagy. Nat. Cell Biol. 16, 495–501 (2014). - PubMed
    1. Rubinsztein D. C., Marino G. & Kroemer G. Autophagy and aging. Cell 146, 682–695 (2011). - PubMed
    1. Meijer A. J., Lorin S., Blommaart E. F. & Codogno P. Regulation of autophagy by amino acids and MTOR-dependent signal transduction. Amino acids 47, 2037–2063 (2015). - PMC - PubMed

Publication types

MeSH terms

Substances