. 2017 Jun 15;546(7658):411-415.
doi: 10.1038/nature22402. Epub 2017 May 24.

Zika virus evolution and spread in the Americas

Hayden C Metsky  1   2 Christian B Matranga  1 Shirlee Wohl  1   3 Stephen F Schaffner  1   3   4 Catherine A Freije  1   3 Sarah M Winnicki  1 Kendra West  1 James Qu  1 Mary Lynn Baniecki  1 Adrianne Gladden-Young  1 Aaron E Lin  1   3 Christopher H Tomkins-Tinch  1 Simon H Ye  1   5 Daniel J Park  1 Cynthia Y Luo  1   3 Kayla G Barnes  1   3   4 Rickey R Shah  1   6 Bridget Chak  1   3 Giselle Barbosa-Lima  7 Edson Delatorre  8 Yasmine R Vieira  7 Lauren M Paul  9 Amanda L Tan  9 Carolyn M Barcellona  9 Mario C Porcelli  10 Chalmers Vasquez  10 Andrew C Cannons  11 Marshall R Cone  11 Kelly N Hogan  11 Edgar W Kopp  11 Joshua J Anzinger  12 Kimberly F Garcia  13 Leda A Parham  13 Rosa M Gélvez Ramírez  14 Maria C Miranda Montoya  14 Diana P Rojas  15 Catherine M Brown  16 Scott Hennigan  16 Brandon Sabina  16 Sarah Scotland  16 Karthik Gangavarapu  17 Nathan D Grubaugh  17 Glenn Oliveira  18 Refugio Robles-Sikisaka  17 Andrew Rambaut  19   20 Lee Gehrke  21   22 Sandra Smole  16 M Elizabeth Halloran  23   24 Luis Villar  14 Salim Mattar  25 Ivette Lorenzana  13 Jose Cerbino-Neto  7 Clarissa Valim  4   26 Wim Degrave  27 Patricia T Bozza  28 Andreas Gnirke  1 Kristian G Andersen  17   18   29 Sharon Isern  9 Scott F Michael  9 Fernando A Bozza  7   30 Thiago M L Souza  31   32 Irene Bosch  21 Nathan L Yozwiak  1   3 Bronwyn L MacInnis  1   4 Pardis C Sabeti  1   3   4   33
Affiliations

Zika virus evolution and spread in the Americas

Hayden C Metsky et al. Nature. .

Abstract

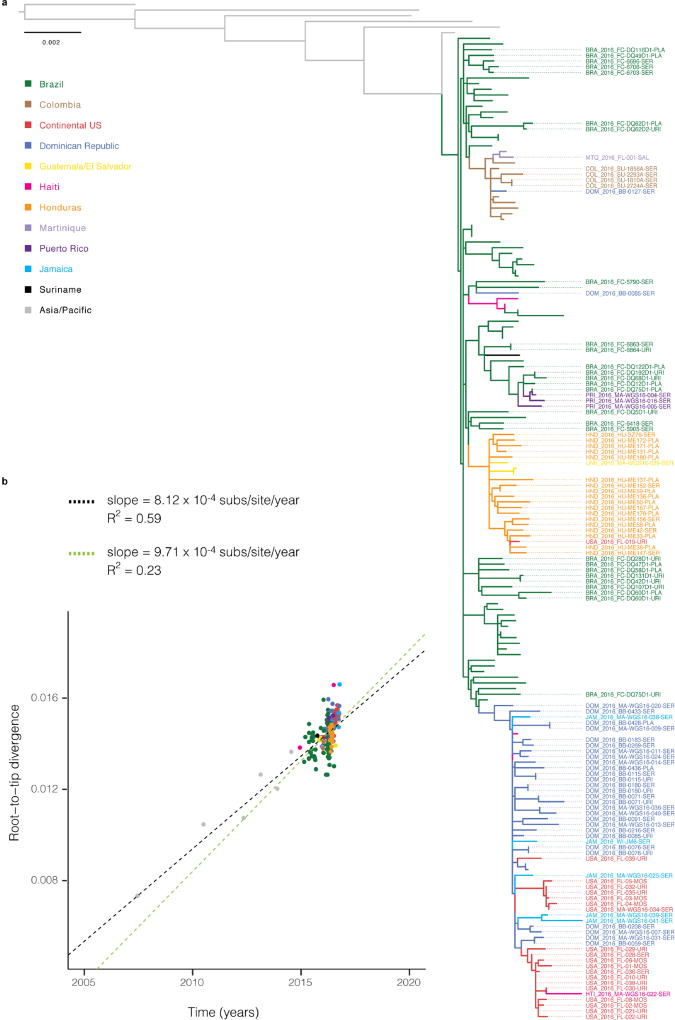
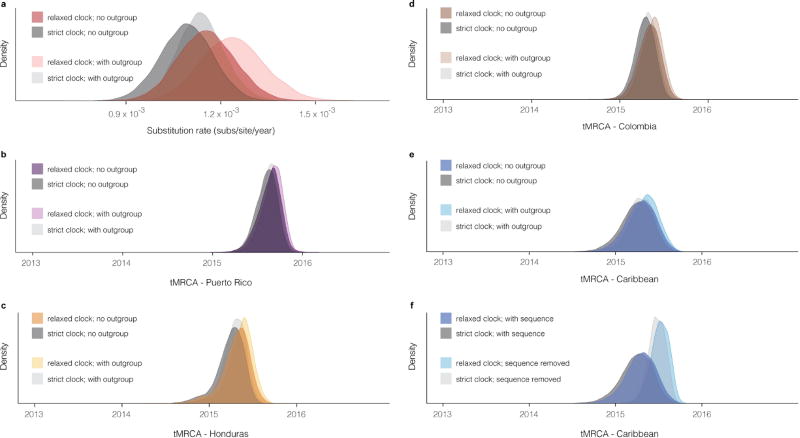
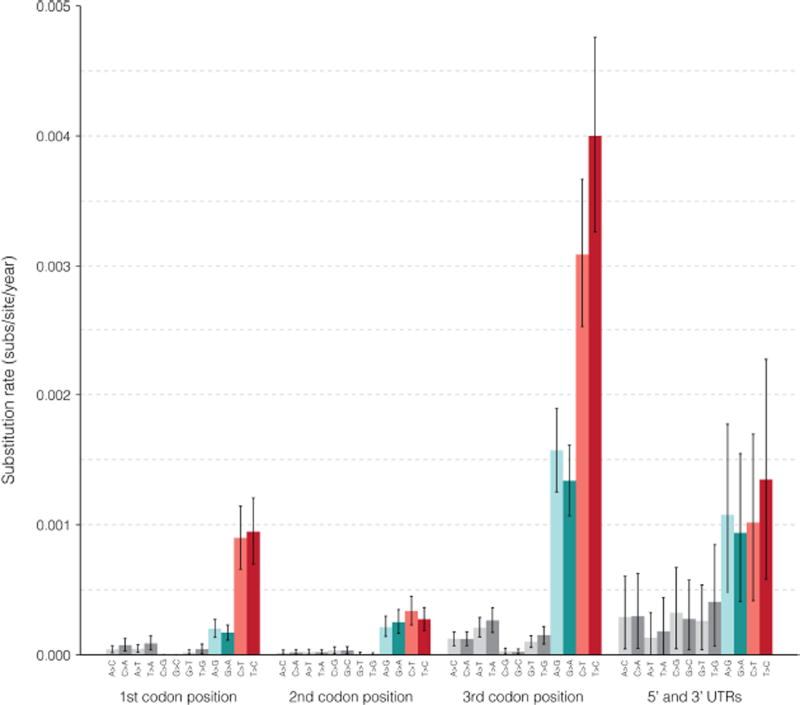
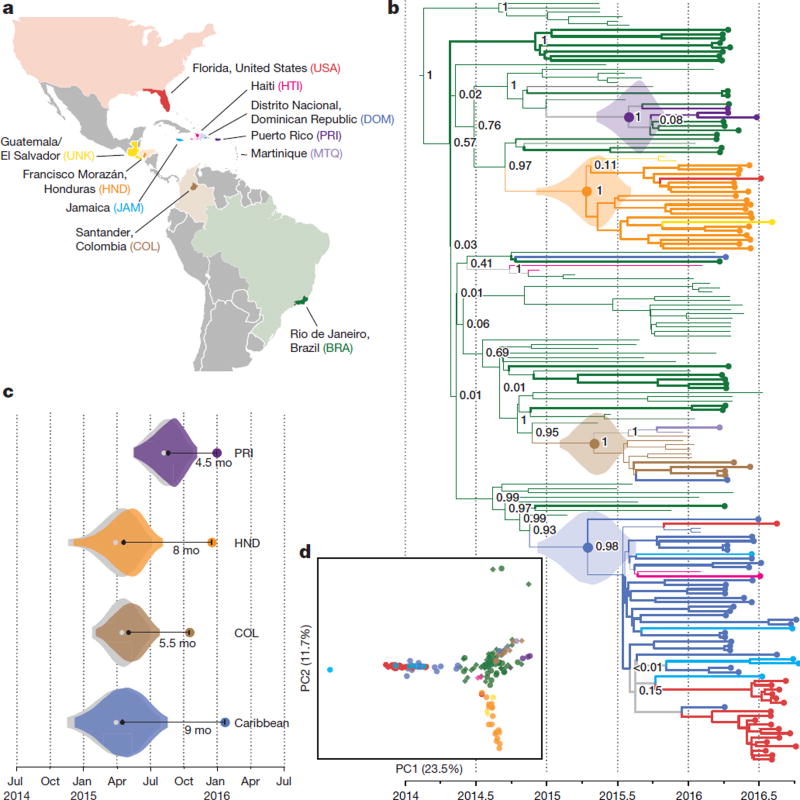
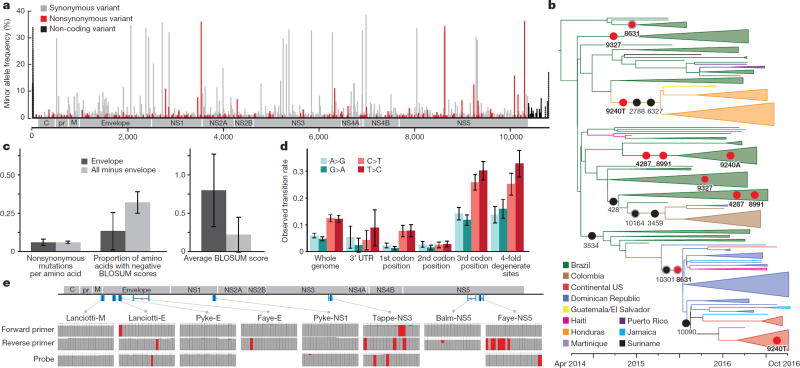
Although the recent Zika virus (ZIKV) epidemic in the Americas and its link to birth defects have attracted a great deal of attention, much remains unknown about ZIKV disease epidemiology and ZIKV evolution, in part owing to a lack of genomic data. Here we address this gap in knowledge by using multiple sequencing approaches to generate 110 ZIKV genomes from clinical and mosquito samples from 10 countries and territories, greatly expanding the observed viral genetic diversity from this outbreak. We analysed the timing and patterns of introductions into distinct geographic regions; our phylogenetic evidence suggests rapid expansion of the outbreak in Brazil and multiple introductions of outbreak strains into Puerto Rico, Honduras, Colombia, other Caribbean islands, and the continental United States. We find that ZIKV circulated undetected in multiple regions for many months before the first locally transmitted cases were confirmed, highlighting the importance of surveillance of viral infections. We identify mutations with possible functional implications for ZIKV biology and pathogenesis, as well as those that might be relevant to the effectiveness of diagnostic tests.


Conflict of interest statement

The authors declare no competing financial interests.

Figures

Extended Data Figure 1
Extended Data Figure 1. Relationship between metadata and sequencing outcome
Analysis of possible predictors of sequencing outcome: the site where a sample was collected, patient gender, patient age, sample type, and collection interval. a, Prediction of whether a sample will pass assembly thresholds by sequencing. Rows show results of likelihood ratio tests on each predictor by omitting the variable from a full model that contains all predictors. Sample site and patient gender improve model fit, but sample type and collection interval do not. b, Proportion of samples that pass assembly thresholds by sequencing, divided by sample type, across six sample sites. c, Same as b, but divided by collection interval. d, Prediction of the genome fraction identified, using samples that passed assembly thresholds. Rows show results of likelihood ratio tests, as in a. Collection interval improves the model, but sample type does not. e, Sequencing outcome for each sample, divided by sample type, across six sample sites. f, Same as e, but divided by collection interval. Samples collected seven or more days after symptom onset produced, on average, the fewest unambiguous bases, though these observations are based on a limited number of data points. While the sample site variable accounts for differences in cohort composition, the observed effects of gender and collection interval might be due to confounders in composition that span multiple cohorts. These results illustrate the effects of variables on sequencing outcome for the samples in this study; they are not indicative of ZIKV titre more generally. Other studies, have analysed the impact of sample type and collection interval on ZIKV detection, sometimes with differing results.
Extended Data Figure 2
Extended Data Figure 2. Maximum likelihood tree and root-to-tip regression
a, Maximum likelihood tree. Tips are coloured by sample source location. Labelled tips indicate genomes generated in this study; all other coloured tips are other publicly available genomes from the outbreak in the Americas. Grey tips are genomes from ZIKV cases in Southeast Asia and the Pacific. b, Linear regression of root-to-tip divergence on dates. The substitution rate for the full tree, indicated by the slope of the black regression line, is similar to rates of Asian lineage ZIKV estimated by molecular clock analyses. The substitution rate for sequences within the Americas outbreak only, indicated by the slope of the green regression line, is similar to rates estimated by BEAST (1.15 × 10⁻³; 95% CI (9.78 × 10⁻⁴, 1.33 × 10⁻³)) for this dataset.
Extended Data Figure 3
Extended Data Figure 3. Substitution rate and tMRCA distributions
a, Posterior density of the substitution rate. Shown with and without the use of sequences (outgroup) from outside the Americas. be, Posterior density of the date of the most recent common ancestor (MRCA) of sequences in four regions corresponding to those in Fig. 2c. Shown with and without the use of outgroup sequences. The use of outgroup sequences has little effect on estimates of these dates. f, Posterior density of the date of the MRCA of sequences in a clade consisting of samples from the Caribbean and continental United States. Shown with and without the sequence of DOM_2016_MA-WGS16-020-SER, a sample from the Dominican Republic that has only 3,037 unambiguous bases; this is the most ancestral sequence in the clade and its presence affects the tMRCA. In all panels, all densities are shown as observed with a relaxed clock model and with a strict clock model.
Extended Data Figure 4
Extended Data Figure 4. Substitution rates estimated with BEAST
Substitution rates estimated in three codon positions and non-coding regions (5′ and 3′ UTRs). Transversions are shown in grey and transitions are coloured by transition type. Plotted values show the mean of rates calculated at each sampled Markov chain Monte Carlo (MCMC) step of a BEAST run. These calculated rates provide additional evidence for the observed high C-to-T and T-to-C transition rates shown in Fig. 3d.
Extended Data Figure 5
Extended Data Figure 5. cDNA concentration of amplicon primer pools predicts sequencing outcome
cDNA concentration of amplicon pools (as measured by Agilent 2200 Tapestation) is highly predictive of amplicon sequencing outcome. On each axis, 1 + primer pool concentration is plotted on a log scale. Each point is a technical replicate of a sample and colours denote observed sequencing outcome of the replicate. If a replicate is predicted to be passing when at least one primer pool concentration is ≥0.8 ng µl−1, then sensitivity is 98.71% and specificity is 90.34%. An accurate predictor of sequencing success early in the sample processing workflow can save resources.
Extended Data Figure 6
Extended Data Figure 6. Evaluating multiple rounds of Zika virus hybrid capture
Genome assembly statistics of samples before hybrid capture (grey), and after one (blue) or two (red) rounds of hybrid capture. Nine individual libraries (eight unique samples) were sequenced all three ways, had more than one million raw reads in each method, and generated at least one passing assembly. Raw reads from each method were downsampled to the same number of raw reads (8.5 million) before genomes were assembled. a, Per cent of the genome identified, as measured by number of unambiguous bases. b, Median sequencing depth of ZIKV genomes, taken over the assembled regions.
Figure 1
Figure 1. Sequence data from clinical and mosquito samples
a, Thresholds used to select samples for downstream analysis. Each point is a replicate. Red and blue shading: regions of accepted amplicon sequencing and hybrid capture genome assemblies, respectively. Not shown: hybrid capture positive controls with depth > 10,000×. b, Amplicon sequencing coverage by sample (row) across the ZIKV genome. Red, sequencing depth ≥100×; heatmap (bottom) sums coverage across all samples. White horizontal lines on heatmap, amplicon locations. c, Relative sequencing depth across hybrid capture genomes. d, Withinsample variants for a single cultured isolate (PE243) across seven technical replicates. Each point is a variant in a replicate identified using amplicon sequencing (red) or hybrid capture (blue). Variants are plotted if the pooled frequency across replicates by either method is ≥1%. e, Within-sample variant frequencies across methods. Each point is a variant in a clinical or mosquito sample and points are plotted on a log–log scale. Green points, ‘verified’ variants detected by hybrid capture that pass strand bias and frequency filters. Frequencies <1% are shown at 0%. f, Counts of within-sample variants across two technical replicates for each method. Variants are plotted in the frequency bin corresponding to the higher of the two detected frequencies.
Figure 2
Figure 2. Zika virus spread throughout the Americas
a, Samples were collected in each of the coloured countries or territories. Specific state, department, or province of origin for samples in this study is highlighted if known. b, Maximum clade credibility tree. Dotted tips, genomes generated in this study. Node labels are posterior probabilities indicating support for the node. Violin plots denote probability distributions for the tMRCA of four highlighted clades. c, Time elapsed between estimated tMRCA and date of first confirmed, locally transmitted case. Colour, distributions based on relaxed clock model (also shown in b); grey, strict clock. Caribbean clade includes the continental United States. d, Principal component analysis of variants. Circles, data generated in this study; diamonds, other publicly available genomes from this outbreak. Percentage of variance explained by each component is indicated on axis.
Figure 3
Figure 3. Geographic and genomic distribution of Zika virus variation
a, Location of variants in the ZIKV genome. The minor allele frequency is the proportion of the 174 genomes from this outbreak that share a variant. Dotted bars, <25% of samples had a base call at that position. b, Phylogenetic distribution of nonsynonymous variants with minor allele frequency >5%, shown on the branch where the mutation is most likely to have occurred. Grey outline, variant might be on next-most ancestral branch (in two cases, two branches upstream), but exact location is unclear because of missing data. Red circles, variants occurring at more than one location in the tree. c, Conservation of the ZIKV envelope (E) region. Left, nonsynonymous variants per amino acid for the E region (dark grey) and the rest of the coding region (light grey). Middle, proportion of nonsynonymous variants resulting in negative BLOSUM62 scores, which indicate unlikely or extreme substitutions (P < 0.039, χ2 test). Right, average of BLOSUM62 scores for nonsynonymous variants (P < 0.037, two-sample t-test). d, Constraint in the ZIKV 3′ UTR and observed transition rates over the ZIKV genome. e, ZIKV diversity in diagnostic primer and probe regions. Top, locations of published probes (dark blue) and primers (cyan) on the ZIKV genome. Bottom, each column represents a nucleotide position in the probe or primer. Colours in the column indicate the fraction of ZIKV genomes (out of 174) that matched the probe/primer sequence (grey), differed from it (red), or had no data for that position (white).

Comment in

Similar articles

  • Genomic epidemiology supports multiple introductions and cryptic transmission of Zika virus in Colombia.
    Black A, Moncla LH, Laiton-Donato K, Potter B, Pardo L, Rico A, Tovar C, Rojas DP, Longini IM, Halloran ME, Peláez-Carvajal D, Ramírez JD, Mercado-Reyes M, Bedford T. Black A, et al. BMC Infect Dis. 2019 Nov 12;19(1):963. doi: 10.1186/s12879-019-4566-2. BMC Infect Dis. 2019. PMID: 31718580 Free PMC article.
  • Genomic epidemiology reveals multiple introductions of Zika virus into the United States.
    Grubaugh ND, Ladner JT, Kraemer MUG, Dudas G, Tan AL, Gangavarapu K, Wiley MR, White S, Thézé J, Magnani DM, Prieto K, Reyes D, Bingham AM, Paul LM, Robles-Sikisaka R, Oliveira G, Pronty D, Barcellona CM, Metsky HC, Baniecki ML, Barnes KG, Chak B, Freije CA, Gladden-Young A, Gnirke A, Luo C, MacInnis B, Matranga CB, Park DJ, Qu J, Schaffner SF, Tomkins-Tinch C, West KL, Winnicki SM, Wohl S, Yozwiak NL, Quick J, Fauver JR, Khan K, Brent SE, Reiner RC Jr, Lichtenberger PN, Ricciardi MJ, Bailey VK, Watkins DI, Cone MR, Kopp EW 4th, Hogan KN, Cannons AC, Jean R, Monaghan AJ, Garry RF, Loman NJ, Faria NR, Porcelli MC, Vasquez C, Nagle ER, Cummings DAT, Stanek D, Rambaut A, Sanchez-Lockhart M, Sabeti PC, Gillis LD, Michael SF, Bedford T, Pybus OG, Isern S, Palacios G, Andersen KG. Grubaugh ND, et al. Nature. 2017 Jun 15;546(7658):401-405. doi: 10.1038/nature22400. Epub 2017 May 24. Nature. 2017. PMID: 28538723 Free PMC article.
  • Zika virus in the Americas: Early epidemiological and genetic findings.
    Faria NR, Azevedo RDSDS, Kraemer MUG, Souza R, Cunha MS, Hill SC, Thézé J, Bonsall MB, Bowden TA, Rissanen I, Rocco IM, Nogueira JS, Maeda AY, Vasami FGDS, Macedo FLL, Suzuki A, Rodrigues SG, Cruz ACR, Nunes BT, Medeiros DBA, Rodrigues DSG, Queiroz ALN, da Silva EVP, Henriques DF, da Rosa EST, de Oliveira CS, Martins LC, Vasconcelos HB, Casseb LMN, Simith DB, Messina JP, Abade L, Lourenço J, Alcantara LCJ, de Lima MM, Giovanetti M, Hay SI, de Oliveira RS, Lemos PDS, de Oliveira LF, de Lima CPS, da Silva SP, de Vasconcelos JM, Franco L, Cardoso JF, Vianez-Júnior JLDSG, Mir D, Bello G, Delatorre E, Khan K, Creatore M, Coelho GE, de Oliveira WK, Tesh R, Pybus OG, Nunes MRT, Vasconcelos PFC. Faria NR, et al. Science. 2016 Apr 15;352(6283):345-349. doi: 10.1126/science.aaf5036. Epub 2016 Mar 24. Science. 2016. PMID: 27013429 Free PMC article.
  • Zika virus-spread, epidemiology, genome, transmission cycle, clinical manifestation, associated challenges, vaccine and antiviral drug development.
    Pielnaa P, Al-Saadawe M, Saro A, Dama MF, Zhou M, Huang Y, Huang J, Xia Z. Pielnaa P, et al. Virology. 2020 Apr;543:34-42. doi: 10.1016/j.virol.2020.01.015. Epub 2020 Feb 2. Virology. 2020. PMID: 32056845 Review.
  • The Asian Lineage of Zika Virus: Transmission and Evolution in Asia and the Americas.
    Hu T, Li J, Carr MJ, Duchêne S, Shi W. Hu T, et al. Virol Sin. 2019 Feb;34(1):1-8. doi: 10.1007/s12250-018-0078-2. Epub 2019 Jan 25. Virol Sin. 2019. PMID: 30684211 Free PMC article. Review.

Cited by

References

    1. World Health Organization. Zika situation report: Zika virus, Microcephaly and Guillain–Barré syndrome. 2017 http://who.int/emergencies/zika-virus/situation-report/2-february-2017/en/
    1. Reynolds MR, et al. Vital signs: update on Zika virus-associated birth defects and evaluation of all U.S. infants with congenital Zika virus exposure—U.S. Zika pregnancy registry, 2016. MMWR Morb. Mortal. Wkly. Rep. 2017;66:366–373. - PMC - PubMed
    1. de Vigilância em Saúde S. Protocolo de Vigilância e Resposta à Ocorrência de Microcefalia. Ministério da Saúde Brasília; 2016.
    1. Schieffelin JS, et al. Clinical illness and outcomes in patients with Ebola in Sierra Leone. N. Engl. J. Med. 2014;371:2092–2100. - PMC - PubMed
    1. Sardi SI, et al. Coinfections of Zika and chikungunya viruses in Bahia, Brazil, identified by metagenomic next-generation sequencing. J. Clin. Microbiol. 2016;54:2348–2353. - PMC - PubMed

Publication types

MeSH terms