. 2017 Jun 15;546(7658):401-405.
doi: 10.1038/nature22400. Epub 2017 May 24.

Genomic epidemiology reveals multiple introductions of Zika virus into the United States

Nathan D Grubaugh  1 Jason T Ladner  2 Moritz U G Kraemer  3   4   5 Gytis Dudas  6 Amanda L Tan  7 Karthik Gangavarapu  1 Michael R Wiley  2   8 Stephen White  9 Julien Thézé  3 Diogo M Magnani  10 Karla Prieto  2   8 Daniel Reyes  2   11 Andrea M Bingham  12 Lauren M Paul  7 Refugio Robles-Sikisaka  1 Glenn Oliveira  13 Darryl Pronty  9 Carolyn M Barcellona  7 Hayden C Metsky  14 Mary Lynn Baniecki  14 Kayla G Barnes  14 Bridget Chak  14 Catherine A Freije  14 Adrianne Gladden-Young  14 Andreas Gnirke  14 Cynthia Luo  14 Bronwyn MacInnis  14 Christian B Matranga  14 Daniel J Park  14 James Qu  14 Stephen F Schaffner  14 Christopher Tomkins-Tinch  14 Kendra L West  14 Sarah M Winnicki  14 Shirlee Wohl  14 Nathan L Yozwiak  14 Joshua Quick  15 Joseph R Fauver  16 Kamran Khan  17   18 Shannon E Brent  17 Robert C Reiner Jr  19 Paola N Lichtenberger  20 Michael J Ricciardi  10 Varian K Bailey  10 David I Watkins  10 Marshall R Cone  21 Edgar W Kopp 4th  21 Kelly N Hogan  21 Andrew C Cannons  21 Reynald Jean  22 Andrew J Monaghan  23 Robert F Garry  24 Nicholas J Loman  15 Nuno R Faria  3 Mario C Porcelli  25 Chalmers Vasquez  25 Elyse R Nagle  2   11 Derek A T Cummings  26 Danielle Stanek  12 Andrew Rambaut  27   28 Mariano Sanchez-Lockhart  2   11 Pardis C Sabeti  14   29   30   31 Leah D Gillis  9 Scott F Michael  7 Trevor Bedford  6 Oliver G Pybus  3 Sharon Isern  7 Gustavo Palacios  2 Kristian G Andersen  1   13   32
Affiliations

Genomic epidemiology reveals multiple introductions of Zika virus into the United States

Nathan D Grubaugh et al. Nature. .

Abstract

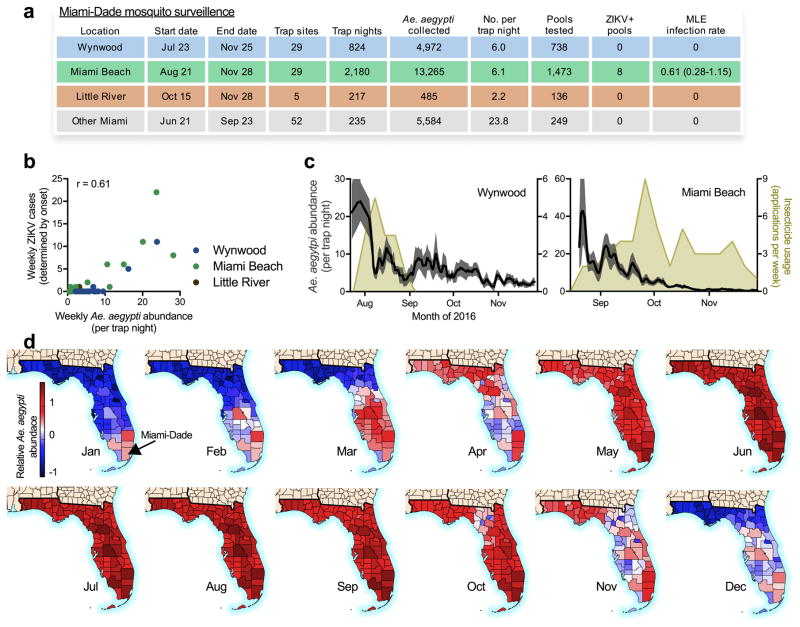
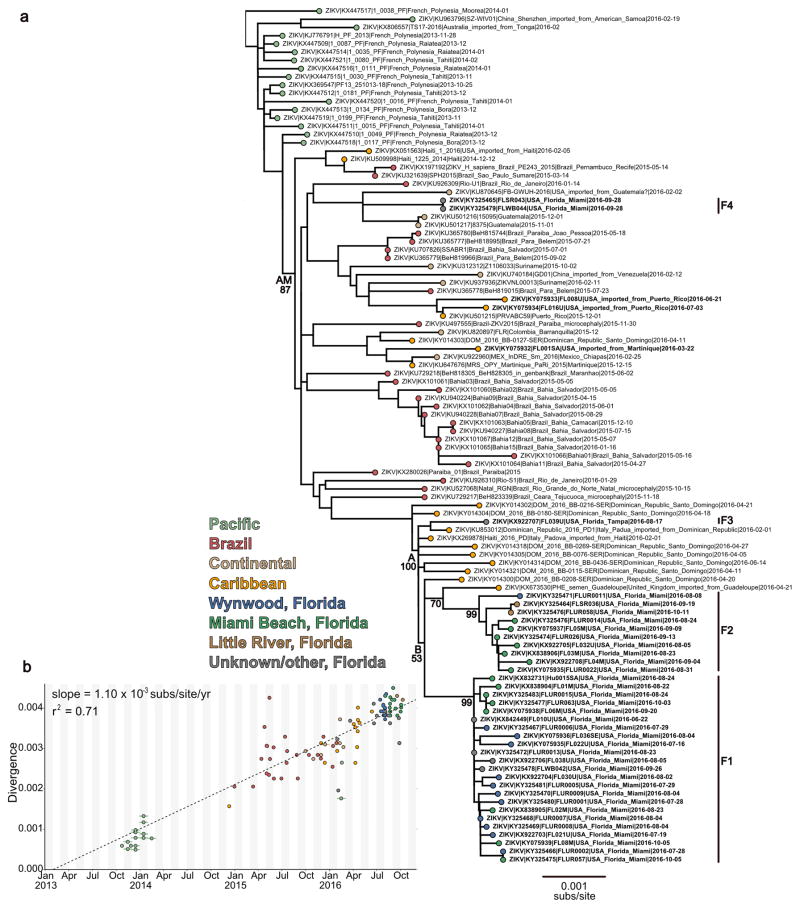
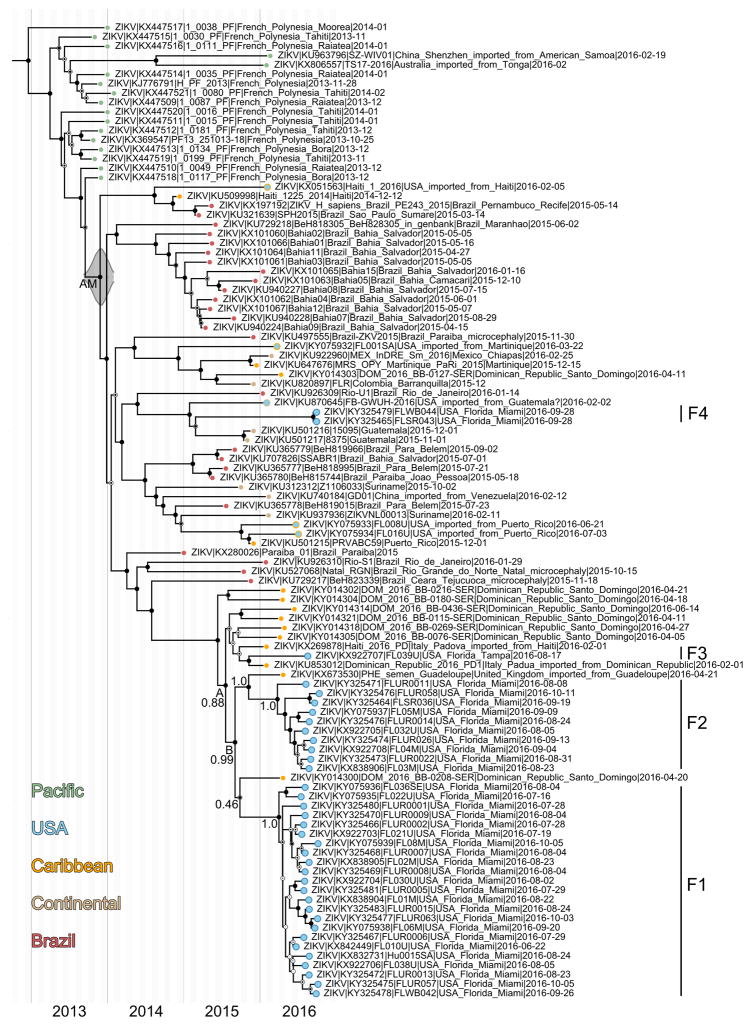
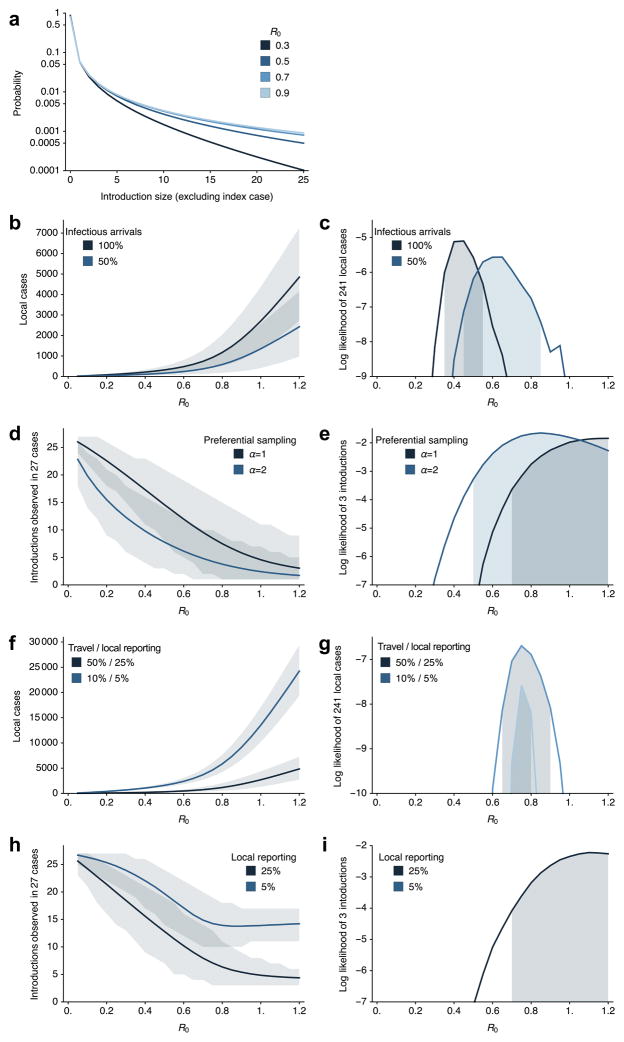
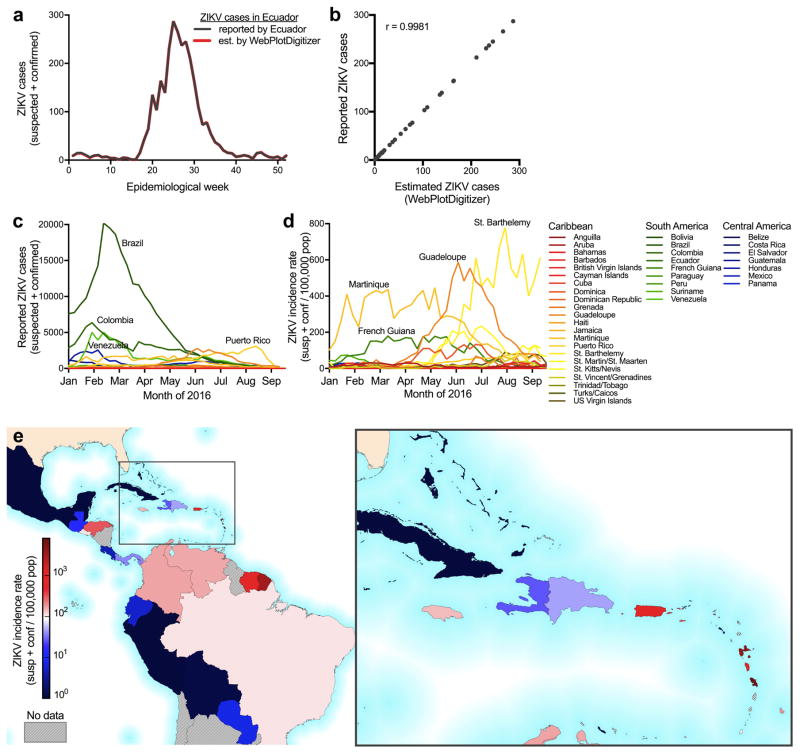
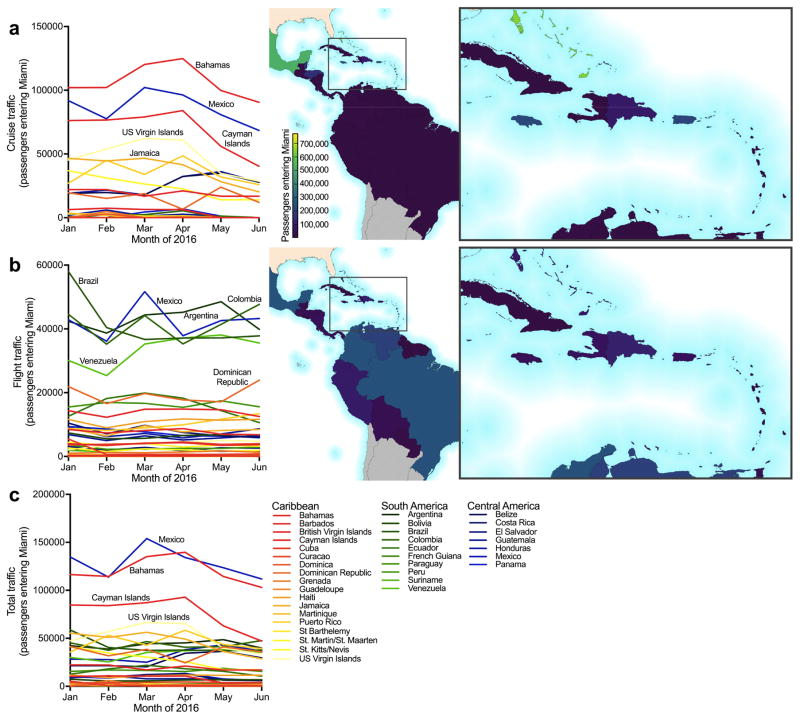
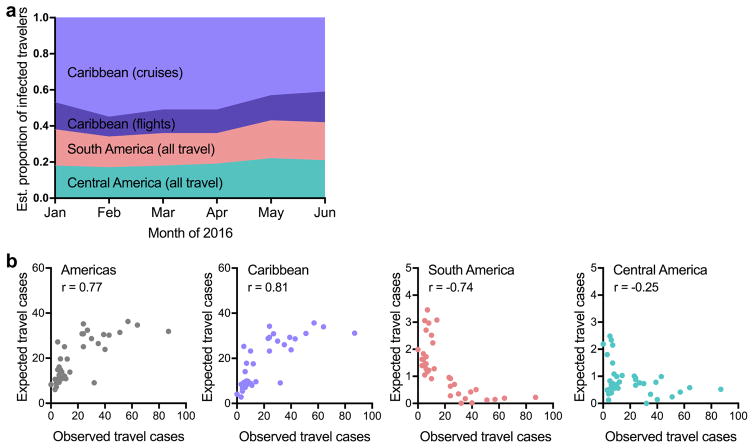
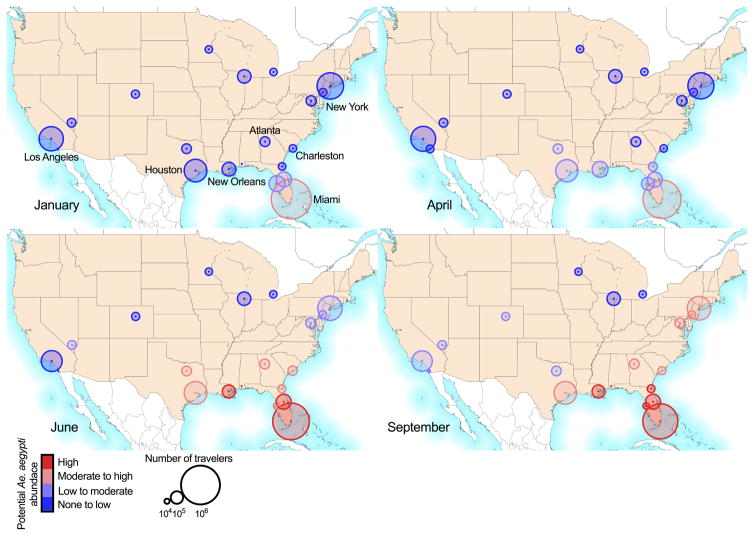
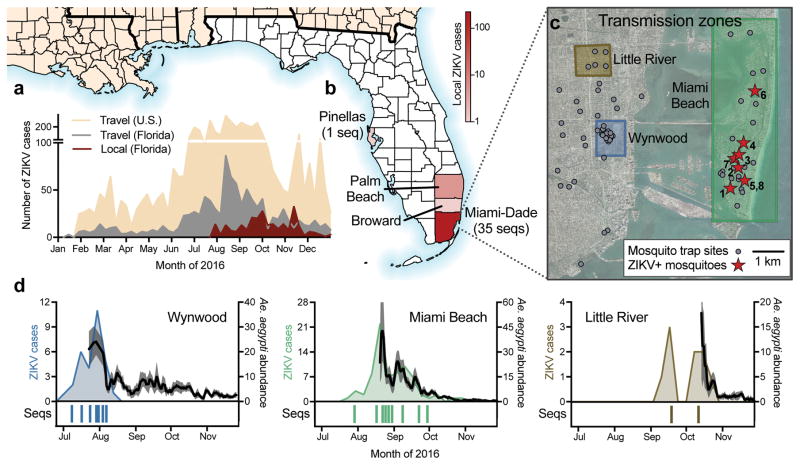
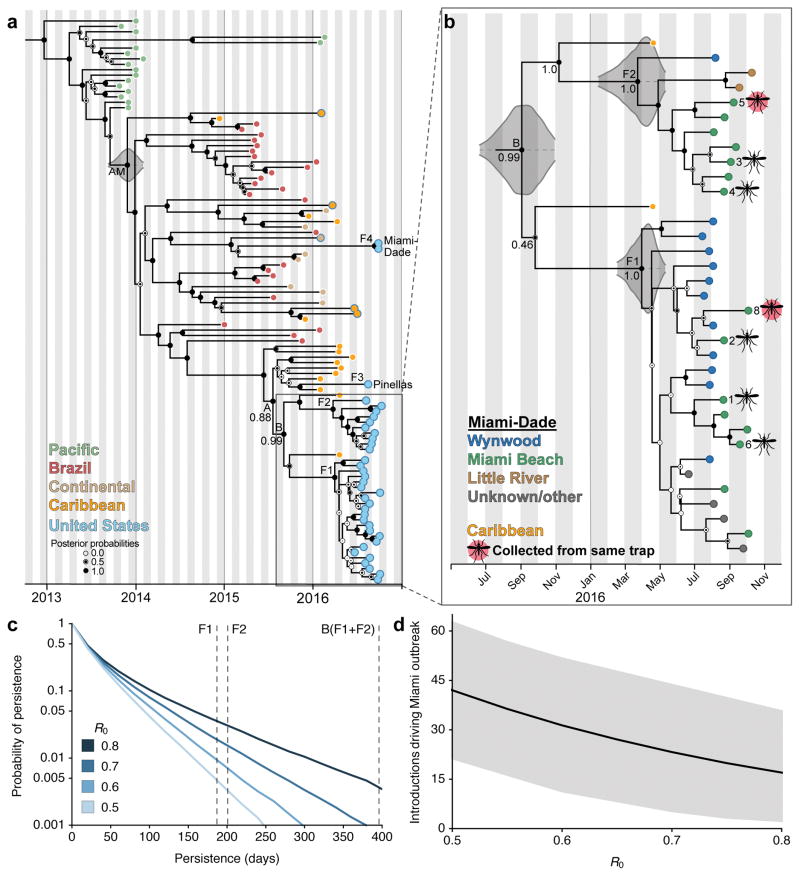
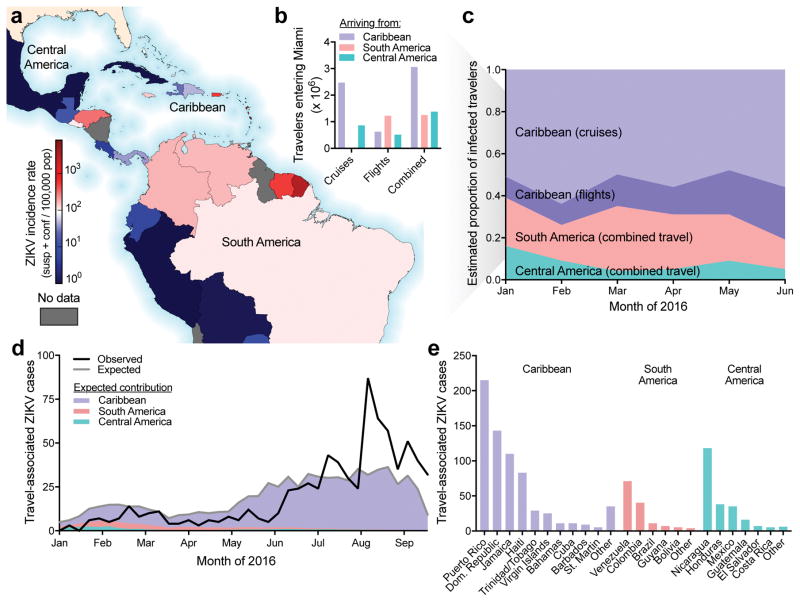
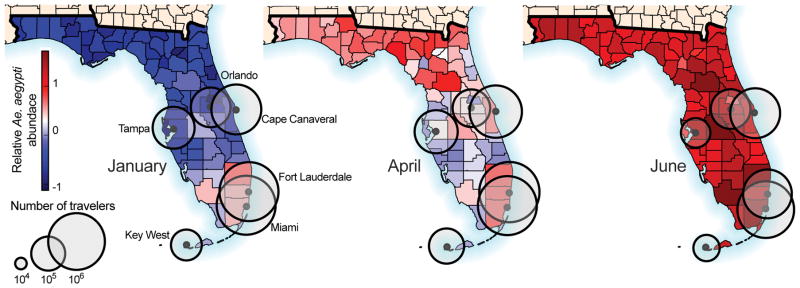
Zika virus (ZIKV) is causing an unprecedented epidemic linked to severe congenital abnormalities. In July 2016, mosquito-borne ZIKV transmission was reported in the continental United States; since then, hundreds of locally acquired infections have been reported in Florida. To gain insights into the timing, source, and likely route(s) of ZIKV introduction, we tracked the virus from its first detection in Florida by sequencing ZIKV genomes from infected patients and Aedes aegypti mosquitoes. We show that at least 4 introductions, but potentially as many as 40, contributed to the outbreak in Florida and that local transmission is likely to have started in the spring of 2016-several months before its initial detection. By analysing surveillance and genetic data, we show that ZIKV moved among transmission zones in Miami. Our analyses show that most introductions were linked to the Caribbean, a finding corroborated by the high incidence rates and traffic volumes from the region into the Miami area. Our study provides an understanding of how ZIKV initiates transmission in new regions.


Conflict of interest statement

The authors declare no competing financial interests.

Figures

Extended Data Fig. 1
Extended Data Fig. 1. Miami-Dade mosquito surveillance and relative Aedes aegypti abundance
(a) Mosquito surveillance data reported from June 21 to November 28, 2016 was used to evaluate the risk of ZIKV infection from mosquito-borne transmission in Miami. A total of 24,306 Ae. aegypti and 45 Ae. albopictus were collected. Trap nights are the total number of times each trap site was used and the trap locations are shown in Fig. 1d (some “Other Miami” trap sites are located outside of mapped region). Up to 50 mosquitoes of the same species and trap night were pooled together for ZIKV RNA testing. The infection rates were calculated using a maximum likelihood estimate (MLE). None of the Ae. albopictus pools contained ZIKV RNA. (b) The number of weekly ZIKV cases (based on symptoms onset) was correlated with mean Ae. aegypti abundance per trap night determined from the same week and zone (Spearman r = 0.61). This suggests that when the virus is present, mosquito abundance numbers alone could be used to target control efforts. (c) Insecticide usage, including truck and aerial adulticides and larvacides, by the Miami-Dade Mosquito Control in Wynwood (left) and Miami Beach (right) was overlaid with Ae. aegypti abundance per trap night to demonstrate that intense usage of insecticides may have helped to reduce local mosquito populations. (d) Relative Ae. aegypti abundance for each Florida county and month was estimated using a multivariate regression model, demonstrating spatial and temporal heterogeneity for the risk of ZIKV infection.
Extended Data Fig. 2
Extended Data Fig. 2. Maximum likelihood tree and root-to-tip regression of Zika virus genomes from Pacific islands and the epidemic in Americas
(a) Maximum likelihood tree of publicly available ZIKV sequences and sequences generated in this study (n=104). tips are coloured by location, labels in bold indicate sequences generated in this study, Florida clusters F1–F4 are indicated by vertical lines to the right of the tree. Bootstrap support values are shown at key nodes. All other support values can be found in Supplementary File 1. (b) Linear regression of sample tip dates against divergence from root based on sequences with known collection dates estimates an evolutionary rate for the ZIKV phylogeny of 1.10×10⁻³ nucleotide substitutions/site/year (subs/site/yr). This is consistent with BEAST analyses using a relaxed molecular clock and a Bayesian Skyline tree prior, the best-performing combination of clock and demographic model according to marginal likelihood estimates (Extended Data Table 1c), which estimated an evolutionary rate of 1.21×10⁻³ (95% highest posterior density: 1.01 – 1.43×10⁻³) subs/site/yr (Extended Data Table 1a). These values are in agreement with previous estimates calculated based on ZIKV genomes from Brazil.
Extended Data Fig. 3
Extended Data Fig. 3. Molecular clock dating of Zika virus clades
Maximum clade credibility (MCC) tree of ZIKV genomes collected from Pacific islands and the epidemic in Americas (n=104). Circles at the tips are colored based on origin location. Clade posterior probabilities are indicated by white circles filled with black relative to the support. A posterior probability of 1 fills the entire circle black. The grey violin plot indicates the 95% highest posterior density (HPD) interval for the tMRCA of the American epidemic. We estimated that the tMRCA for the ongoing epidemic in the Americas occurred during October, 2013 (node AM, Extended Table 1, 95% HPD: August, 2013-January, 2014), which is consistent with previous analysis based on ZIKV genomes from Brazil.
Extended Data Fig. 4
Extended Data Fig. 4. Estimation of basic reproductive number and number of introductions in Miami-Dade County
(a) Probability distribution of estimated total number of cases caused by a single introduction (excluding the index case) for different values of R0. (b) Mean and 95% CI for total number of local cases caused by 320 introduction events (i.e., travel-associated cases diagnosed in Miami-Dade County) for different values of R0 and for different assumptions of proportion of infectious travelers. (c) Log likelihood of observing 241 local cases in Miami-Dade County with 320 introduction events for different values of R0 along with 95% maximum likelihood estimate (MLE) bounds on R0. (d) Mean and 95% uncertainty interval for total number of distinct phylogenetic clusters observed in 27 sequenced ZIKV genomes from human cases diagnosed in Miami-Dade County for different values of R0 and for different assumptions of sampling bias, from α=1 (no sampling bias) to α=2 (skewed toward preferentially sampling larger clusters). (e) Log likelihood of observing 3 clusters (i.e., ZIKV lineages F1, F2, and F4, Fig. 2a) in 27 sequenced cases for different values of R0 along with 95% MLE bounds on R0. (f) Mean and 95% CI for total number of local cases caused by 320 observed travel-associated cases with travel-associated vs local reporting rates of 50%/25% and 10%/5%. This assumes 50% of travelers are infectious. (g) Log likelihood of observing 241 local cases with 320 introduction events for different values of R0 along with 95% MLE bounds on R0 with travel-associated vs local reporting rates of 50%/25% and 10%/5%. (h) Mean and 95% uncertainty interval for total number of distinct phylogenetic clusters observed in 27 sequenced ZIKV genomes for different values of R0 and for assumptions of local reporting rate of 5% and 25%. This assumes preferential sampling (α=2). (i) Log likelihood of observing 3 clusters in 27 sequenced cases for different values of R0 along with 95% MLE bounds on R0 with local reporting rate of 5% and 25%. At 5% local reporting rate, 0 of the 100,000 replicates for all R0 values showed 3 clusters.
Extended Data Fig. 5
Extended Data Fig. 5. Weekly reported Zika virus case numbers and incidence rates in the Americas
(a) Most ZIKV case numbers reported by PAHO were only available as bar graphs (raw data was not made available to us at the time of request). Therefore we used the WebPlotDigitizer to estimate the weekly case numbers from the PAHO bar graphs. ZIKV cases reported from Ecuador was the only data set to include a link to the actual case numbers that also had >10 cases per week. To validate the WebPlotDigitizer, we compared the weekly reported case numbers from Ecuador to our estimates. (b) The reported and estimated case numbers were strongly correlated (Spearman r = 0.9981). The WebPlotDigitizer was used to estimate the ZIKV case numbers for all subsequent analysis. (c) ZIKV cases (suspected and confirmed) and (d) incidence rates (normalized per 100,000 population) are shown for each country or territory with available data per epidemiological week from January 1 to September 18, 2016. (e) Each country or territory with available data is colored by its reported ZIKV incidence rate from January to June, 2016 (the time frame for analysis of ZIKV introductions into Florida).
Extended Data Fig. 6
Extended Data Fig. 6. Cruise and flight traffic entering Miami from regions with Zika virus transmission
The estimated number of passengers entering Miami, by either (a) cruises or (b) flights, from each country or territory in the Americas with ZIKV transmission per month (left panel). The center map and inset show the cumulative numbers of travelers entering Miami during January to June, 2016 (the time frame for analysis of ZIKV introductions into Florida) from each country or territory per method of travel. (c) The total traffic (i.e. cruises and flights) is shown entering Miami per month.
Extended Data Fig. 7
Extended Data Fig. 7. Expected number of Zika virus infected travelers from the Caribbean is correlated with the total observed number of travel-associated infections
(a) In order to account for potential biases in ZIKV reporting accuracies, we also estimated the proportion of infected travelers using projected ZIKV attack rates (i.e. predicted proportion of population infected before epidemic burnout). About 60% of the infected travelers are expected to have arrived from the Caribbean, similar to our results using incidence rates (Fig. 3c). (b) The expected number of travel-associated ZIKV cases were estimated by the number of travelers coming into Miami from each country/territory (travel capacity) and the in-country/territory infection likelihood (incidence rate per person) per week. The expected travel cases were summed from all of the Americas (left), Caribbean (left center), South America (right center), and Central America (right) and plotted with the observed travel-associated ZIKV cases. Numbers in each plot indicate Spearman correlation coefficients. Negative Spearman r coefficients indicated a negative correlation between the number of expected and observed travel cases.
Extended Data Fig. 8
Extended Data Fig. 8. Greater early season potential for Zika virus introductions into Miami
The monthly cruise ship and airline capacity from countries/territories with ZIKV transmission for the major United States travel hubs (shown as circle diameter) with monthly potential Ae. aegypti abundance (circle color), as previously estimated. The abundance ranges were chosen with respect to the May-Oct Miami mean: “None to low” (<2%), “Low to moderate” (2–25%), “Moderate to high (25–75%), and “High” (>75%). Mosquito-borne transmission is unlikely in the “None to low” range. Cruise capacities from Houston and Galveston, Texas were combined.
Figure 1
Figure 1. Zika virus outbreak in Florida
(a) Weekly counts of confirmed travel-associated and locally-acquired ZIKV cases in 2016. (b) Four counties reported locally-acquired ZIKV cases in 2016: Miami-Dade (241), Broward (5), Palm Beach (8), Pinellas (1), and unknown origin (1). (c) The locations of mosquito traps and collected Ae. aegypti mosquitoes found to contain ZIKV RNA (ZIKV+) in relation to the transmission zones within Miami. (d) Temporal distribution of weekly ZIKV cases (left y-axis), sequenced cases (bottom), and Ae. aegypti abundance per trap night (right y-axis) associated with the three described transmission zones. ZIKV cases and sequences are plotted in relation to symptom onset dates (n=18). Sequenced cases without onset dates or that occurred outside of the transmission zones are not shown (n=10). Human cases and Ae. aegypti abundance per week were positively correlated (Spearman r = 0.61, Extended Data Fig. 1b). The maps were generated using open source basemaps.
Figure 2
Figure 2. Multiple introductions of Zika virus into Florida
(a) Maximum clade credibility (MCC) tree of ZIKV genomes sequenced from outbreaks in the Pacific islands and the epidemic in the Americas. Tips are colored based on collection location. The five tips outlined in blue but filled with a different color indicate ZIKV cases in the United States associated with travel (fill color indicates the probable location of infection). Clade posterior probabilities are indicated by white circles filled with black relative to the level of support. The grey violin plot indicates the 95% highest posterior density (HPD) interval for the tMRCA for the epidemic in the Americas (AM). Lineage F4 contains two identical ZIKV genomes from the same patient. (b) A zoomed in version of the whole MCC tree showing the collection locations of Miami-Dade sequences and whether they were sequenced from mosquitoes (numbers correspond to trap locations in Fig. 1c). 95% HPD intervals are shown for the tMRCAs (c) The probability of ZIKV persistence after introduction for different R0. Persistence is measured as the number of days from initial introduction of viral lineages until their extinction. Vertical dashed lines show the inferred mean persistence time for lineages F1, F2 and B based on their tMRCA. (d) Total number of introductions (mean with 95% CI) that contributed to the outbreak of 241 local cases in Miami-Dade County for different R0.
Figure 3
Figure 3. Frequent opportunities for Zika virus introductions into Miami from the Caribbean
(a) Reported ZIKV cases per country/territory from January to June, 2016 normalized by total population. (b) The number of estimated travelers entering Miami during January to June, 2016 by method of travel. (c) The number of travelers and the reported ZIKV incidence rate for the country/territory of origin were used to estimate the proportion of infected travelers coming from each region with ZIKV in the Americas. (d) The observed number of weekly travel-associated ZIKV cases in Florida were plotted with the expected number of ZIKV-infected travelers (as estimated in panel c) coming from all of the Americas (grey line) and the regional contributions (colored areas). (e) The countries visited by the 1,016 travel-associated ZIKV cases diagnosed in Florida.
Figure 4
Figure 4. Southern Florida has a high potential for Aedes aegypti-borne virus outbreaks
The estimated number of travelers per month (circles) entering Florida cities via flights and cruise ships were plotted with estimated relative Ae. aegypti abundance. Only cities receiving >10,000 passengers per month are shown. Relative Ae. aegypti abundance for every month is shown in Extended Data Fig. 1d.

Comment in

Similar articles

Cited by

References

    1. Zika virus and complications. World Health Organization; [Accessed: 1st November 2016]. Available at: http://www.who.int/features/qa/zika/en/
    1. Lazear HM, Diamond MS. Zika Virus: New Clinical Syndromes and Its Emergence in the Western Hemisphere. J Virol. 2016;90:4864–4875. - PMC - PubMed
    1. Likos A, et al. Local Mosquito-Borne Transmission of Zika Virus - Miami-Dade and Broward Counties, Florida, June-August 2016. MMWR Morb Mortal Wkly Rep. 2016;65:1032–1038. - PubMed
    1. Mosquito-Borne Disease Surveillance. Florida Department of Health; [Accessed: 10th January 2017]. Available at: http://www.floridahealth.gov/diseases-and-conditions/mosquito-borne-dise....
    1. Hennessey M, Fischer M, Staples JE. Zika Virus Spreads to New Areas — Region of the Americas, May 2015–January 2016. MMWR Morb Mortal Wkly Rep. 2016;65:1–4. - PubMed

Publication types