Deconstructing Olfactory Stem Cell Trajectories at Single-Cell Resolution
- PMID: 28506465
- PMCID: PMC5484588
- DOI: 10.1016/j.stem.2017.04.003
Deconstructing Olfactory Stem Cell Trajectories at Single-Cell Resolution
Abstract
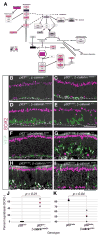
A detailed understanding of the paths that stem cells traverse to generate mature progeny is vital for elucidating the mechanisms governing cell fate decisions and tissue homeostasis. Adult stem cells maintain and regenerate multiple mature cell lineages in the olfactory epithelium. Here we integrate single-cell RNA sequencing and robust statistical analyses with in vivo lineage tracing to define a detailed map of the postnatal olfactory epithelium, revealing cell fate potentials and branchpoints in olfactory stem cell lineage trajectories. Olfactory stem cells produce support cells via direct fate conversion in the absence of cell division, and their multipotency at the population level reflects collective unipotent cell fate decisions by single stem cells. We further demonstrate that Wnt signaling regulates stem cell fate by promoting neuronal fate choices. This integrated approach reveals the mechanisms guiding olfactory lineage trajectories and provides a model for deconstructing similar hierarchies in other stem cell niches.
Keywords: HBC; Wnt; branching lineage; horizontal basal cell; lineage trajectory; olfactory epithelium; scRNA-seq; stem cells.
Copyright © 2017 Elsevier Inc. All rights reserved.
Figures

Similar articles
-
Horizontal basal cells are multipotent progenitors in normal and injured adult olfactory epithelium.Stem Cells. 2008 May;26(5):1298-306. doi: 10.1634/stemcells.2007-0891. Epub 2008 Feb 28. Stem Cells. 2008. PMID: 18308944 Free PMC article.
-
Wnt-responsive Lgr5⁺ globose basal cells function as multipotent olfactory epithelium progenitor cells.J Neurosci. 2014 Jun 11;34(24):8268-76. doi: 10.1523/JNEUROSCI.0240-14.2014. J Neurosci. 2014. PMID: 24920630 Free PMC article.
-
Olfactory horizontal basal cells demonstrate a conserved multipotent progenitor phenotype.J Neurosci. 2004 Jun 23;24(25):5670-83. doi: 10.1523/JNEUROSCI.0330-04.2004. J Neurosci. 2004. PMID: 15215289 Free PMC article.
-
Creating Lineage Trajectory Maps Via Integration of Single-Cell RNA-Sequencing and Lineage Tracing: Integrating transgenic lineage tracing and single-cell RNA-sequencing is a robust approach for mapping developmental lineage trajectories and cell fate changes.Bioessays. 2018 Aug;40(8):e1800056. doi: 10.1002/bies.201800056. Epub 2018 Jun 26. Bioessays. 2018. PMID: 29944188 Free PMC article. Review.
-
In-vivo differentiation of adult hematopoietic stem cells from a single-cell point of view.Curr Opin Hematol. 2020 Jul;27(4):241-247. doi: 10.1097/MOH.0000000000000587. Curr Opin Hematol. 2020. PMID: 32398457 Review.
Cited by
-
TrajectoryGeometry suggests cell fate decisions can involve branches rather than bifurcations.NAR Genom Bioinform. 2024 Oct 8;6(4):lqae139. doi: 10.1093/nargab/lqae139. eCollection 2024 Sep. NAR Genom Bioinform. 2024. PMID: 39380945 Free PMC article.
-
Mechanisms underlying pre- and postnatal development of the vomeronasal organ.Cell Mol Life Sci. 2021 Jun;78(12):5069-5082. doi: 10.1007/s00018-021-03829-3. Epub 2021 Apr 19. Cell Mol Life Sci. 2021. PMID: 33871676 Free PMC article. Review.
-
clusterExperiment and RSEC: A Bioconductor package and framework for clustering of single-cell and other large gene expression datasets.PLoS Comput Biol. 2018 Sep 4;14(9):e1006378. doi: 10.1371/journal.pcbi.1006378. eCollection 2018 Sep. PLoS Comput Biol. 2018. PMID: 30180157 Free PMC article.
-
Nasal Placode Development, GnRH Neuronal Migration and Kallmann Syndrome.Front Cell Dev Biol. 2019 Jul 11;7:121. doi: 10.3389/fcell.2019.00121. eCollection 2019. Front Cell Dev Biol. 2019. PMID: 31355196 Free PMC article.
-
Notch signaling determines cell-fate specification of the two main types of vomeronasal neurons of rodents.Development. 2022 Jul 1;149(13):dev200448. doi: 10.1242/dev.200448. Epub 2022 Jul 4. Development. 2022. PMID: 35781337 Free PMC article.
References
-
- Ali S, Mohs A, Thomas M, Klare J, Ross R, Schmitz ML, Martin MU. The Dual Function Cytokine IL-33 Interacts with the Transcription Factor NF- B To Dampen NF- B-Stimulated Gene Transcription. The Journal of Immunology. 2011;187:1609–1616. - PubMed
-
- Bolstad BM, Irizarry RA, Astrand M, Speed TP. A comparison of normalization methods for high density oligonucleotide array data based on variance and bias. Bioinformatics. 2003;19:185–193. - PubMed
-
- Brault V, Moore R, Kutsch S, Ishibashi M, Rowitch DH, McMahon AP, Sommer L, Boussadia O, Kemler R. Inactivation of the beta-catenin gene by Wnt1-Cre-mediated deletion results in dramatic brain malformation and failure of craniofacial development. Development. 2001;128:1253–1264. - PubMed
Publication types
MeSH terms
Grants and funding
LinkOut - more resources
Full Text Sources
Other Literature Sources
Molecular Biology Databases

