Aquaporin 4-Mediated Glutamate-Induced Astrocyte Swelling Is Partially Mediated through Metabotropic Glutamate Receptor 5 Activation
- PMID: 28503134
- PMCID: PMC5408017
- DOI: 10.3389/fncel.2017.00116
Aquaporin 4-Mediated Glutamate-Induced Astrocyte Swelling Is Partially Mediated through Metabotropic Glutamate Receptor 5 Activation
Abstract
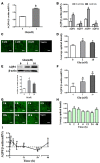
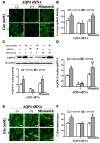
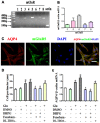
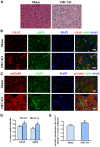
Astrocytes are one of the most abundant cell types in the mammalian central nervous system (CNS), and astrocyte swelling is the primary event associated with brain edema. Glutamate, the principal excitatory amino acid neurotransmitter in the CNS, is released at high levels after brain injury including cerebral ischemia. This leads to astrocyte swelling, which we previously demonstrated is related to metabotropic glutamate receptor (mGluR) activation. Aquaporin 4 (AQP4), the predominant water channel in the brain, is expressed in astrocyte endfeet and plays an important role in brain edema following ischemia. Studies recently showed that mGluR5 is also expressed on astrocytes. Therefore, it is worth investigating whether AQP4 mediates the glutamate-induced swelling of astrocytes via mGluR5. In the present study, we found that 1 mM glutamate induced astrocyte swelling, quantified by the cell perimeter, but it had no effect on astrocyte viability measured by the cell counting kit-8 (CCK-8) and lactate dehydrogenase (LDH) assays. Quantitative reverse transcription polymerase chain reaction analyses revealed that AQP4, among AQP1, 4, 5, 9 and 11, was the main molecular expressed in cultured astrocytes. Glutamate-induced cell swelling was accompanied by a concentration-dependent change in AQP4 expression. Furthermore, RNAi technology revealed that AQP4 gene silencing inhibited glutamate-induced astrocyte swelling. Moreover, we found that mGluR5 expression was greatest among the mGluRs in cultured astrocytes and was co-expressed with AQP4. Activation of mGluR5 in cultured astrocytes using (S)-3,5-dihydroxyphenylglycine (DHPG), an mGluR5 agonist, mimicked the effect of glutamate. This effect was abolished by co-incubation with the mGluR5 antagonist fenobam but was not influenced by DL-threo-β-benzyloxyaspartic acid (DL-TBOA), a glutamate transporter inhibitor. Finally, experiments in a rat model of transient middle cerebral artery occlusion (tMCAO) revealed that co-expression of mGluR5 and AQP4 was increased in astrocyte endfeet around capillaries in the penumbra, and this was accompanied by brain edema. Collectively, these results suggest that glutamate induces cell swelling and alters AQP4 expression in astrocytes via mGluR5 activation, which may provide a novel approach for the treatment of edema following brain injury.
Keywords: aquaporin 4; astrocyte; glutamate; metabotropic glutamate receptor 5; swelling.
Figures


Similar articles
-
Methylene blue ameliorates brain edema in rats with experimental ischemic stroke via inhibiting aquaporin 4 expression.Acta Pharmacol Sin. 2021 Mar;42(3):382-392. doi: 10.1038/s41401-020-0468-5. Epub 2020 Jul 14. Acta Pharmacol Sin. 2021. PMID: 32665706 Free PMC article.
-
The protective effects of methylene blue on astrocytic swelling after cerebral ischemia-reperfusion injuries are mediated by Aquaporin-4 and metabotropic glutamate receptor 5 activation.Heliyon. 2024 Apr 12;10(8):e29483. doi: 10.1016/j.heliyon.2024.e29483. eCollection 2024 Apr 30. Heliyon. 2024. PMID: 38644842 Free PMC article.
-
Aquaporin-4 expression in cultured astrocytes after fluid percussion injury.J Neurotrauma. 2011 Mar;28(3):371-81. doi: 10.1089/neu.2010.1705. J Neurotrauma. 2011. PMID: 21204635
-
Application of Novel Therapeutic Agents for CNS Injury: NAAG Peptidase Inhibitors.In: Kobeissy FH, editor. Brain Neurotrauma: Molecular, Neuropsychological, and Rehabilitation Aspects. Boca Raton (FL): CRC Press/Taylor & Francis; 2015. Chapter 38. In: Kobeissy FH, editor. Brain Neurotrauma: Molecular, Neuropsychological, and Rehabilitation Aspects. Boca Raton (FL): CRC Press/Taylor & Francis; 2015. Chapter 38. PMID: 26269888 Free Books & Documents. Review.
-
Three distinct roles of aquaporin-4 in brain function revealed by knockout mice.Biochim Biophys Acta. 2006 Aug;1758(8):1085-93. doi: 10.1016/j.bbamem.2006.02.018. Epub 2006 Mar 10. Biochim Biophys Acta. 2006. PMID: 16564496 Review.
Cited by
-
Pathway analysis of glutamate-mediated, calcium-related signaling in glioma progression.Biochem Pharmacol. 2020 Jun;176:113814. doi: 10.1016/j.bcp.2020.113814. Epub 2020 Jan 16. Biochem Pharmacol. 2020. PMID: 31954716 Free PMC article. Review.
-
Clinical Improvement in Depression and Cognitive Deficit Following Electroconvulsive Therapy.Diagnostics (Basel). 2023 Apr 28;13(9):1585. doi: 10.3390/diagnostics13091585. Diagnostics (Basel). 2023. PMID: 37174977 Free PMC article. Review.
-
Acorus tatarinowii Schott extract reduces cerebral edema caused by ischemia-reperfusion injury in rats: involvement in regulation of astrocytic NKCC1/AQP4 and JNK/iNOS-mediated signaling.BMC Complement Med Ther. 2020 Dec 9;20(1):374. doi: 10.1186/s12906-020-03168-z. BMC Complement Med Ther. 2020. PMID: 33298024 Free PMC article.
-
Methylene blue ameliorates brain edema in rats with experimental ischemic stroke via inhibiting aquaporin 4 expression.Acta Pharmacol Sin. 2021 Mar;42(3):382-392. doi: 10.1038/s41401-020-0468-5. Epub 2020 Jul 14. Acta Pharmacol Sin. 2021. PMID: 32665706 Free PMC article.
-
Recombinant soluble form of receptor for advanced glycation end products ameliorates microcirculation impairment and neuroinflammation after subarachnoid hemorrhage.Neurotherapeutics. 2024 Mar;21(2):e00312. doi: 10.1016/j.neurot.2023.e00312. Epub 2024 Jan 4. Neurotherapeutics. 2024. PMID: 38177024 Free PMC article.
References
-
- Arima H., Yamamoto N., Sobue K., Umenishi F., Tada T., Katsuya H., et al. . (2003). Hyperosmolar mannitol simulates expression of aquaporins 4 and 9 through a p38 mitogen-activated protein kinase-dependent pathway in rat astrocytes. J. Biol. Chem. 278, 44525–44534. 10.1074/jbc.m304368200 - DOI - PubMed
-
- Benesova J., Rusnakova V., Honsa P., Pivonkova H., Dzamba D., Kubista M., et al. . (2012). Distinct expression/function of potassium and chloride channels contributes to the diverse volume regulation in cortical astrocytes of GFAP/EGFP mice. PLoS One 7:e29725. 10.1371/journal.pone.0029725 - DOI - PMC - PubMed
LinkOut - more resources
Full Text Sources
Other Literature Sources

