. 2017 Dec;31(12):2732-2741.
doi: 10.1038/leu.2017.137. Epub 2017 May 9.

MicroRNA-146a reduces MHC-II expression via targeting JAK/STAT signaling in dendritic cells after stem cell transplantation

Affiliations

MicroRNA-146a reduces MHC-II expression via targeting JAK/STAT signaling in dendritic cells after stem cell transplantation

N Stickel et al. Leukemia. 2017 Dec.

Abstract

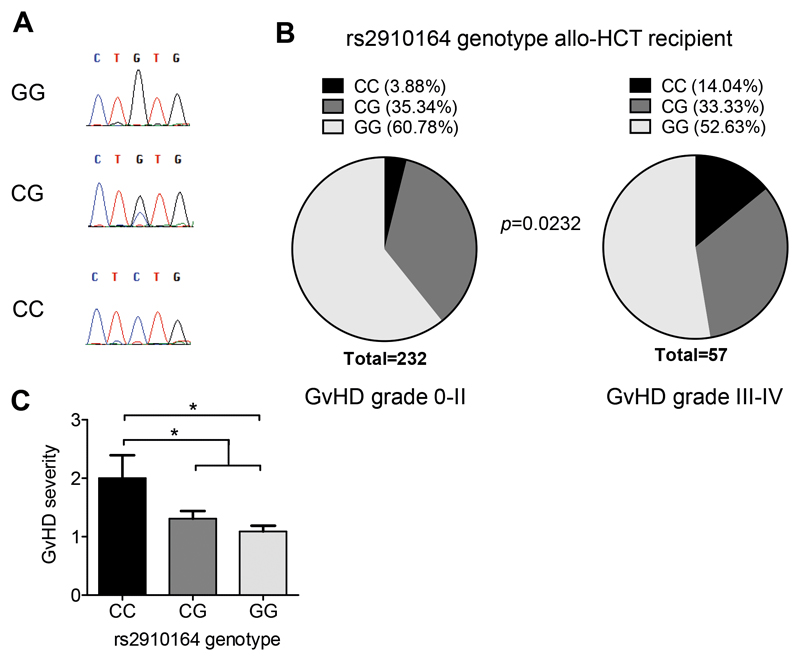
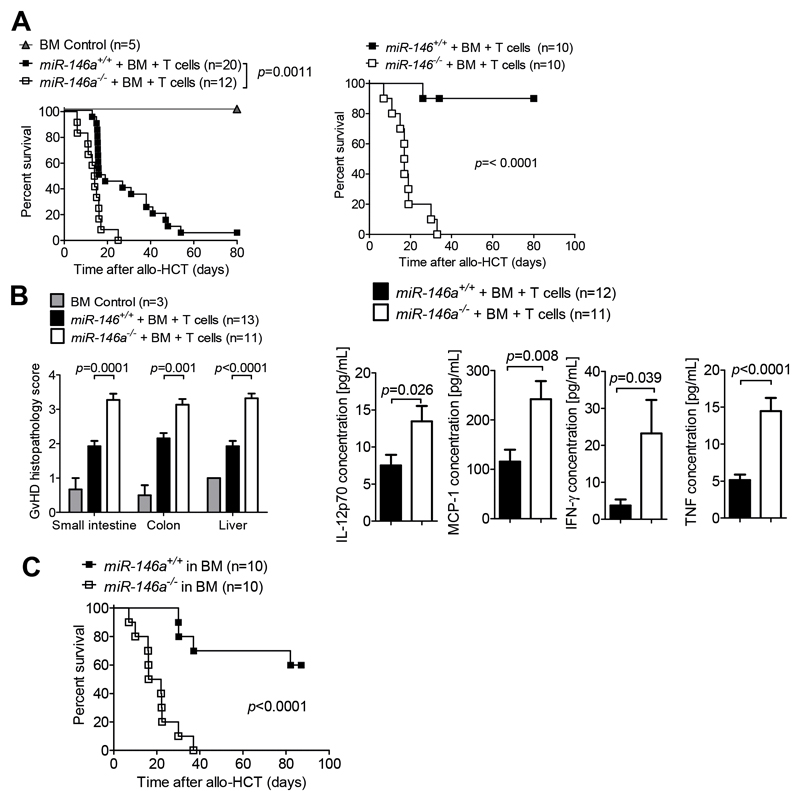
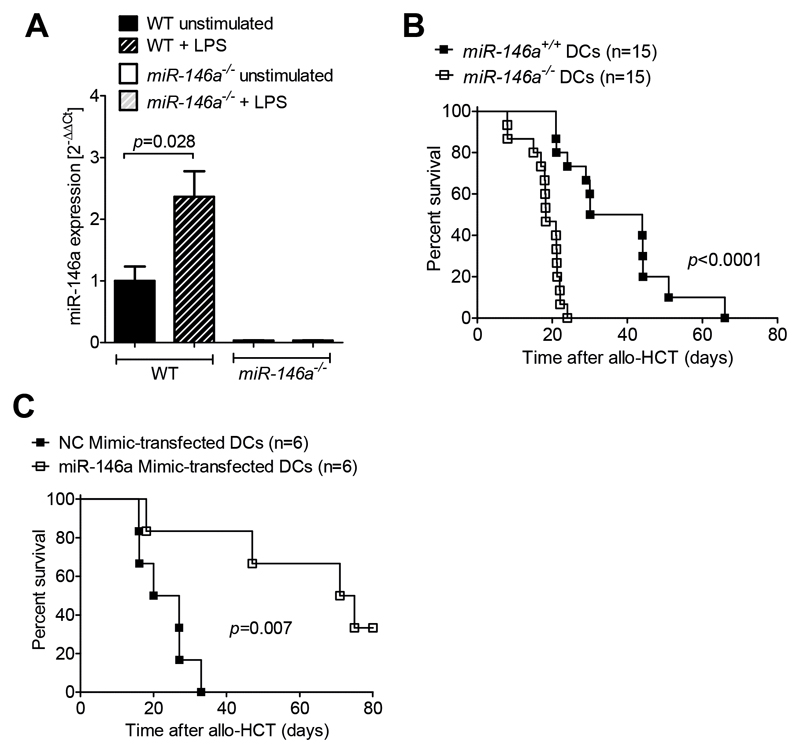
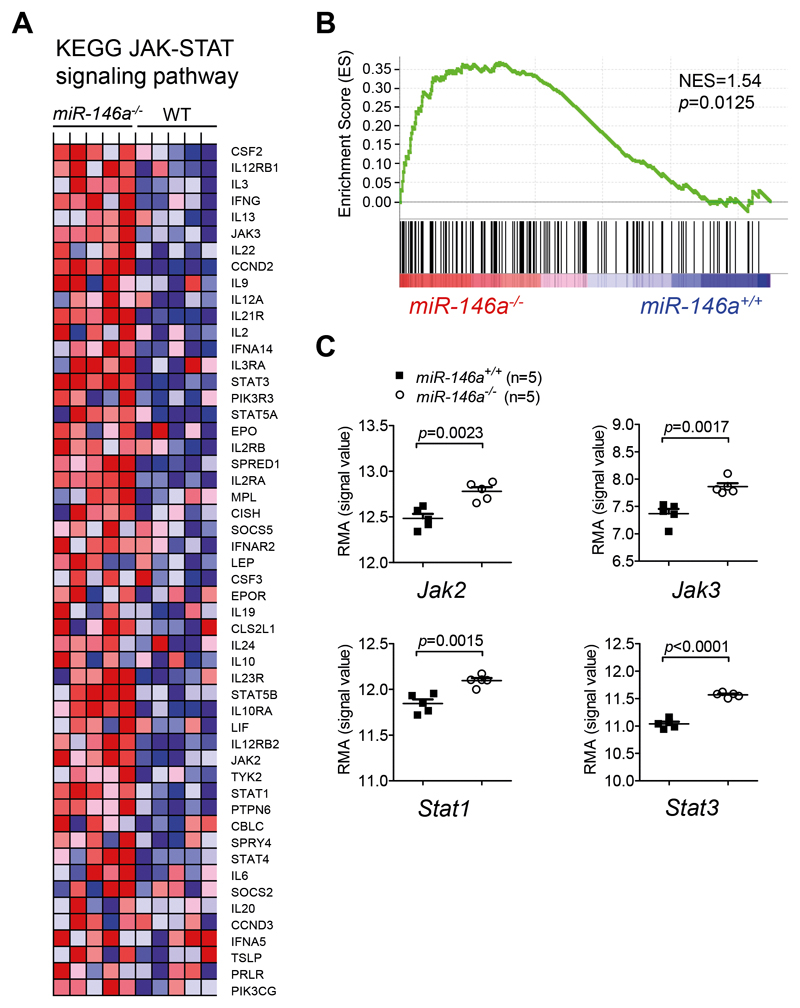
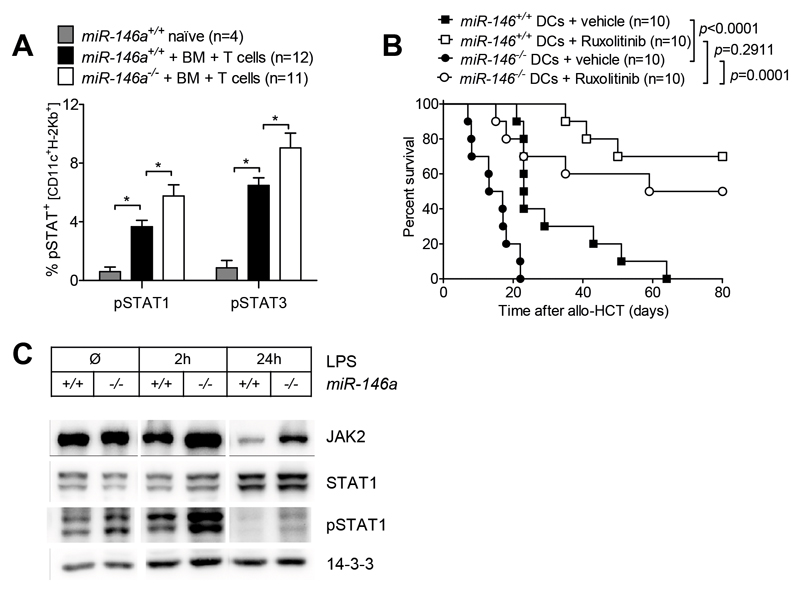
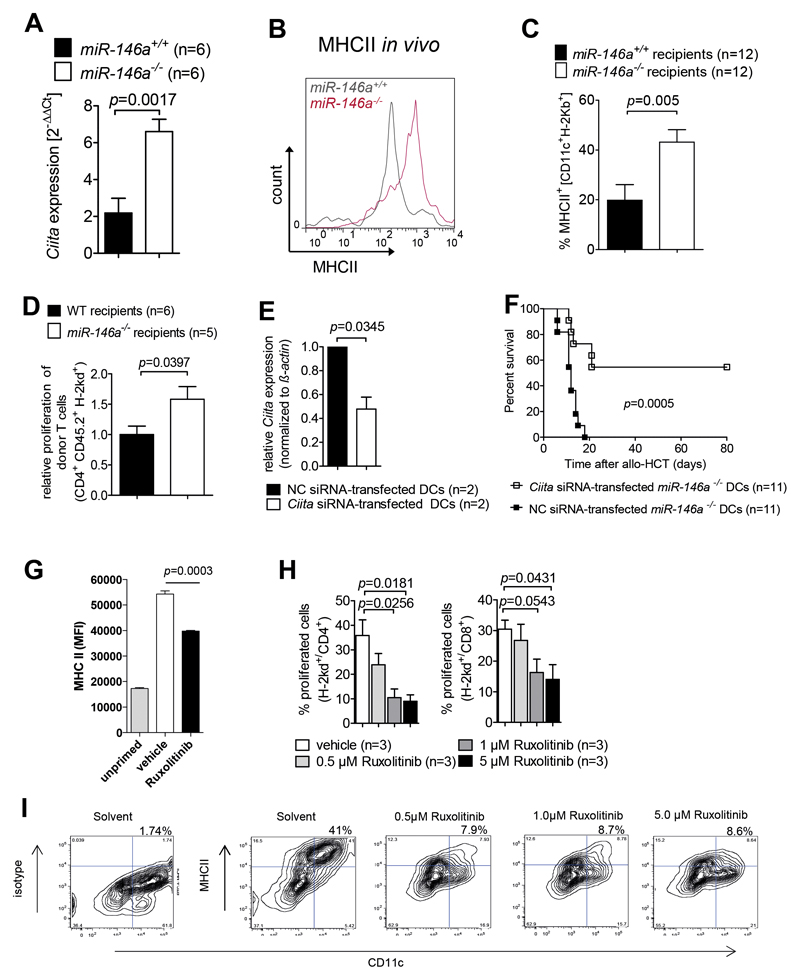
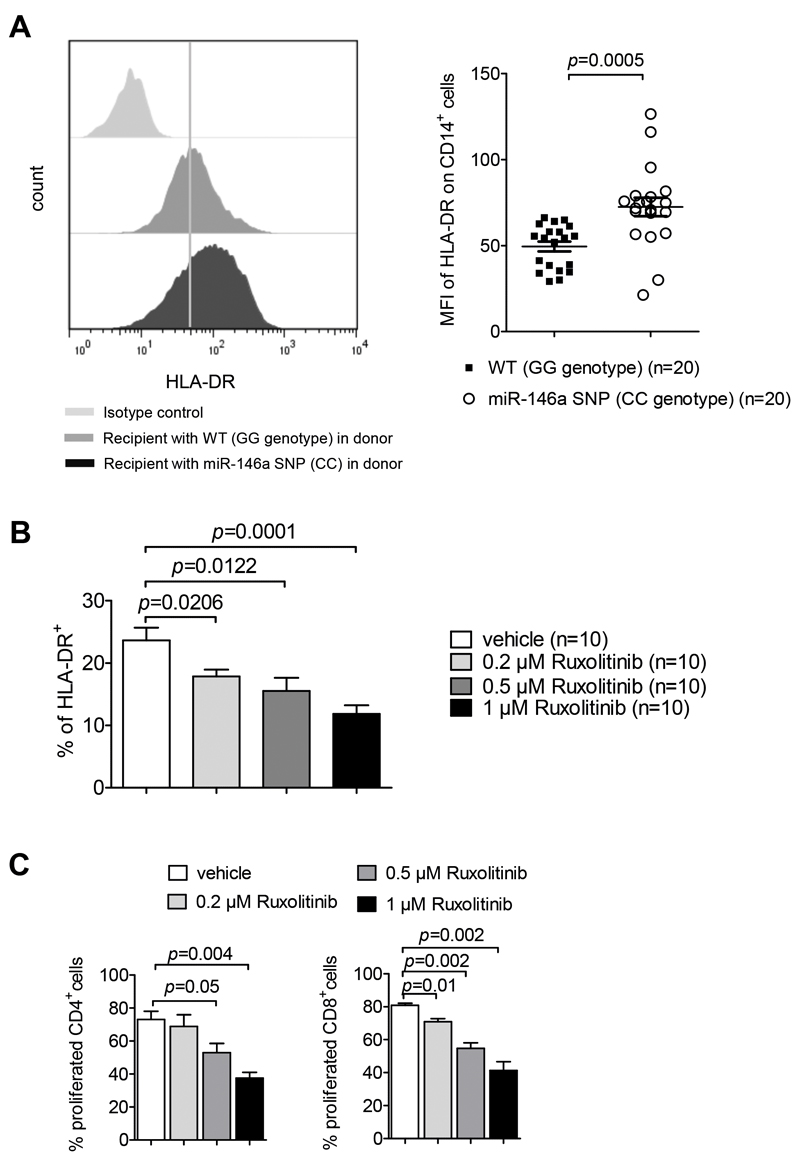
Acute Graft-versus-host disease (GVHD) is a major immunological complication after allogeneic hematopoietic cell transplantation and a better understanding of the molecular regulation of the disease could help to develop novel targeted therapies. Here we found that a G/C polymorphism within the human microRNA-146a (miR-146a) gene of transplant recipients, which causes reduced miR-146a levels, was strongly associated with the risk of developing severe acute GVHD (n=289). In mice, deficiency of miR-146a in the hematopoietic system or transfer of recipient-type miR-146a-/- dendritic cells (DCs) enhanced GVHD, while miR-146a mimic-transfected DCs ameliorated disease. Mechanistically, lack of miR-146a enhanced JAK2-STAT1 pathway activity, which led to higher expression of class II-transactivator (CIITA) and consecutively increased MHCII-levels on DCs. Inhibition of JAK1/2 or CIITA knockdown in DCs prevented miR-146a-/- DC-induced GVHD exacerbation. Consistent with our findings in mice, patients with the miR-146a polymorphism rs2910164 in hematopoietic cells displayed higher MHCII levels on monocytes, which could be targeted by JAK1/2 inhibition. Our findings indicate that the miR-146a polymorphism rs2910164 identifies patients at high risk for GVHD before allo-HCT. Functionally we show that miR-146a acts as a central regulator of recipient-type DC activation during GVHD by dampening the pro-inflammatory JAK-STAT/CIITA/MHCII axis, which provides a scientific rationale for early JAK1/2 inhibition in selected patients.


Conflict of interest statement

Conflict of interest statement: The authors have declared that no conflict of interest exists.

Figures

Figure 1
Figure 1. Host miR-146a SNP rs2910164 is associated with increased risk for severe acute GVHD
(A) Representative Sanger sequencing chromatograms from individual rs2910164 genotypes that were used to establish the qPCR genotype analysis are shown. (B) 289 allo-HCT recipients were analyzed for their rs2910164 SNP genotype using Taqman realtime PCR assays. Genotype frequencies for the group of recipients that developed no/mild GVHD (grade 0-II) or severe GVHD (grade III-IV) are depicted. The risk to develop severe GVHD was significantly increased in patients carrying the CC genotype. Fisher's exact test was used to analyze the contingency table. (C) Mean GVHD severity in the group of patients with CC genotype, CG genotype and GG genotype, respectively, was determined. Patients with a CC genotype developed more severe GVHD. Kruskal-Wallis test followed by Dunn's post hoc test was employed, * p<0.05.
Figure 2
Figure 2. MiR-146a deficiency of the host exacerbates GVHD
(A) miR-146a+/+ (WT) or miR-146a-/- mice (both C57BL/6 background) were lethally irradiated followed by allo-HCT with BM only (BM Control) or BM + BALB/c T cells. Left panel: BALB/c into C57BL/6 model, right panel FVB/NRj into C57BL/6 model (B) On d7 after allo HCT, the serum and the small intestine, colon and liver of miR-146a+/+ and miR-146a-/-recipient mice were isolated. Left panel: Tissues were scored for GVHD severity. Right panel: Inflammatory cytokines were measured in the serum. Data are pooled from 3 independent experiments. (C) Lethally irradiated WT C57BL/6 mice were transplanted with BM cells from a syngeneic miR 146a+/+ or miR-146a-/- C57BL/6 donor. After >30 days, the chimera were irradiated with 2x2.75 Gy and injected with 5x10⁶ BM cells and 5x10⁵ T cells from an allogeneic BALB/c donor, followed by a survival study. Data are pooled from 3 independent experiments.
Figure 3
Figure 3. LPS stimulation induces miR-146a expression and miR-146a-/- DCs exacerbate GVHD
(A) RNA was isolated from WT or miR-146a-/- BMDCs that were unstimulated or stimulated with 1 µg/mL LPS for 24h as indicated. MiR-146a expression was analyzed by qRT PCR. Data were pooled from 4 independent experiments. (B) Allo-HCT was performed as described for the BALB/c into C57BL/6 combination. Groups additionally received 2x10⁶ miR-146a+/+ or miR-146a-/- C57BL/6 BMDCs on the day of transplantation. Survival was monitored for 80 days. Data were pooled from 2 independent experiments. (C) Allo-HCT was performed as described for the BALB/c into C57BL/6 combination. Additionally, 2x10⁶ WT C57BL/6 BMDCs transfected with a miR-146a mimic or a Negative Control (NC) mimic were i.v. injected on d0.
Figure 4
Figure 4. Microarray and GSEA reveal increased expression of the JAK-STAT signaling pathway in miR-146a-/- DCs
(A-C) RNA was isolated from miR-146a+/+ or miR-146a-/- BMDCs stimulated with 100 ng/mL LPS for 24h on d8 of culture, and analyzed using GeneChip Mouse Gene 2.0 ST Arrays (Affymetrix). GSEA was used to identify gene sets that exhibited significant overlap with gene expression differences between miR-146a+/+ or miR-146a-/- BMDCs. (A) Heat map representation of microarray data showing the expression levels of the 52 core enrichment genes for the KEGG JAK-STAT signaling pathway (upregulated in miR-146a-/- DCs as compared to miR-146a+/+ DCs). Rows represent individual genes and columns represent samples. Range of colors (red to blue) shows the range of expression values (high to low). (B) Enrichment plot, showing enrichment of genes of the KEGG JAK-STAT signaling pathway in miR 146a-/- BMDCs as compared to miR 146a+/+ BMDCs. The enrichment profile is displayed as a green line. The score at the peak of the plot is the enrichment score (ES) for the JAK-STAT signaling gene set. The vertical black lines below the enrichment plot depict individual genes of the gene set. The genes that appear before or at the peak are defined as the core enrichment genes for this gene set. NES=normalized enrichment score. (C) Expression of key molecules of JAK-STAT signaling, including Jak2, Jak3, Stat1 and Stat3 is significantly higher in miR-146a-/- DCs, as analyzed by microarray.
Figure 5
Figure 5. MiR-146a regulates host DCs during GVHD by dampening JAK-STAT signaling
(A) Allo-HCT was performed as described for the BALB/c into C57BL/6 combination and recipient mice (miR-146a+/+ or miR-146a-/-) were sacrificed on d7. Untreated WT C57BL/6 mice served as naϊve control group. Splenocytes were isolated, stained for CD11c, H-2Kb, pSTAT1 and pSTAT3 and subjected to phospho-flow cytometry. Data were pooled from 2 independent experiments. (B) BMDCs (miR 146a-/- or miR 146a+/+) were pre-treated with 0.3 µM of JAK1/2 inhibitor (ruxolitinib) or vehicle control (DMSO) for 4h on d7 of culture. After extensive washing, 2x10⁶ pre-treated BMDCs were injected into lethally irradiated recipients (11 Gy) in combination with 5x10⁶ BALB/c BM cells and 5x10⁵ BALB/c T cells. Survival of recipient mice was monitored for 80 days. Data are pooled from 2 independent experiments. (C) BM derived DCs (miR 146a-/- or miR 146a+/+) were stimulated with 100 ng/mL LPS for different time periods as indicated. After cell lysis, total and phospho-protein levels of JAK2, STAT1 and pSTAT1 were determined by Western Blot.
Figure 6
Figure 6. MiR-146a deficient DCs display increased expression of CIITA which leads to enhanced MHCII expression on the cell surface
(A) RNA was isolated from miR-146a+/+ or miR-146a-/- BMDCs stimulated with 100 ng/mL LPS for 24h on d8 of culture. Ciita expression levels in RNA were analyzed by qRT-PCR. mRNA for CIITA was increased in miR-146a-/- BMDCs compared to miR-146a+/+ DCs. Data are pooled from 2 independent experiments. (B, C) Allo-HCT was performed as described for the BALB/c into C57BL/6 combination and recipient mice (miR-146a+/+ or miR-146a-/-) were sacrificed on d7. The amount of surface MHCII expression on miR-146a-/- or miR-146a+/+ CD11c+ DCs isolated from the spleens of allo-HCT recipients on d7 is shown. (B) Representative flow cytometry plot gated on CD11c+H 2Kb+ DCs. (C) The bar diagram shows data pooled from 2 independent experiments. (D) miR-146a+/+ (WT) or miR-146a-/- mice (both C57BL/6 background) were lethally irradiated followed by allo-HCT with BALB/c BM + BALB/c T cells. Donor T cell proliferation was determined by the extent of CellTrace™ Violet dye dilution. (E) Ciita levels were determined by qRT-PCR in miR-146a-/- C57BL/6 BMDCs transfected with Ciita siRNA or a negative control (NC) siRNA. Data are pooled from 2 independent experiments. (F) Allo-HCT was performed as described for the BALB/c into C57BL/6 combination. Groups additionally received either 2x10⁶ miR-146a-/- C57BL/6 BMDCs transfected with Ciita siRNA or 2x10⁶ miR-146a-/- C57BL/6 BMDCs transfected with a negative control (NC) siRNA on the day of transplantation. Survival was monitored for 80 days. Data were pooled from 2 independent experiments. (G) MHCII levels are shown on splenic DC isolated from mice that were fed twice via oral gavage either ruxolitinib or vehicle prior to (white and black column) or w/o (grey column) OVA/CpG priming for 20 hours. (H) The bar diagram shows the percentage of proliferated CD4 or CD8 T cells cocultured for 72h with BMDCs that were treated with ruxolitinib at the indicated concentrations for 24h, then washed and activated with LPS (during the activation phase no ruxolitinib was present). Data are pooled from 3 independent experiments. (I) The flow cytometry plots show the expression of MHCII on BMDCs that were treated 24h with ruxolitinib, then washed and activated with OVA+LPS (during the activation phase no ruxolitinib was present). The percentages of cells in the right upper quadrant are indicated. A representative staining of 3 independent experiments for each concentration of ruxolitinib is shown.
Figure 7
Figure 7. SNP rs2910164 leads to increased MHCII expression on CD14+ cells
(A) PBMCs of recipients transplanted with PBSC from donors carrying the CC genotype of SNP rs2910164 or the wildtype (GG) of rs2910164 were isolated by a Ficoll gradient and the amount of surface expression of HLA-DR on CD14+ cells was analyzed by flow cytometry. Representative histograms of HLA-DR expression and the median fluorescence intensity (MFI) of the HLA-DR expression on CD14+ cells is shown, data were pooled from 5 independent experiments. (B) Human moDCs were exposed to increasing concentrations of ruxolitinib and then activated with LPS. MHCII levels were determined by flow-cytometry, data were pooled from 3 independent experiments. (C) The bar diagram shows the percentage of proliferated CD4 or CD8 human T cells that were cocultured for 72h with moDCs that were treated with ruxolitinib at the indicated concentrations, then washed and activated with LPS. Data are pooled from 3 independent experiments, the same moDC-T cell donor combination was used in all experiments.

Similar articles

Cited by

References

    1. Lim LP, Lau NC, Garrett-Engele P, Grimson A, Schelter JM, Castle J, et al. Microarray analysis shows that some microRNAs downregulate large numbers of target mRNAs. Nature. 2005 Feb 17;433(7027):769–773. - PubMed
    1. Stickel N, Prinz G, Pfeifer D, Hasselblatt P, Schmitt-Graeff A, Follo M, et al. MiR-146a regulates the TRAF6/TNF-axis in donor T cells during GVHD. Blood. 2014 Oct 16;124(16):2586–2595. - PubMed
    1. Taganov KD, Boldin MP, Chang KJ, Baltimore D. NF-kappaB-dependent induction of microRNA miR-146, an inhibitor targeted to signaling proteins of innate immune responses. Proceedings of the National Academy of Sciences of the United States of America. 2006 Aug 15;103(33):12481–12486. - PMC - PubMed
    1. Nahid MA, Pauley KM, Satoh M, Chan EK. miR-146a is critical for endotoxin-induced tolerance: Implication in innate immunity. The Journal of biological chemistry. 2009 Dec 11;284(50):34590–34599. - PMC - PubMed
    1. Labbaye C, Testa U. The emerging role of MIR-146A in the control of hematopoiesis, immune function and cancer. Journal of hematology & oncology. 2012;5:13. - PMC - PubMed

Publication types