Review
. 2017 May 9;114(19):E3830-E3838.
doi: 10.1073/pnas.1617782114. Epub 2017 Apr 24.

Astrocytes locally translate transcripts in their peripheral processes

Affiliations
Review

Astrocytes locally translate transcripts in their peripheral processes

Kristina Sakers et al. Proc Natl Acad Sci U S A. .

Abstract

Local translation in neuronal processes is key to the alteration of synaptic strength necessary for long-term potentiation, learning, and memory. Here, we present evidence that regulated de novo protein synthesis occurs within distal, perisynaptic astrocyte processes. Astrocyte ribosomal proteins are found adjacent to synapses in vivo, and immunofluorescent detection of peptide elongation in acute slices demonstrates robust translation in distal processes. We have also developed a biochemical approach to define candidate transcripts that are locally translated in astrocyte processes. Computational analyses indicate that astrocyte-localized translation is both sequence-dependent and enriched for particular biological functions, such as fatty acid synthesis, and for pathways consistent with known roles for astrocyte processes, such as GABA and glutamate metabolism. These transcripts also include glial regulators of synaptic refinement, such as Sparc Finally, the transcripts contain a disproportionate amount of a binding motif for the quaking RNA binding protein, a sequence we show can significantly regulate mRNA localization and translation in the astrocytes. Overall, our observations raise the possibility that local production of astrocyte proteins may support microscale alterations of adjacent synapses.

Keywords: RNA-sequencing; TRAP; astrocyte; local translation; synapse.


Conflict of interest statement

Conflict of interest statement: J.D.D. has received royalties for the translating ribosome affinity purification (TRAP) method.

Figures

Fig. 1.
Fig. 1.
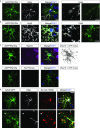
EM and STORM show astrocyte ribosomes in close proximity to synapses, in vivo. (A) Representative electron micrographs of DAB-labeled EGFP/RPL10A (arrowheads) in astrocyte processes (green) near cortical synapses (axon = blue and postsynaptic density = red). (Scale bars, 500 nm.) (B) STORM imaging showing an EGFP/RPL10A (green) filled astrocyte process proximal to synapses [as illustrated, these are defined by apposition of Bassoon (red) and Homer (blue)]. Inset of box on Left, and side view is a 90° rotation of a second synapses, again showing EGFP/RPL10A puncta surrounding a synapse.
Fig. S1.
Fig. S1.
Subcellular localization in cortical astrocytes shows ribosomal proteins and mRNA in peripheral processes. (A and B) Confocal IF of a cortical astrocyte, stained with Gfap (A) or Aqp4 (B) (white). EGFP/RPL10A (green) shows ribosomal tag extending throughout astrocyte, past Gfap+ processes (yellow dashed line) and within fine processes highlighted by Aqp4. Arrowheads in A indicate presence of eGFP-tagged ribosomes beyond GFAP-labeled processes. (Scale bar, 10 μm.) (C) Examination of localization of Rps16 by confocal reveals detectable Rps16 (violet/white) in fine processes. Rps16 is also found robustly in adjacent neurons, as expected (*). Therefore, the presence of GFP signal was used to mask all nonastrocyte pixels, and a binary image created showing GFP+ pixels that also contained Rps16 signal. This approach allows for identification of Rps16 labeling specifically in the astrocyte even in the presence of Rps16-labeling in adjacent cells. A tissue section processed in parallel, but omitting Rps16 primary antibody, demonstrates absence of signal in the astrocyte. (Scale bar, 10 μm.) (D) Confocal IF of a GFP-labeled astrocyte (Fig. S2) shows extension of Slc1a2 (red) FISH into fine, Gfap (white) peripheral processes. Arrowheads in D indicate colocalization of mRNA and GFP in distal PAPs. (Magnification, 100 ×.)
Fig. S2.
Fig. S2.
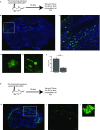
Viral sparse astrocyte labeling. (A) P2 mice are injected intracranially with AAV9:CBA-IRES-GFP virus (titer 1012) and then returned to the dam until being killed at P21. (B) Sample coronal slice showing GFP virus (green), DAPI (blue). (C) Inset of B, demonstrating the region where only astrocytes are labeled in a sparse manner. (D) Representative filled astrocyte. (E) Representative filled neuron. (F) Quantification of GFP-filled astrocytes and neurons across two mice and three slices; P value shown is the result of a two-sided t test. (G) P2 mice are injected intracranially with AAV9-GFAP-mCFP virus (titer 1012) and then returned to the dam until being killed at P21. (H) Sample coronal slice showing mCFP virus (green), DAPI (blue). (I) Inset of H. (J) Representative filled astrocyte. (Magnification, B, C, H, and I, 10 ×; D, E, and J, 20 ×.)
Fig. 2.
Fig. 2.
Peripheral ribosomes are actively translating in astrocytes. (A) Cartoon diagram of puromycylation experiments. Acute slices (cartooned in gray) are incubated with puromycin (red hexagon) which attaches to the growing peptide (cartooned by amino acid abbreviations in circles). Slices are then prepared for IF detection of puromycin. (B) Maximum projection superresolution SIM to detect puromycylation (red) of synthesizing proteins in a GFP-labeled astrocyte shows translation occurs in peripheral processes, and is blocked by pretreatment with anisomycin. Arrowheads indicate puromycylated peptides colocalized with GFP-positive peripheral astrocyte processes. (Scale bar, 10 μm.) (Magnification, 100 ×.) (C) Quantification of puromycin intensity (only puromycin pixels that were in astrocytes labeled with GFP were measured) at increasing radii from the nucleus indicates robust translation occurs in PAPs. Repeated-measures ANOVA revealed main effects of condition F(2, 138) = 9.694, P = 0.0001 and distance F(8, 1,104) = 19.023, P < 2E-16 with a significant interaction between condition and distance F(16, 1,104) = 2.019, P = 0.01. Data represented as mean ± SEM. Asterisks represent one-sided t tests, post hoc. ****P < 0.001, ***P < 0.005, *P < 0.05. n (cells) = 54 (puromycin), 48 (anisomycin+puromycin).
Fig. S3.
Fig. S3.
Puromycylation detection and quantification method. (A) Example of masking for quantification of peripheral puromycylation (confocal IF). As expected, robust translation also occurs in adjacent neurons (*). Therefore, the presence of GFP signal was used to mask all nonastrocyte pixels, and a binary image created showing GFP+ pixels that also contained Puro-IF signal (GFP+Puro) for all downstream quantification. (B) Illustration of method for quantification of relative amount of translation at increasing distance from the astrocyte nucleus. A nucleus of a GFP+ astrocyte is selected and thresholded (Center Left). A series of Sholl-like concentric rings are demarked for quantification (red rings). All Puro-IF outside of GFP+ area is masked, and Puro-IF+ area within each ring is measured (Center Right). Intensity of Puro-IF within each GFP+ pixel is also measured (Right). (Scale bar, 20 μm.)
Fig. 3.
Fig. 3.
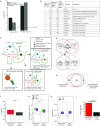
Identification of peripherally enriched transcripts. (A) Diagram of experimental steps in PAP-TRAP and comparison samples for RNA-seq. (B) Representative immunoblots for input and SN fraction confirms enrichment of synaptic and PAP proteins, depletion of nuclear proteins (LaminB2), and presence of EGFP/RPL10A. (C and D) cpm plots of astrocyte and neuron transcripts after TRAP from the cortex (C) or from the SN fraction (D). Lines denote twofold enrichment/depletion. We detect robust enrichment for sets of ∼200 previously detected (60) astrocyte-enriched transcripts (green dots), and substantial, although not complete, depletion of ∼200 previously detected (60) neuron-enriched transcripts (blue dots) in the current cortex-TRAP experiment. This degree of enrichment and depletion is typical for TRAP (61, 62). (E) Diagram of analytical strategy for defining PAP-enriched/depleted transcripts. (F) Examples of PAP-enriched transcripts, including those related to glutamate metabolism (Slc1a2, Slc1a3, Glul), fatty acid synthesis (Fads, Scd), and interesting signaling molecules (Ptch1, Sparc, Ntsr2).
Fig. S4.
Fig. S4.
Bioanalyzer confirms RNA quality from cortex-TRAP and PAP-TRAP samples. (A) PicoChip electrophoresis for representative samples, marker is highlighted in green. (B) Fluorescent trace visualization of PicoChip electrophoresis for cortex-TRAP and PAP-TRAP. Ribosomal RNAs from both subunits are captured.
Fig. S5.
Fig. S5.
A small number of neuronal transcripts are bound to peripheral astrocyte ribosomes: in vitro or in vivo mechanism? (A) Overlaps of PAP-TRAP–enriched transcripts with two studies demonstrating selective enrichment of certain mRNAs in astrocyte processes. P values are the result of one-sided Fisher’s exact tests. Random gene lists were selected by randomly picking 200 genes from all counted in the cortex-input samples. (B) From PAP-TRAP–enriched transcripts, shown are examples of many transcripts that are strong candidates to be locally translated in neurons (Camk2a, Shanks), or are known to be locally translated in oligodendrocytes (e.g., Mbp) (66). (C) Illustrations of some of the possible alternate models for these unexpected results. (Left) Interactions in solution between RNA granules originally from neurons with captured granules from astrocytes in vitro, mediated by the disordered nature of domains in many RBPs (67). (Right) Low-level exchange of mRNA or ribosomal components between adjacent processes, or perhaps following astrocyte phagocytosis of synapses (29), in vivo. Regardless, if needed, this 15% can be removed from the PAP-enriched list computationally (provided as Dataset S4), and all of the major conclusions regarding the remaining PAP-enriched genes are still supported. (D) Roughly 15% of PAP-enriched transcripts from Dataset S2, which show clear enrichment by PAP-TRAP, are depleted when examining the cortex-TRAP vs. -input comparison, suggesting they are not present on most astrocyte ribosomes in the cell body, as illustrated by a Venn diagram. (E) 77% of the original PAP GO terms survive at Benjamini–Hochberg-corrected P < 0.005. (F) Quantification of expression of PAP-enriched and PAP-depleted transcripts indicates PAP-depleted transcripts have lower median expression in cortical astrocytes (Wilcoxon test, Benjamini–Hochberg-corrected, *P < 0.0001). (G) Quantification of length of PAP-enriched and depleted transcripts indicates PAP-enriched transcripts are longer (Wilcoxon test, Benjamini–Hochberg-corrected, ****P < 0.0001, *P < 0.05). (H) RNA structure-score (minimum free-energy of most stable predicted structure, normalized to length), indicates PAP-enriched transcripts have more stable 3′UTR secondary structures (Wilcoxon test, Benjamini–Hochberg-corrected, *P < 0.05, lower values are more stable). (I) PAP-TRAP candidates without neuronal-derived transcripts are still significantly enriched for the presence of a QRE, as expected because neurons do not express Qk (43).
Fig. 4.
Fig. 4.
Pathway and sequence analysis on PAP-enriched transcripts. (A) Representative significant GO terms for PAP-enriched transcripts, hypergeometric test with Benjamini–Hochberg correction. (B) Quantification of expression of PAP-enriched vs. -depleted transcripts indicates PAP-depleted transcripts have lower median expression in cortical astrocytes (Wilcoxon test, Benjamini–Hochberg-corrected, *P < 0.05). (C) Quantification of length of PAP-enriched and depleted transcripts indicates PAP-enriched transcripts have longer 3′UTRs (Wilcoxon test, Benjamini–Hochberg-corrected, ****P < 0.0001). (D) RNA structure-score (minimum free energy of most stable predicted structure, normalized to length), indicates PAP-enriched transcripts have more stable 3′UTR secondary structures (Wilcoxon test, Benjamini–Hochberg-corrected, **P < 0.01, lower values are more stable).
Fig. S6.
Fig. S6.
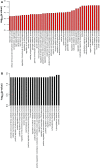
Pathway analysis using GO for PAP enriched transcripts. (A) All enriched GO terms for PAP-enriched transcripts, P < 0.005, hypergeometric test with Benjamini–Hochberg correction. (B) All enriched GO terms for PAP-depleted transcripts, P < 0.05, hypergeometric test with Benjamini–Hochberg correction.
Fig. S7.
Fig. S7.
Nucleotide composition does not differ between PAP-enriched and depleted transcripts. (A–D) Percent composition of each nucleotide for 5′UTR (white), coding sequence (CDs, green), and 3′UTR (purple) in PAP-enriched and depleted lists. P > 0.05, Wilcoxon test with Benjamini–Hochberg. (E) GC percentage. P > 0.05, Wilcoxon test with Benjamini–Hochberg correction.
Fig. 5.
Fig. 5.
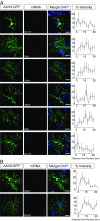
mRNA localization of PAP-TRAP candidates, in vivo. FISH on GFP-labeled astrocytes demonstrates nonsimilar patterns within and between PAP-enriched (A) and depleted (B) mRNAs. Percent intensity at increasing distances from the nucleus is plotted for each probe. (Scale bars, 10 µm.) Error bars represent ± SEM. Cortical astrocytes were labeled as described in Fig. S2. n = Cpe (19 cells), Dynlrb1 (17 cells), Gfap (29 cells), Hsbp1 (17 cells), Mertk (15 cells), Slc1a2 (14 cells), Slc1a3 (25 cells), Sparc (16 cells), with cells collected across three independent animals.
Fig. S8.
Fig. S8.
mRNA localization of additional PAP-TRAP candidates, in vivo. (A and B) FISH on GFP-labeled astrocytes demonstrates nonsimilar patterns within and between PAP-enriched (A) and -depleted (B) mRNAs. Percent intensity at increasing distances from the nucleus is plotted for each probe. Error bars represent ± SEM. Cortical astrocytes were labeled as described in Fig. S2. Images are representative of three independent experiments with each probe. n = Apoe (9 cells), Clu (8 cells), Glul (8 cells), S100b (11 cells), Sepw1 (10 cells). (C) Representative image of “no probe” condition shows no background FISH signal. (Scale bars, 10 µm.)
Fig. 6.
Fig. 6.
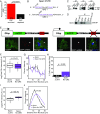
Qk promotes nuclear export of Sparc mRNA and controls its translational efficiency. (A) Percent of transcripts in PAP-enriched/depleted lists that contain the QRE core and half sites NACUAAY-N(1,20)-YAAY, one-tailed Fisher’s exact test. (B) Sparc 3′UTR cDNA sequences that contain putative QREs, numbers indicate position (NM_001290817). (C) Qk isoforms 5, 6, and 7 were immunoprecipitated from adult mouse brain and isolated material was analyzed on a Western blot with Qk antibodies. Total mouse IgG was used in negative IP controls. (D) RT-PCR of Sparc after isolation of Qk or mouse IgG-bound RNA. (E) Cartoon schematic of viral constructs with representative confocal images from each condition. Arrows indicate representative examples of RNA localized in the periphery (Sparc 3′UTR) vs. soma/nucleus (Sparc no QRE) of the cell. (Scale bar, 10 µm.) (F) Boxplots of FISH intensity throughout the entire cell, student’s two-tailed t test. (G) Percent intensity of FISH signal across distance, normalized within cell. Repeated-measures ANOVA main effect of distance: F(1, 1,240) = 47.132, P = 1.05E-11. (H) Number of cells containing nuclear RNA foci, one-tailed Fisher’s exact test. (I) CFP protein intensity in each cell, Wilcoxon rank-sum test. (F–H) n = = 67 (Sparc), 71 (Sparc no QRE); (I) n = 53 (Sparc), 46 (Sparc no QRE). (J) Percent intensity of CFP protein across distance, normalized within cell. Repeated-measures ANOVA main effects of condition F(1, 97) = 6.025, P = 0.0159 and distance F(1, 97) = 11.21, P = 0.0012 and a significant interaction between them F(1, 97) = 30.08, P = 3.29E-7.

Similar articles

Cited by

References

    1. Araque A, Parpura V, Sanzgiri RP, Haydon PG. Tripartite synapses: Glia, the unacknowledged partner. Trends Neurosci. 1999;22:208–215. - PubMed
    1. Ullian EM, Sapperstein SK, Christopherson KS, Barres BA. Control of synapse number by glia. Science. 2001;291:657–661. - PubMed
    1. Mauch DH, et al. CNS synaptogenesis promoted by glia-derived cholesterol. Science. 2001;294:1354–1357. - PubMed
    1. Pfrieger FW, Barres BA. Synaptic efficacy enhanced by glial cells in vitro. Science. 1997;277:1684–1687. - PubMed
    1. Jourdain P, et al. Glutamate exocytosis from astrocytes controls synaptic strength. Nat Neurosci. 2007;10:331–339. - PubMed

Publication types