. 2017 Aug;31(8):3309-3320.
doi: 10.1096/fj.201601097R. Epub 2017 Apr 20.

KCa1.1 channels regulate β1-integrin function and cell adhesion in rheumatoid arthritis fibroblast-like synoviocytes

Affiliations

KCa1.1 channels regulate β1-integrin function and cell adhesion in rheumatoid arthritis fibroblast-like synoviocytes

Mark R Tanner et al. FASEB J. 2017 Aug.

Abstract

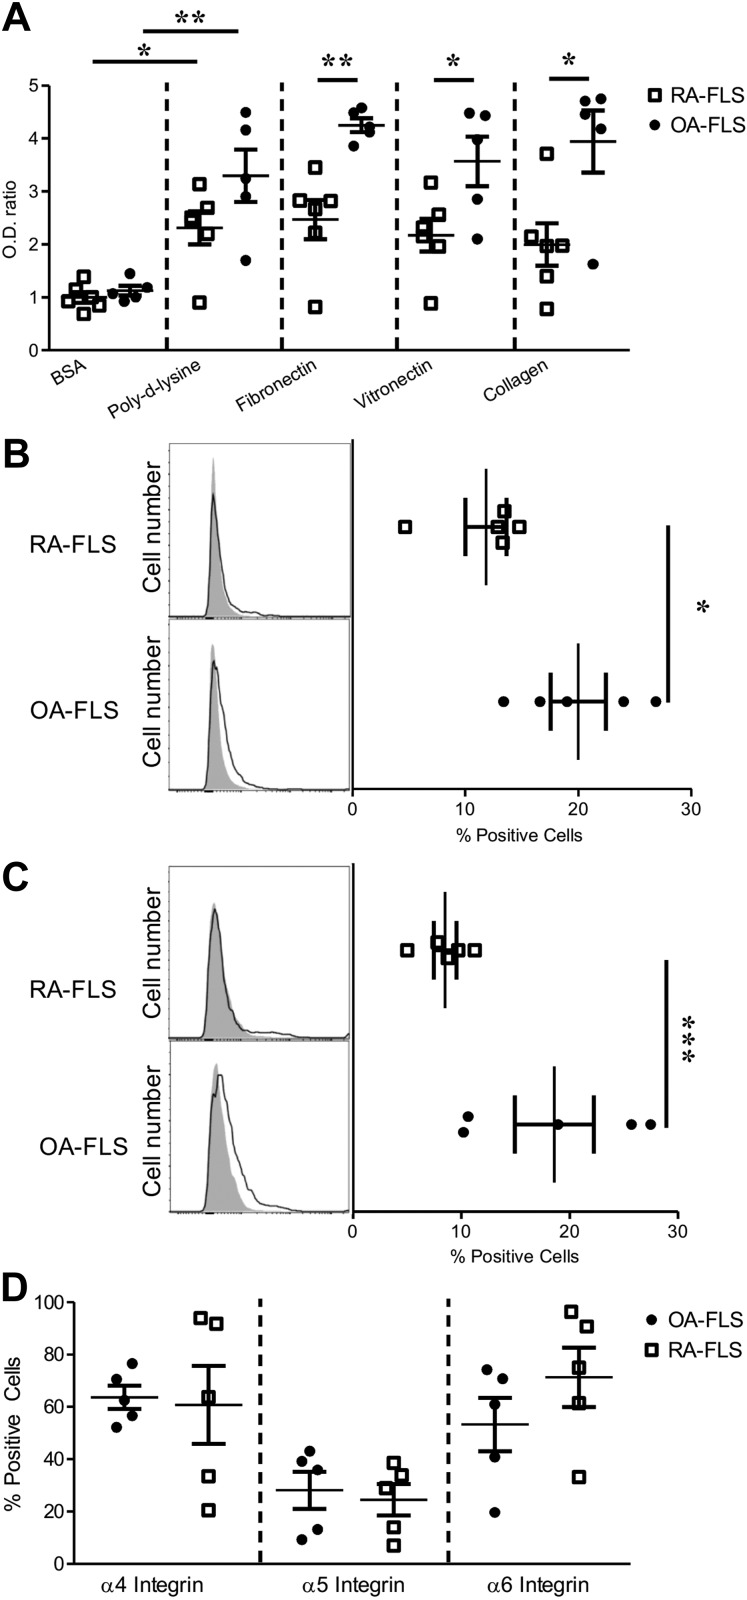
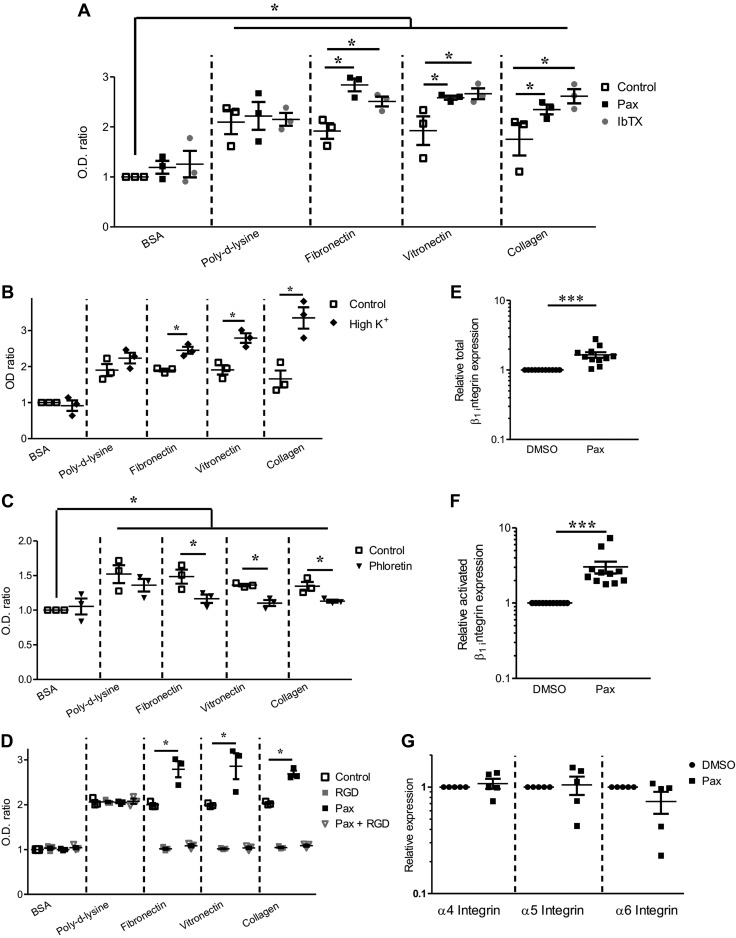
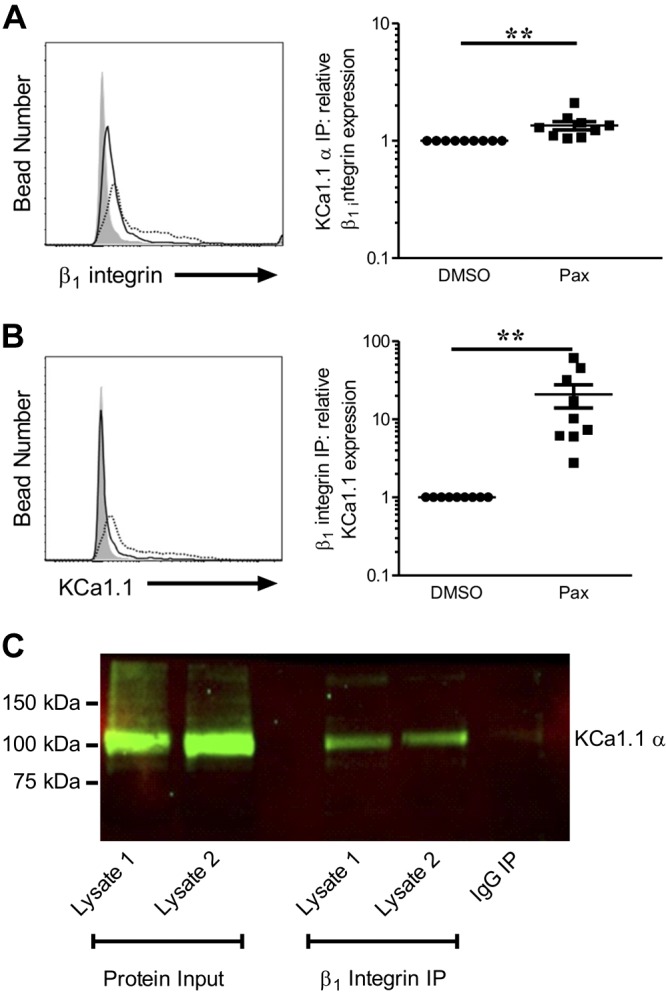
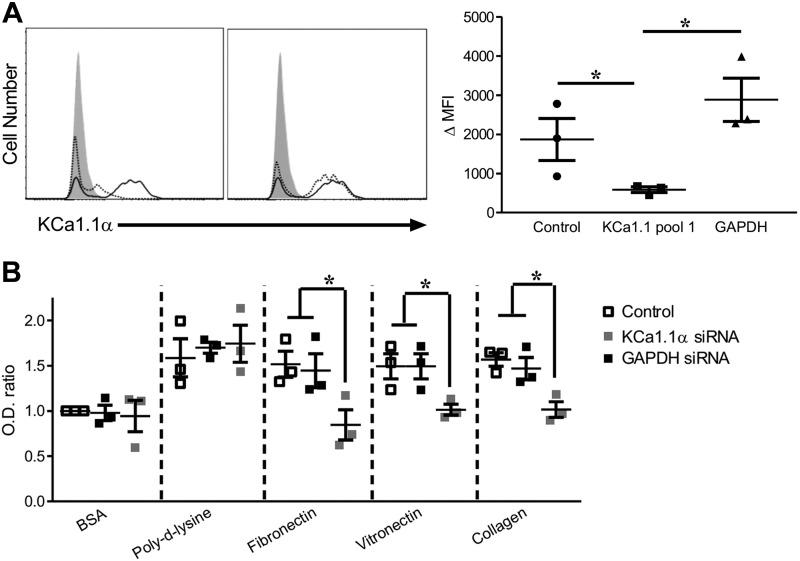
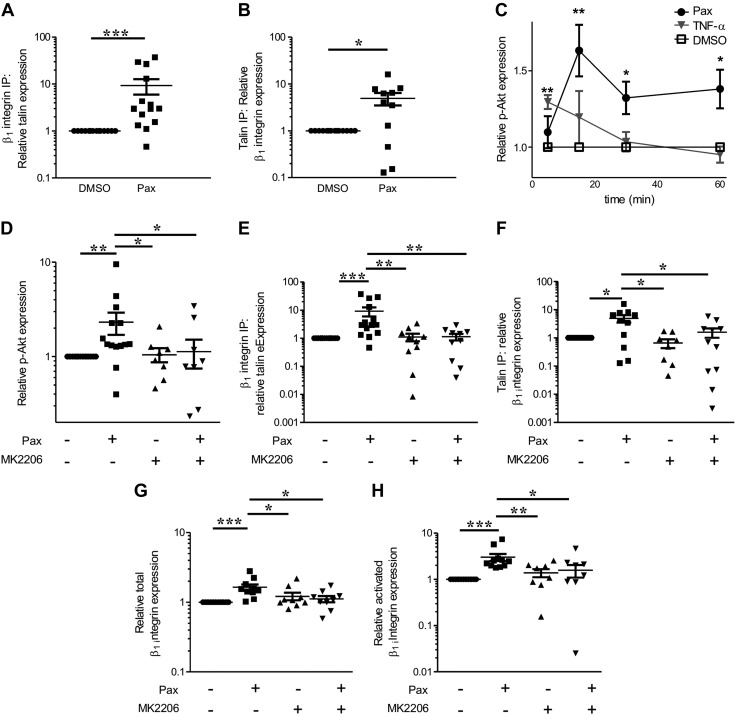
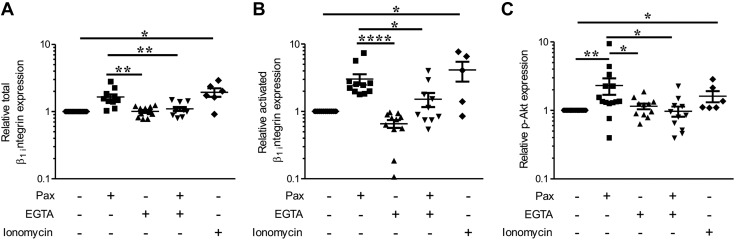
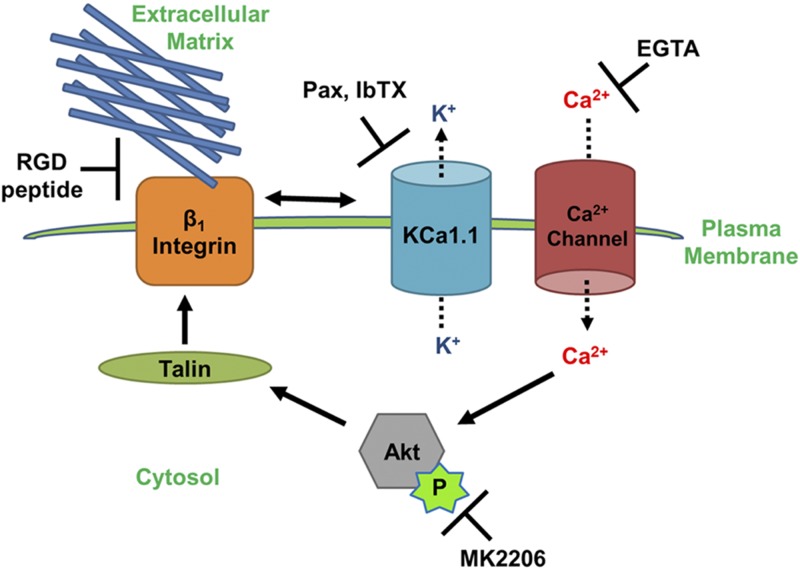
Large-conductance calcium-activated potassium channel (KCa1.1; BK, Slo1, MaxiK, KCNMA1) is the predominant potassium channel expressed at the plasma membrane of rheumatoid arthritis fibroblast-like synoviocytes (RA-FLSs) isolated from the synovium of patients with RA. It is a critical regulator of RA-FLS migration and invasion and therefore represents an attractive target for the therapy of RA. However, the molecular mechanisms by which KCa1.1 regulates RA-FLS invasiveness have remained largely unknown. Here, we demonstrate that KCa1.1 regulates RA-FLS adhesion through controlling the plasma membrane expression and activation of β1 integrins, but not α4, α5, or α6 integrins. Blocking KCa1.1 disturbs calcium homeostasis, leading to the sustained phosphorylation of Akt and the recruitment of talin to β1 integrins. Interestingly, the pore-forming α subunit of KCa1.1 coimmunoprecipitates with β1 integrins, suggesting that this physical association underlies the functional interaction between these molecules. Together, these data outline a new signaling mechanism by which KCa1.1 regulates β1-integrin function and therefore invasiveness of RA-FLSs.-Tanner, M. R., Pennington, M. W., Laragione, T., Gulko, P. S., Beeton, C. KCa1.1 channels regulate β1-integrin function and cell adhesion in rheumatoid arthritis fibroblast-like synoviocytes.

Keywords: invasion; migration; synovial fibroblast.


Figures

Figure 1.
Figure 1.
OA-FLSs adhere more to β1-integrin ligands and express more β1 integrins than RA-FLSs. A) Adhesion of OA-FLSs (black) and RA-FLSs (white) to integrin-dependent (fibronectin, vitronectin, collagen) and independent (BSA, poly-d-lysine) substrates after 1 h incubation at 37°C; n = 5 OA- and 6 RA-FLS donors. B, C) Left: representative flow cytometric histograms of RA-FLSs and OA-FLSs stained for surface expression of total β1 integrins (B) and of activated β1 integrins (C) (black lines) compared to control fluorescence (shaded areas). Right: quantification of staining intensity by Kolmogorov-Smirnov tests; n = 5 RA- and 5 OA-FLS donors. D) Quantification of staining intensity of RA- and OA-FLSs stained for surface expression of α4-6 integrins; n = 5 RA- and 5 OA-FLS donors (Mann-Whitney U test). Data are presented as means ± sem. *P < 0.05.
Figure 2.
Figure 2.
KCa1.1 modulation alters RA-FLS adhesion and β1-integrin expression. A) Adhesion of RA-FLSs to integrin-dependent and -independent substrates in presence of DMSO (vehicle, control), or KCa1.1 blockers paxilline (pax; 20 µM), or iberiotoxin (IbTX; 10 µM) for 1 h before analysis; n = 3 donors per group. B) Adhesion of RA-FLSs in saline solution containing 25 mM potassium. Data are provided as means ± sem; n = 3 donors per group. C) Adhesion of RA-FLSs in presence of DMSO (vehicle, control) or KCa1.1 opener phloretin (100 µM); n = 3 donors per group. D) Adhesion of RA-FLSs in presence of DMSO (control), paxilline (20 µM), soluble RGD peptides (150 μg/ml), or combination of paxilline and RGD peptides; n = 3 RA-FLS donors per group. E–G) Flow cytometric analysis of surface expression of total β1 integrins (E), activated β1 integrins (F), and α4-6 integrins (G) by RA-FLSs plated on fibronectin-coated plates for 1 h in presence of either DMSO or paxilline. Fluorescence intensities quantified by Kolmogorov-Smirnov tests with SED values. Values were each normalized to those of DMSO-treated RA-FLSs from each donor; n = 5–11 donors per group. Statistical analyses completed by Mann-Whitney U tests (A–D) and Wilcoxon matched-pairs signed rank tests (E–G). All data are presented as means ± sem. *P < 0.05, ***P < 0.001.
Figure 3.
Figure 3.
KCa1.1 physically interacts with β1 integrins. A, B) RA-FLSs were plated on fibronectin-coated plates in presence of either DMSO or paxilline for 1 h before cell lysis. Co-IPs between KCa1.1 α and β1 integrin from protein lysates from each group were completed with analysis by flow cytometry. Left: representative flow cytometric histograms comparing fluorescence of beads that had KCa1.1 α pulled down and stained for β1 integrin (A) or beads that had β1 integrin pulled down and stained for KCa1.1 α (B) from protein isolates of DMSO-treated RA-FLSs (solid black line), paxilline-treated RA-FLSs (dotted line), or beads stained with only secondary antibody (shaded area). Right: quantification of fluorescence intensity by Kolmogorov-Smirnov tests with SED values normalized to that of each donor’s SED value of DMSO-treated cells; n = 9 RA-FLS donors. C) KCa1.1 and β1 integrin are associated in HEK293T cells stably expressing KCa1.1 channels. β1 integrin was immunoprecipitated from total protein lysates, and KCa1.1 α subunit was detected by Western blot analysis. Statistical analyses completed with Wilcoxon matched-pairs signed rank tests. Data are presented as means ± sem. **P < 0.01.
Figure 4.
Figure 4.
KCa1.1 is necessary for RA-FLS integrin-dependent adhesion. A) Left: representative flow cytometric histograms of KCa1.1 α staining of RA-FLSs that were either untransfected (black line), subjected to KCa1.1 siRNA (dotted line, left), or subjected to GAPDH siRNA (dotted line, right). Cells stained with secondary antibodies alone are shaded. Right: quantification of KCa1.1 α expression in RA-FLSs that were either left untransfected or were transfected with KCa1.1 siRNA or GAPDH siRNA. Fluorescence was quantified by difference in mean fluorescence intensity of KCa1.1 α-stained cells compared to control-stained cells. All cells were analyzed 48 h after transfection; n = 3 donors. B) Adhesion of RA-FLSs that were either left untransfected (white) or transfected with KCa1.1 siRNA (black) or GAPDH siRNA (gray) and allowed to adhere to integrin-dependent and independent substrates for 1 h before analysis; n = 3 donors. Statistical analyses completed with Mann-Whitney U tests. Data are presented as means ± sem. *P < 0.05.
Figure 5.
Figure 5.
KCa1.1 regulates β1-integrin expression and activation through Akt. A, B) Co-IPs with analysis by flow cytometry between β1 integrin and talin from lysates of RA-FLSs plated on fibronectin and treated with DMSO or 20 µM paxilline for 1 h before cell lysis; each data point represents different RA-FLS donor. A) Quantification of co-IPs with β1 integrin pulled down on antibody-conjugated beads and stained against talin. B) Quantification of co-IPs with talin pulled down on antibody-conjugated beads and stained against β1 integrin. C) Levels of p-Akt in RA-FLSs that were treated with either DMSO (white), 100 ng/ml TNF-α (gray), or 20 µM paxilline (black) for 5, 15, 30, or 60 min before analysis by flow cytometry; n = 8 RA-FLS donors. Data were quantified with each donor’s SED normalized to p-Akt SED levels of DMSO-treated RA-FLSs from same donor. D) Levels of p-Akt in RA-FLSs treated with either DMSO or 20 µM paxilline and 1 µM of Akt inhibitor MK2206 for 15 min before analysis by flow cytometry. Data were quantified with SED values and normalized to each donor’s SED with DMSO-treated RA-FLSs; n = 14 RA-FLS donors for DMSO and paxilline treatment groups; n = 8 for MK2206 treatment group, n = 9 for paxilline + MK2206 treatment group. E, F) Co-IPs with analysis by flow cytometry between β1 integrin and talin from lysates of RA-FLSs plated on fibronectin and treated with DMSO, paxilline, or MK2206 for 1 h before cell lysis; each data point represents different RA-FLS donor. E) Quantification of co-IPs with β1 integrin pulled down on antibody-conjugated beads and stained against talin. F) Quantification of co-IPs with talin pulled down on antibody-conjugated beads and stained against β1 integrin. Fluorescence intensities were obtained by Kolmogorov-Smirnov tests with SED values normalized to SED of bead fluorescence from DMSO-treated group. G, H) Quantification of total (G) and activated (H) β1-integrin surface expression in RA-FLSs plated on fibronectin-coated plates for 1 h in presence of DMSO, paxilline, or MK2206; n = 11 RA-FLS donors for DMSO and paxilline treatment groups, n = 9 for MK2206 and paxilline + MK2206 treatment groups. Statistical analyses completed using Mann-Whitney U tests to compare experimental groups and Wilcoxon matched-pairs signed rank tests to compare experimental to normalized control group. Data are presented as means ± sem. *P < 0.05, **P < 0.01, ***P < 0.001.
Figure 6.
Figure 6.
Regulation of Akt phosphorylation and β1-integrin expression and activation by KCa1.1 is calcium dependent. Flow cytometric analysis of surface expression of total (A) and activated (B) β1 integrins from RA-FLSs plated on fibronectin-coated plates and treated with either DMSO, paxilline, EGTA, or ionomycin for 1 h; n = 11 RA-FLS donors for DMSO, paxilline, EGTA, and EGTA with paxilline treatment groups, n = 6 RA-FLS donors for ionomycin treatment group. C) p-Akt levels in RA-FLSs treated for 15 min with either DMSO, paxilline, EGTA, EGTA and paxilline, or ionomycin; n = 14 RA-FLS donors for DMSO and paxilline treatment groups, n = 11 RA-FLS donors for EGTA and EGTA with paxilline treatment group, n = 6 RA-FLS donors for ionomycin treatment group. All data are quantified by Kolmogorov-Smirnov tests with all SED values normalized to control SED of each donor. Statistical analyses were completed with Mann-Whitney U tests to compare experimental groups and Wilcoxon matched-pairs signed rank tests to compare experimental to normalized control group. Data are presented as means ± sem. *P < 0.05, **P < 0.01, ***P < 0.001.
Figure 7.
Figure 7.
Schematic showing proposed pathway by which KCa1.1 regulates RA-FLS adhesion through β1-integrin modulation. KCa1.1 block induces calcium influx through calcium-permeable channels (14). This influx results in phosphorylation of Akt, which leads to increased recruitment of talin to β1 integrins and to β1-integrin expression at plasma membrane. Furthermore, KCa1.1 block also results in β1 integrin interacting more with KCa1.1 α. Together, this results in increased RA-FLS adhesion to β1-integrin substrates and reduced invasiveness.

Similar articles

Cited by

References

    1. Hynes R. O. (2002) Integrins: bidirectional, allosteric signaling machines. Cell 110, 673–687 - PubMed
    1. Hood J. D., Cheresh D. A. (2002) Role of integrins in cell invasion and migration. Nat. Rev. Cancer 2, 91–100 - PubMed
    1. Levite M., Cahalon L., Peretz A., Hershkoviz R., Sobko A., Ariel A., Desai R., Attali B., Lider O. (2000) Extracellular K(+) and opening of voltage-gated potassium channels activate T cell integrin function: physical and functional association between Kv1.3 channels and beta1 integrins. J. Exp. Med. 191, 1167–1176 - PMC - PubMed
    1. Artym V. V., Petty H. R. (2002) Molecular proximity of Kv1.3 voltage-gated potassium channels and beta(1)-integrins on the plasma membrane of melanoma cells: effects of cell adherence and channel blockers. J. Gen. Physiol. 120, 29–37 - PMC - PubMed
    1. Matheu M. P., Beeton C., Garcia A., Chi V., Rangaraju S., Safrina O., Monaghan K., Uemura M. I., Li D., Pal S., de la Maza L. M., Monuki E., Flügel A., Pennington M. W., Parker I., Chandy K. G., Cahalan M. D. (2008) Imaging of effector memory T cells during a delayed-type hypersensitivity reaction and suppression by Kv1.3 channel block. Immunity 29, 602–614 - PMC - PubMed

Publication types

MeSH terms

Substances

LinkOut - more resources