Key features of an Hsp70 chaperone allosteric landscape revealed by ion-mobility native mass spectrometry and double electron-electron resonance
- PMID: 28428246
- PMCID: PMC5448104
- DOI: 10.1074/jbc.M116.770404
Key features of an Hsp70 chaperone allosteric landscape revealed by ion-mobility native mass spectrometry and double electron-electron resonance
Abstract
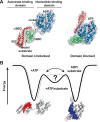
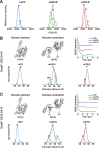
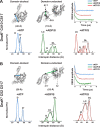
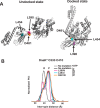
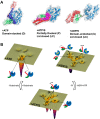
Proteins are dynamic entities that populate conformational ensembles, and most functions of proteins depend on their dynamic character. Allostery, in particular, relies on ligand-modulated shifts in these conformational ensembles. Hsp70s are allosteric molecular chaperones with conformational landscapes that involve large rearrangements of their two domains (viz. the nucleotide-binding domain and substrate-binding domain) in response to adenine nucleotides and substrates. However, it remains unclear how the Hsp70 conformational ensemble is populated at each point of the allosteric cycle and how ligands control these populations. We have mapped the conformational species present under different ligand-binding conditions throughout the allosteric cycle of the Escherichia coli Hsp70 DnaK by two complementary methods, ion-mobility mass spectrometry and double electron-electron resonance. Our results obtained under biologically relevant ligand-bound conditions confirm the current picture derived from NMR and crystallographic data of domain docking upon ATP binding and undocking in response to ADP and substrate. Additionally, we find that the helical lid of DnaK is a highly dynamic unit of the structure in all ligand-bound states. Importantly, we demonstrate that DnaK populates a partially docked state in the presence of ATP and substrate and that this state represents an energy minimum on the DnaK allosteric landscape. Because Hsp70s are emerging as potential drug targets for many diseases, fully mapping an allosteric landscape of a molecular chaperone like DnaK will facilitate the development of small molecules that modulate Hsp70 function via allosteric mechanisms.
Keywords: 70-kilodalton heat shock protein (Hsp70); Hsp70; allosteric regulation; chaperone DnaK (DnaK); conformational change; double electron-electron resonance; energy landscape; ion-mobility mass spectrometry; molecular chaperone.
© 2017 by The American Society for Biochemistry and Molecular Biology, Inc.
Conflict of interest statement
The authors declare that they have no conflicts of interest with the contents of this article
Figures

Similar articles
-
Allosteric landscapes of eukaryotic cytoplasmic Hsp70s are shaped by evolutionary tuning of key interfaces.Proc Natl Acad Sci U S A. 2018 Nov 20;115(47):11970-11975. doi: 10.1073/pnas.1811105115. Epub 2018 Nov 5. Proc Natl Acad Sci U S A. 2018. PMID: 30397123 Free PMC article.
-
The Hsp70 interdomain linker is a dynamic switch that enables allosteric communication between two structured domains.J Biol Chem. 2017 Sep 8;292(36):14765-14774. doi: 10.1074/jbc.M117.789313. Epub 2017 Jul 28. J Biol Chem. 2017. PMID: 28754691 Free PMC article.
-
Monitoring conformational heterogeneity of the lid of DnaK substrate-binding domain during its chaperone cycle.FEBS J. 2016 Aug;283(15):2853-68. doi: 10.1111/febs.13769. Epub 2016 Jul 4. FEBS J. 2016. PMID: 27248857
-
Intra-molecular pathways of allosteric control in Hsp70s.Philos Trans R Soc Lond B Biol Sci. 2018 Jun 19;373(1749):20170183. doi: 10.1098/rstb.2017.0183. Philos Trans R Soc Lond B Biol Sci. 2018. PMID: 29735737 Free PMC article. Review.
-
Recent advances in the structural and mechanistic aspects of Hsp70 molecular chaperones.J Biol Chem. 2019 Feb 8;294(6):2085-2097. doi: 10.1074/jbc.REV118.002810. Epub 2018 Nov 19. J Biol Chem. 2019. PMID: 30455352 Free PMC article. Review.
Cited by
-
Allosteric landscapes of eukaryotic cytoplasmic Hsp70s are shaped by evolutionary tuning of key interfaces.Proc Natl Acad Sci U S A. 2018 Nov 20;115(47):11970-11975. doi: 10.1073/pnas.1811105115. Epub 2018 Nov 5. Proc Natl Acad Sci U S A. 2018. PMID: 30397123 Free PMC article.
-
High-Throughput Native Mass Spectrometry Screening in Drug Discovery.Front Mol Biosci. 2022 Apr 14;9:837901. doi: 10.3389/fmolb.2022.837901. eCollection 2022. Front Mol Biosci. 2022. PMID: 35495635 Free PMC article. Review.
-
Structural and Kinetic Views of Molecular Chaperones in Multidomain Protein Folding.Int J Mol Sci. 2022 Feb 24;23(5):2485. doi: 10.3390/ijms23052485. Int J Mol Sci. 2022. PMID: 35269628 Free PMC article. Review.
-
KLR-70: A Novel Cationic Inhibitor of the Bacterial Hsp70 Chaperone.Biochemistry. 2020 May 26;59(20):1946-1960. doi: 10.1021/acs.biochem.0c00320. Epub 2020 May 4. Biochemistry. 2020. PMID: 32326704 Free PMC article.
-
The application of ion-mobility mass spectrometry for structure/function investigation of protein complexes.Curr Opin Chem Biol. 2018 Feb;42:25-33. doi: 10.1016/j.cbpa.2017.10.026. Epub 2017 Nov 9. Curr Opin Chem Biol. 2018. PMID: 29128665 Free PMC article. Review.
References
-
- Swain J. F., and Gierasch L. M. (2006) The changing landscape of protein allostery. Curr. Opin. Struct. Biol. 16, 102–108 - PubMed
-
- Balchin D., Hayer-Hartl M., and Hartl F. U. (2016) In vivo aspects of protein folding and quality control. Science 353, aac4354. - PubMed
-
- Flaherty K. M., DeLuca-Flaherty C., and McKay D. B. (1990) Three-dimensional structure of the ATPase fragment of a 70K heat-shock cognate protein. Nature 346, 623–628 - PubMed
MeSH terms
Substances
Associated data
- Actions
- Actions
- Actions
- Actions
Grants and funding
LinkOut - more resources
Full Text Sources
Other Literature Sources

