. 2017 Jun;49(6):913-924.
doi: 10.1038/ng.3847. Epub 2017 Apr 17.

Contrasting evolutionary genome dynamics between domesticated and wild yeasts

Affiliations

Contrasting evolutionary genome dynamics between domesticated and wild yeasts

Jia-Xing Yue et al. Nat Genet. 2017 Jun.

Abstract

Structural rearrangements have long been recognized as an important source of genetic variation, with implications in phenotypic diversity and disease, yet their detailed evolutionary dynamics remain elusive. Here we use long-read sequencing to generate end-to-end genome assemblies for 12 strains representing major subpopulations of the partially domesticated yeast Saccharomyces cerevisiae and its wild relative Saccharomyces paradoxus. These population-level high-quality genomes with comprehensive annotation enable precise definition of chromosomal boundaries between cores and subtelomeres and a high-resolution view of evolutionary genome dynamics. In chromosomal cores, S. paradoxus shows faster accumulation of balanced rearrangements (inversions, reciprocal translocations and transpositions), whereas S. cerevisiae accumulates unbalanced rearrangements (novel insertions, deletions and duplications) more rapidly. In subtelomeres, both species show extensive interchromosomal reshuffling, with a higher tempo in S. cerevisiae. Such striking contrasts between wild and domesticated yeasts are likely to reflect the influence of human activities on structural genome evolution.


Conflict of interest statement

Competing Financial Interests

The authors declare that no competing interests exist.

Figures
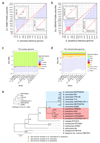
Fig. 1
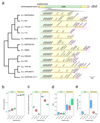
Fig. 1. End-to-end genome assemblies and phylogenetic framework.
(a) Dotplot for the comparison between the S. cerevisiae reference genome (strain S288C; X-axis) and our S288C PacBio assembly (Y-axis). Sequence homology signals were depicted in red (forward match) or blue (reverse match). The two insets show the zoomed-in comparison for chromosome III (chrIII) and the mitochondrial genome (chrmt) respectively. The black arrows indicate three Ty-containing regions (containing five full-length Ty1s) missing in the S. cerevisiae reference genome. (b) Dotplot for the comparison between the S. paradoxus reference genome (strain CBS432; X-axis) and our CBS432 PacBio assembly (Y-axis), color coded as in panel a. The two insets show the zoomed-in comparison for chromosome IV (chrIV) and the mitochondrial genome (chrmt) respectively. The black arrow indicates the mis-assembly on chrIV in the S. paradoxus reference genome. (c-d) The cumulative sequence lengths of different annotated genomic features relative to the overall assembly size of the nuclear (panel c) and mitochondrial genomes (panel d). (e) The phylogenetic relationship of the seven S. cerevisiae strains (highlighted in blue) and five S. paradoxus strains (highlighted in red) sequenced in this study. Six strains from other closely related Saccharomyces sensu stricto species were used as outgroups. All the internal nodes have 100% fast-bootstrap supports. The inset cladogram shows the detailed relationship of the seven S. cerevisiae strains.
Fig. 2
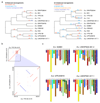
Fig. 2. Explicit nuclear chromosome partitioning.
(a) In this illustrated example, we partitioned the left arm of chromosome I into the core (green), subtelomere (yellow) and chromosome-end (pink) based on synteny conservation and the yeast telomere-associated core X- and Y’-elements. The cladogram (left side) depicts the phylogenetic relationship of the 12 strains, while the gene arrangement map (right side) illustrates the syntenic conservation profile in both the core and subtelomeric regions. The names of genes within the syntenic block were underlined. (b) Proportions of genes involved in copy number variants (CNVs). (c) Proportions of genes involved in CNVs adjusted by the diversification time of the compared strain pair. (d) The gene order loss index (GOL). (e) GOL adjusted by the diversification time of the compared strain pair. The Y-axes in panel b-c are in log-10 scales. In panel b-e, three comparison schemes were examined: within S. cerevisiae (S.c.-S.c.), within S. paradoxus (S.p.-S.p.) and between the two species (S.c.-S.p.). The middle line in the box shows the median value, while the bottom and top lines represent the first and third quartiles. The lengths of the whiskers extend to 1.5 times the interquartile range (IRQ). Data beyond the end of the whiskers are outliers represented by black dots.
Fig. 3
Fig. 3. Structural rearrangements in the nuclear chromosomal cores.
(a) Balanced (left side) and unbalanced (right side) structural rearrangements occurred along the evolutionary history of the 12 strains. (b) The six clustered inversions on chrVII of the South American S. paradoxus UFRJ50816. (c) Genome organization of the strains UWOPS03-461.4, UFRJ50816 and UWOPS91-917.1 relative to that of S288C. The strain S288C is free from large-scale interchromosomal rearrangement, therefore could represent the ancestral genome organization. White diamonds indicate the position of centromeres.
Fig. 4
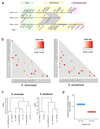
Fig. 4. Subtelomere size plasticity and structural rearrangements.
(a) Size variation of the 32 orthologous subtelomeres across the 12 strains. (b) Dotplot for the chr15-R subtelomere comparison between S. cerevisiae DBVPG6765 and S288C. The extended DBVPG6765 chr15-R subtelomere is explained by a previously reported eukaryote-to-eukaryote horizontal gene transfer (HGT) event. (c) Dotplot for the chr07-R subtelomere comparison between S. paradoxus CBS432 and N44. The chr07-R subtelomere expansion in CBS432 is explained by a series of tandem duplications of the MAL31-like and MAL33-like genes and an addition of the ARR-containing segment from the ancestral chr16-R subtelomere. (d) Dotplot for the chr15-L subtelomere comparison between S. paradoxus UFRJ50816 and YPS138. The expanded chr15-L subtelomere in UFRJ50816 is explained by the relocated subtelomeric segments from the ancestral chr10-L and chr03-R subtelomeres. Please note that the region coordinates in panel (b)-(d) are based on the defined subtelomeres rather than the full chromosomes.
Fig. 5
Fig. 5. Evolutionary dynamics of subtelomeric duplications.
(a) An example of subtelomeric duplication blocks shared among the chr01-L, chr01-R and chr08-R subtelomeres in S. cerevisiae S288C. The grey blocks denote their shared homologous regions with >= 90% sequence identity. (b) Subtelomeric duplication signals shared across the seven S. cerevisiae strains (left) and the five S. paradoxus strains (right). For each specific subtelomere pair, the number of strains showing strong sequence homology (BLAT score >= 5000 and identity >= 90%) was indicated in the heatmap. (c) Hierarchical clustering based on the proportion of conserved orthologous subtelomeres in cross-strain comparisons within S. cerevisiae and within S. paradoxus respectively. (d) Subtelomere reshuffling intensities within S. cerevisiae (S.c.-S.c.) and within S. paradoxus (S.p.-S.p.), which are adjusted by the diversification time of the compared strain pair. The Y-axis is in log-10 scale. The middle line in the box shows the median value, while the bottom and top lines represent the first and third quartiles. The lengths of the whiskers extend to 1.5 times the interquartile range (IRQ). Data beyond the end of the whiskers are outliers represented by black dots.
Fig. 6
Fig. 6. Comparative mitochondrial genomics.
(a) Pairwise comparison for the mitochondrial genome of S288C and DBVPG6044 from S. cerevisiae. (b) Pairwise comparison for the mitochondrial genome of CBS432 and YPS138 from S. paradoxus. (c) Pairwise comparison for the mitochondrial genome of S. cerevisiae S288C and S. paradoxus CBS432. (d) Pairwise comparison for the mitochondrial genome of S. cerevisiae S288C and S. paradoxus YPS138. (e) Genomic arrangement of the mitochondrial protein-coding genes and RNA genes across the 12 sampled strains. The phylogenetic tree shown on the left is constructed based on mitochondrial protein-coding genes, with the number at each internal node showing rapid bootstrap support. The detailed gene arrangement map is shown on the right. Please note that there is a large inversion in S. arboricolus encompassing the entire COX2-ATP8 segment based on its original mitochondrial genome assembly, and here we inverted back this segment for better visualization.
Fig. 7
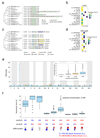
Fig. 7. Structural rearrangements illuminate complex phenotypic variation.
(a) Copy number and gene arrangement of the CUP1 locus across the 12 strains. The asterisk denotes the involvement of pseudogenes. (b) Generation time of the 12 strains in high copper condition (c) Copy number and gene arrangement of the ARR cluster. The asterisk denotes the involvement of pseudogenes. The subtelomere location of the ARR cluster is highly variable. (d) Generation time of the 12 strains in high arsenic condition. (e) The rearrangement that relocates the ARR cluster to the chr03-R subtelomere in the West African S. cerevisiae DBVPG6044 is consistent with the linkage mapping analysis using phased outbred lines (POLs) derived from the North American (YPS128) and West African (DBVPG6044) S. cerevisiae. (f) Phenotypic distribution of the 826 POLs for generation time in arsenic condition partitioned for genotype positions at the chr03-R and chr16-R subtelomeres and inferred copies of ARR clusters (underneath the plot). The middle line in the box shows the median value, while the bottom and top lines represent the first and third quartiles. The lengths of the whiskers extend to 1.5 times the interquartile range (IRQ). Data beyond the end of the whiskers are outliers represented by black dots.
Fig. 8
Fig. 8. Contrasting evolutionary dynamics across the entire genomic landscape between S. cerevisiae and S. paradoxus.
The interspecific contrasts in nuclear chromosomal cores, subtelomeres and mitochondrial genomes were summarized respectively.

Similar articles

Cited by

References

    1. Liti G, et al. Population genomics of domestic and wild yeasts. Nature. 2009;458:337–41. - PMC - PubMed
    1. The 1000 Genomes Project Consortium. A map of human genome variation from population-scale sequencing. Nature. 2010;467:1061–73. - PMC - PubMed
    1. Cao J, et al. Whole-genome sequencing of multiple Arabidopsis thaliana populations. Nat Genet. 2011;43:956–963. - PubMed
    1. Mackay TFC, et al. The Drosophila melanogaster genetic reference panel. Nature. 2012;482:173–178. - PMC - PubMed
    1. Huang W, et al. Natural variation in genome architecture among 205 Drosophila melanogaster genetic reference panel lines. Genome Res. 2014;24:1193–1208. - PMC - PubMed