. 2017 Apr 18;46(4):596-608.
doi: 10.1016/j.immuni.2017.03.012. Epub 2017 Apr 11.

Polycomb Repressive Complex 2-Mediated Chromatin Repression Guides Effector CD8+ T Cell Terminal Differentiation and Loss of Multipotency

Affiliations

Polycomb Repressive Complex 2-Mediated Chromatin Repression Guides Effector CD8+ T Cell Terminal Differentiation and Loss of Multipotency

Simon M Gray et al. Immunity. .

Abstract

Understanding immunological memory formation depends on elucidating how multipotent memory precursor (MP) cells maintain developmental plasticity and longevity to provide long-term immunity while other effector cells develop into terminally differentiated effector (TE) cells with limited survival. Profiling active (H3K27ac) and repressed (H3K27me3) chromatin in naive, MP, and TE CD8+ T cells during viral infection revealed increased H3K27me3 deposition at numerous pro-memory and pro-survival genes in TE relative to MP cells, indicative of fate restriction, but permissive chromatin at both pro-memory and pro-effector genes in MP cells, indicative of multipotency. Polycomb repressive complex 2 deficiency impaired clonal expansion and TE cell differentiation, but minimally impacted CD8+ memory T cell maturation. Abundant H3K27me3 deposition at pro-memory genes occurred late during TE cell development, probably from diminished transcription factor FOXO1 expression. These results outline a temporal model for loss of memory cell potential through selective epigenetic silencing of pro-memory genes in effector T cells.

Keywords: CD8(+) T cell differentiation; EZH2; FOXO1; H3K27ac; H3K27me3; PRC2; Polycomb repressive complex 2; epigenetics; plasticity; terminal differentiation.


Figures

Figure 1
Figure 1. Higher levels of H3K27me3 deposition are a defining feature of TE cells compared to MP cells
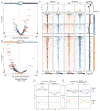
LCMV-specific KLRG1Hi IL7RLo (TE) and KLRG1Lo IL7RHi (MP) P14 CD8+ T cells were purified at d10 post LCMV-Armstrong infection and ChIP-Seq was performed for H3K27me3 and H3K27ac. See Supplemental Methods for details, but briefly, consensus peaks from replicate TE and MP samples were compared to identify “Common” regions or those that contain significantly differentially modified regions (DMRs) of H3K27me3 or H3K27ac (FDR (Benjamini-Hochberg) < 0.1 and fold-change > 1.2). A–B) Volcano plots comparing differential deposition of (A) H3K27ac and (B) H3K27me3 between MP and TE cells were used to identify DMRs. Differential abundance of H3K27ac or H3K27me3 deposition [log2(Fold-change)] is plotted by [−log10(FDR)], where positive fold-change values represent higher deposition of the histone modification in MP cells and negative values represent higher deposition in TE cells. Horizontal dashed line denotes −log10(FDR) of 0.1, while vertical dashed lines denote a +/− log2 transformed fold-change of 1.2. DMRs associated to MP and TE gene expression signatures are labeled as blue and red dots, respectively. All remaining consensus peaks are referred to as “Common” regions between MP and TE cells (labeled as light gray dots). C) Deposition of H3K27me3 and H3K27ac in MP and TE cells centered on DMRs +/−10kb as identified in volcano plots (A and B). Cluster 1 (dark blue) = H3K27ac deposition higher in MP than TE, Cluster 2 (light blue) = H3K27ac deposition higher in TE than MP, Cluster 3 (green) = H3K27me3 deposition higher in MP than TE, Cluster 4 (orange) = H3K27me3 deposition higher in TE than MP. Line plots at top show the summary distributions across each cluster for each H3K27ac and H3K27me3 in MP and TE cells, respectively. Scatter plots on far right show Log2(fold-change) of mRNA expression between MP and TE cells for the DMR-associated genes and summaries of entire gene expression distributions across Clusters 1–4 or Common consensus peaks are shown in boxplots. D–E) Line plots show the ratios of H3K27ac or H3K27me3 deposition (normalized to Common consensus peaks, see Fig S1I) between MP and TE cells or within MP or TE cells for each cluster. Data shown contain the union of significant consensus peaks identified across two independent biological replicates of ChIP-Seq experiments for H3K27ac and H3K27me3 (A–E; n=10–20 mice/group/replicate). See also Figure S1.
Figure 2
Figure 2. TE cells restrict memory cell potential by epigenetically repressing MP-signature genes
Alignment tracks of H3K27ac and H3K27me3 deposition across MP (red) and TE (blue) cells at (A) MP-signature and (B) TE-signature genes. MP- and TE-signature genes were defined based on differential mRNA expression (>1.5 fold-change, FDR < 0.1). Statistically significant differentially modified regions (DMRs) are marked by rectangles below tracks, with red bars representing DMRs where the modification is higher in MP cells and blue bars representing DMRs where the modification is higher in TE cells. Black bars demarcate common consensus peaks that are not differentially modified in one cell population over the other. Data shown contain the union of significant consensus peaks identified across two independent biological replicates of ChIP-Seq experiments for H3K27ac and H3K27me3 (A–B; n=10–20 mice/group/replicate). See also Figure S2.
Figure 3
Figure 3. EZH2 is required for H3K27me3 deposition and antiviral CD8+ T cell clonal expansion
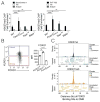
A) Naïve CD8+ T cells from Ezh2f/f mice and CD8+ T cells from Ezh2f/f and Ezh2f/f CD4Cre+ mice activated in vitro with αCD3 and αCD28 for 3 day were purified using FACS and the amounts of EZH2, β-Actin, H3K27me3 and total H3 were measured by western blot (data from 2 different experiments). Note, H3K27me3 is virtually undetectable in activated Ezh2f/f CD4Cre+ CD8+ T cells. B) Ezh2f/f and Ezh2f/f GzmBCre+ mice were infected with LCMV Armstrong and the number of splenic DbGP33-41 and DbNP396-404 MHC class I tetramer+ CD8+ T cells combined were enumerated at d8 p.i. C) Bar graph shows viral titer in the serum of Ezh2f/f and Ezh2f/f GzmBCre+ mice at d8 p.i. D) Naïve P14 Ezh2f/f (red) and Ezh2f/f CD4Cre+ (black line) CD8+ T cells were labeled with CellTrace Violet and stimulated for 72 hours in vitro with GP33-41 peptide. Unstimulated naïve P14 CD8 T cells are shown in gray. E) Congenically mismatched naïve P14+ Thy1.1+Ly5.2+ Ezh2f/f (red) and Thy1.2+Ly5.2+ Ezh2f/f CD4Cre+ (black line) CD8+ T Cells were pulsed with CellTrace Violet and adoptively co-transferred into Thy1.2+ Ly5.1+ WT recipient mice that were subsequently infected with LCMV-Armstrong and analyzed for cell division 60 hours later. P14+ CD8+ T cells from an uninfected recipient are shown in gray. F) Bar graphs show IFNγ, TNFα, and IL2 production in GP33-41 peptide-stimulated Ezh2f/f and Ezh2f/f GzmBCre+ CD8+ T cells at d8 p.i. Data shown are representative of two (C–E), three (A), or five (F) independent experiments (n=4–10 mice/group/experiment for C and F), or cumulative of five independent experiments (n=21 mice/group) (B). Data are expressed as mean ± SD. *p=0.02, ****p<0.0001
Figure 4
Figure 4. EZH2 is required for KLRG1Hi CD27Lo TE CD8+ T cell differentiation
A) Ezh2f/f (solid) and Ezh2f/f GzmBCre+ (open) mice were infected with LCMV-Armstrong, and at d4.5 p.i. the percentage of KLRG1Hi virus-specific CD8+ T cells was determined in the peripheral blood using DbGP33-41 and DbNP396-404 MHC class I tetramer+ staining and flow cytometry. B–D) The same mice as in (A) were examined at d8 p.i. for expression of pro-effector and pro-memory receptors and TFs on splenic DbGP33-41 tetramer+ CD8+ T cells. B) Histograms show the relative surface expression of the indicated receptors in Ezh2f/f (black) and Ezh2f/f GzmBCre+ (gray) CD8+ T cells. C) Bar graph shows KLRG1/IL7R subsets as a percentage of DbGP33-41 + Ezh2f/f (solid) and Ezh2f/f GzmBCre+ (open) CD8+ T cells. D) Bar graphs show intracellular mean fluorescence intensity (MFI) of the indicated TFs in Ezh2f/f (solid) and Ezh2f/f GzmBCre+ (open) CD8+ T cells. Data shown are representative of three (A) or five (B,D) or cumulative of five (C) independent experiments (n=4–10 mice/group/experiment). Data are expressed as mean ± SD. **p=0.006, ***p=0.0001,****p<0.0001. See also Figure S3 and S4.
Figure 5
Figure 5. EZH2 is not required for memory formation, but is required for secondary responses
A–C) Ezh2f/+GzmBERT2Cre+ and Ezh2f/fGzmBERT2Cre+ mice were infected with LCMV-Armstrong, then starting at d8 p.i., EZH2 was inducibly deleted in virus-specific CD8+ T cells by tamoxifen (2mg) administration every three days for three weeks. A) The splenic YFP+ DbGP33-41 + CD8+ T cells were examined at d30 p.i. by flow cytometry and contour plots (left) show expression of KLRG1 and IL7R. Bar graphs (right) show the numbers of Ezh2f/+GzmBERT2Cre+ (solid) and Ezh2f/fGzmBERT2Cre+ (open) virus-specific YFP+ CD8+ T cells in each of the four KLRG1/IL-7R subsets. B) Bar graph shows percentage of YFP+ DbGP33-41 + CD8+ T cells expressing CD62L. C) Bar graph shows FOXO1 protein levels in YFP+ DbGP33-41 + CD8+ T cells. D–H) Ezh2f/f and Ezh2f/f GzmBCre+ mice (the non-inducible Cre system described in Fig 3) were infected with LCMV-Armstrong and at d30 p.i. the phenotype (D–F) and protective capacity (G–H) of the GP33-41-specific memory CD8+ T cells were examined. D) Contour plots (left) show expression of KLRG1 and IL7R and bar graphs (right) show the numbers of Ezh2f/f (solid) and Ezh2f/f GzmBCre+ (open) virus-specific CD8+ T cells in each of the four KLRG1/IL-7R subsets. E) Bar graph shows percentage of DbGP33-41 + CD8+ T cells expressing CD62L. F) Bar graph shows FOXO1 protein levels in DbGP33-41 + CD8+ T cells. G–H) 50,000 GP33-41-specific Ezh2f/f or Ezh2f/f GzmBCre+ memory CD8+ T cells (from D) were transferred into naïve B6 mice that were then infected with recombinant Listeria monocytogenes expressing the GP33-41 epitope (LM-33). G) At d4.5 post-challenge, the numbers of recalled GP33-41-specific Ezh2f/f and Ezh2f/f GzmBCre+ CD8+ T cells were enumerated in the spleen. H) LM-33 bacterial titers in the liver were determined at d3 post-challenge. Data shown are representative of two (B–C, E–F, H) or cumulative of two (G) or three (A, D) independent experiments (n=9/group (A), n=9–13/group (D, G), n=3–5 mice/group/experiment (B–C, E–F, H)). Data are expressed as mean ± SD. *p=0.02, **p=0.01, ***p=0.0005. See also Figure S5.
Figure 6
Figure 6. Increased H3K27me3 deposition occurs specifically in late-stage TE cells
A) Tbx21, Tcf7, Foxo1, Bach2, and Id3 mRNA were measured in purified naïve (day 0) Ezh2f/f (solid) P14+ CD8+ T cells, and in Ezh2f/f (solid) and Ezh2f/f GzmBCre+ (open) P14+ CD8+ T cells from day 4.5 p.i. using qRT-PCR. Data are representative of 3 independent experiments (n=2–3 mice/group/experiment). B) WT P14+ CD8+ T cells were purified from naïve (day 0) and LCMV-Armstrong infected mice at days 1.5, 4.5 (KLRG1Hi and KLRG1Lo populations), 10 (KLRG1HiIL7RLo TE and KLRG1LoIL7RHi MP populations), and 30 p.i., and then ChIP-qPCR was performed for H3K27me3 using primers to the Tcf7 TSS and Bach2 intron 1 (black). Region within Ttn served as a negative control (white) for H3K27me3 based on genome-wide H3K27me3 ChIP-seq analysis. Data are cumulative of four independent experiments (n=2–4 mice/group/experiment) with % of input for each sample normalized internally to the % of input for the day 30 sample, thereby calculating fold enrichment relative to the d30 sample as plotted. Data are expressed as mean ± SD. *p<0.05, **p<0.01. See also Figure S6.
Figure 7
Figure 7. FOXO1 regulates H3K27me3 deposition
A) WT (control cells infected with empty-vector-GFP retrovirus), Foxo1f/f CD4Cre+, Tbet-overexpressing (TbetOE), and Stat4−/− KLRG1Hi IL7RLo (TE) Thy1.1 P14+ CD8+ T cells were purified by FACS from infected mice from day 10 p.i. and ChIP-qPCR was performed for H3K27me3 using primers to the Tcf7 TSS and Bach2 intron 1 (black). A region within Ttn served as a negative control (white) for H3K27me3 based on genome-wide H3K27me3 ChIP-seq analysis. Data are cumulative from two (Stat4−/−), three (TbetOE), or four (Foxo1f/f CD4Cre+) independent experiments (n=2 [Stat4−/−], 7 [TbetOE], or 11 [Foxo1f/f CD4Cre+] mice/per group) with percentage of input for each sample normalized internally to the percentage of input of WT, thereby calculating fold enrichment relative to WT as plotted. B) Bar graph shows FOXO1 protein levels in KLRG1Hi and KLRG1Lo WT P14+ CD8+ T cells and Foxo1f/f CD4Cre+ P14+ CD8+ T cells at d10 p.i. with LCMV-Armstrong in vivo. Data are expressed as mean ± SD. *p<0.05, **p<0.01, ****p<0.0001 C) Significant FOXO1 binding sites (p-value < 10−5) identified by ChIP-seq from naive CD8+ T cells (GSE46943) were annotated to the nearest consensus peak. Density plots were calculated from the distribution of distances from a FOXO1 binding site to the nearest consensus peak and visualized separately for DMRs versus Common regions for H3K27ac (top) and H3K27me3 (bottom). Select genes associated with FOXO1 binding are noted below the density plots, and colored according to Cluster 1–4 or Common. See also Figure S7.

Similar articles

Cited by

References

    1. Araki Y, Wang Z, Zang C, Wood WH, 3rd, Schones D, Cui K, Roh TY, Lhotsky B, Wersto RP, Peng W, Becker KG, Zhao K, Weng NP. Genome-wide analysis of histone methylation reveals chromatin state-based regulation of gene transcription and function of memory CD8+ T cells. Immunity. 2009;30:912–25. - PMC - PubMed
    1. Arvey A, Van Der Veeken J, Samstein RM, Feng Y, Stamatoyannopoulos JA, Rudensky AY. Inflammation-induced repression of chromatin bound by the transcription factor Foxp3 in regulatory T cells. Nat Immunol 2014 - PMC - PubMed
    1. Bannard O, Kraman M, Fearon DT. Secondary replicative function of CD8+ T cells that had developed an effector phenotype. Science. 2009;323:505–9. - PMC - PubMed
    1. Best JA, Blair DA, Knell J, Yang E, Mayya V, Doedens A, Dustin ML, Goldrath AW. Transcriptional insights into the CD8+ T cell response to infection and memory T cell formation. Nat Immunol. 2013;14:404–412. - PMC - PubMed
    1. Chang JT, Ciocca ML, Kinjyo I, Palanivel VR, Mcclurkin CE, Dejong CS, Mooney EC, Kim JS, Steinel NC, Oliaro J, Yin CC, Florea BI, Overkleeft HS, Berg LJ, Russell SM, Koretzky GA, Jordan MS, Reiner SL. Asymmetric proteasome segregation as a mechanism for unequal partitioning of the transcription factor T-bet during T lymphocyte division. Immunity. 2011;34:492–504. - PMC - PubMed

Publication types

MeSH terms