Top-Down Proteomics of Large Proteins up to 223 kDa Enabled by Serial Size Exclusion Chromatography Strategy
- PMID: 28406609
- PMCID: PMC5511113
- DOI: 10.1021/acs.analchem.7b00380
Top-Down Proteomics of Large Proteins up to 223 kDa Enabled by Serial Size Exclusion Chromatography Strategy
Abstract
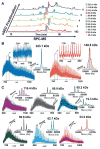
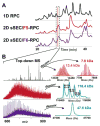
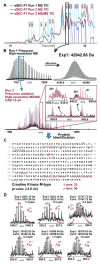
Mass spectrometry (MS)-based top-down proteomics is a powerful method for the comprehensive analysis of proteoforms that arise from genetic variations and post-translational modifications (PTMs). However, top-down MS analysis of high molecular weight (MW) proteins remains challenging mainly due to the exponential decay of signal-to-noise ratio with increasing MW. Size exclusion chromatography (SEC) is a favored method for size-based separation of biomacromolecules but typically suffers from low resolution. Herein, we developed a serial size exclusion chromatography (sSEC) strategy to enable high-resolution size-based fractionation of intact proteins (10-223 kDa) from complex protein mixtures. The sSEC fractions could be further separated by reverse phase chromatography (RPC) coupled online with high-resolution MS. We have shown that two-dimensional (2D) sSEC-RPC allowed for the identification of 4044 more unique proteoforms and a 15-fold increase in the detection of proteins above 60 kDa, compared to one-dimensional (1D) RPC. Notably, effective sSEC-RPC separation of proteins significantly enhanced the detection of high MW proteins up to 223 kDa and also revealed low abundance proteoforms that are post-translationally modified. This sSEC method is MS-friendly, robust, and reproducible and, thus, can be applied to both high-efficiency protein purification and large-scale proteomics analysis of cell or tissue lysate for enhanced proteome coverage, particularly for low abundance and high MW proteoforms.
Figures


Similar articles
-
A Top-Down Proteomics Platform Coupling Serial Size Exclusion Chromatography and Fourier Transform Ion Cyclotron Resonance Mass Spectrometry.Anal Chem. 2019 Mar 19;91(6):3835-3844. doi: 10.1021/acs.analchem.8b04082. Epub 2019 Feb 25. Anal Chem. 2019. PMID: 30758949 Free PMC article.
-
Intact-Mass Analysis Facilitating the Identification of Large Human Heart Proteoforms.Anal Chem. 2019 Sep 3;91(17):10937-10942. doi: 10.1021/acs.analchem.9b02343. Epub 2019 Aug 14. Anal Chem. 2019. PMID: 31393705 Free PMC article.
-
Size Exclusion Chromatography Strategies and MASH Explorer for Large Proteoform Characterization.Methods Mol Biol. 2022;2500:15-30. doi: 10.1007/978-1-0716-2325-1_3. Methods Mol Biol. 2022. PMID: 35657584 Free PMC article.
-
[Applications of high performance liquid chromatography-mass spectrometry in proteomics].Se Pu. 2024 Jul;42(7):601-612. doi: 10.3724/SP.J.1123.2023.11006. Se Pu. 2024. PMID: 38966969 Free PMC article. Review. Chinese.
-
Top-Down Mass Spectrometry: Proteomics to Proteoforms.Adv Exp Med Biol. 2016;919:171-200. doi: 10.1007/978-3-319-41448-5_8. Adv Exp Med Biol. 2016. PMID: 27975217 Review.
Cited by
-
Quantitative Top-Down Proteomics in Complex Samples Using Protein-Level Tandem Mass Tag Labeling.J Am Soc Mass Spectrom. 2021 Jun 2;32(6):1336-1344. doi: 10.1021/jasms.0c00464. Epub 2021 Mar 16. J Am Soc Mass Spectrom. 2021. PMID: 33725447 Free PMC article.
-
Mesh Fragmentation Improves Dissociation Efficiency in Top-down Proteomics.J Am Soc Mass Spectrom. 2021 Jun 2;32(6):1319-1325. doi: 10.1021/jasms.0c00462. Epub 2021 Mar 23. J Am Soc Mass Spectrom. 2021. PMID: 33754701 Free PMC article.
-
Reproducible Large-Scale Synthesis of Surface Silanized Nanoparticles as an Enabling Nanoproteomics Platform: Enrichment of the Human Heart Phosphoproteome.Nano Res. 2019 Jun;12(6):1473-1481. doi: 10.1007/s12274-019-2418-4. Epub 2019 May 29. Nano Res. 2019. PMID: 31341559 Free PMC article.
-
Fourier-transform ion cyclotron resonance mass spectrometry for characterizing proteoforms.Mass Spectrom Rev. 2022 Mar;41(2):158-177. doi: 10.1002/mas.21653. Epub 2020 Sep 7. Mass Spectrom Rev. 2022. PMID: 32894796 Free PMC article. Review.
-
Identification and Quantification of Proteoforms by Mass Spectrometry.Proteomics. 2019 May;19(10):e1800361. doi: 10.1002/pmic.201800361. Proteomics. 2019. PMID: 31050378 Free PMC article. Review.
References
-
- Yates JR, Ruse CI, Nakorchevsky A. Annu Rev Biomed Eng. 2009;11:49–79. - PubMed
Publication types
MeSH terms
Substances
Grants and funding
LinkOut - more resources
Full Text Sources
Other Literature Sources
Miscellaneous

