. 2017 Apr 4;19(1):203-217.
doi: 10.1016/j.celrep.2017.03.037.

Quantitative Multiplex Immunohistochemistry Reveals Myeloid-Inflamed Tumor-Immune Complexity Associated with Poor Prognosis

Affiliations

Quantitative Multiplex Immunohistochemistry Reveals Myeloid-Inflamed Tumor-Immune Complexity Associated with Poor Prognosis

Takahiro Tsujikawa et al. Cell Rep. .

Abstract

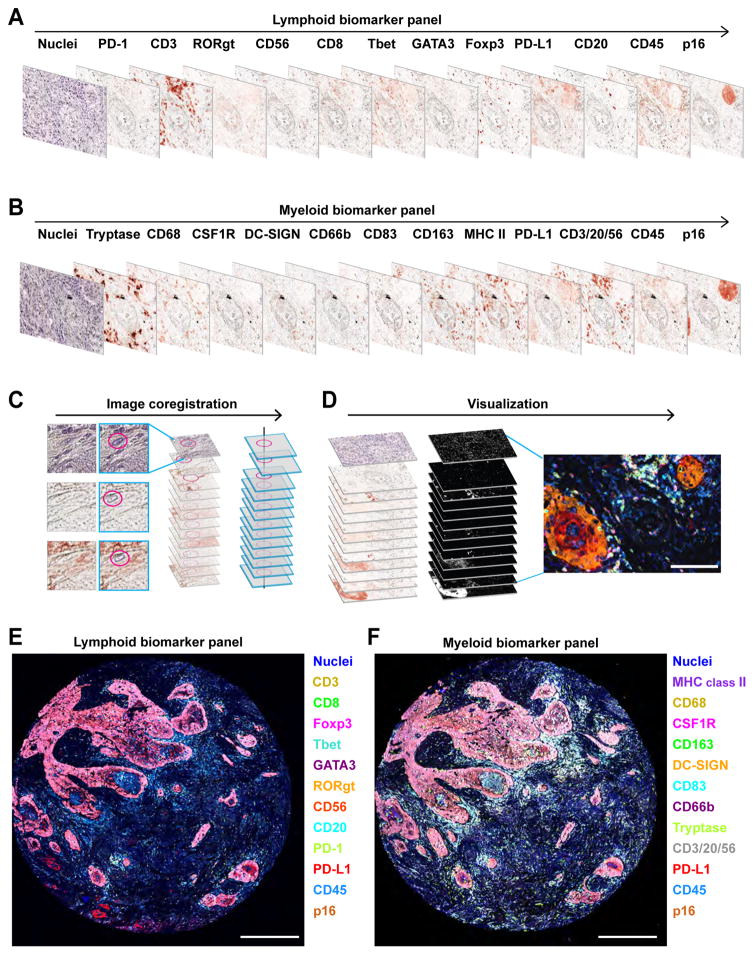
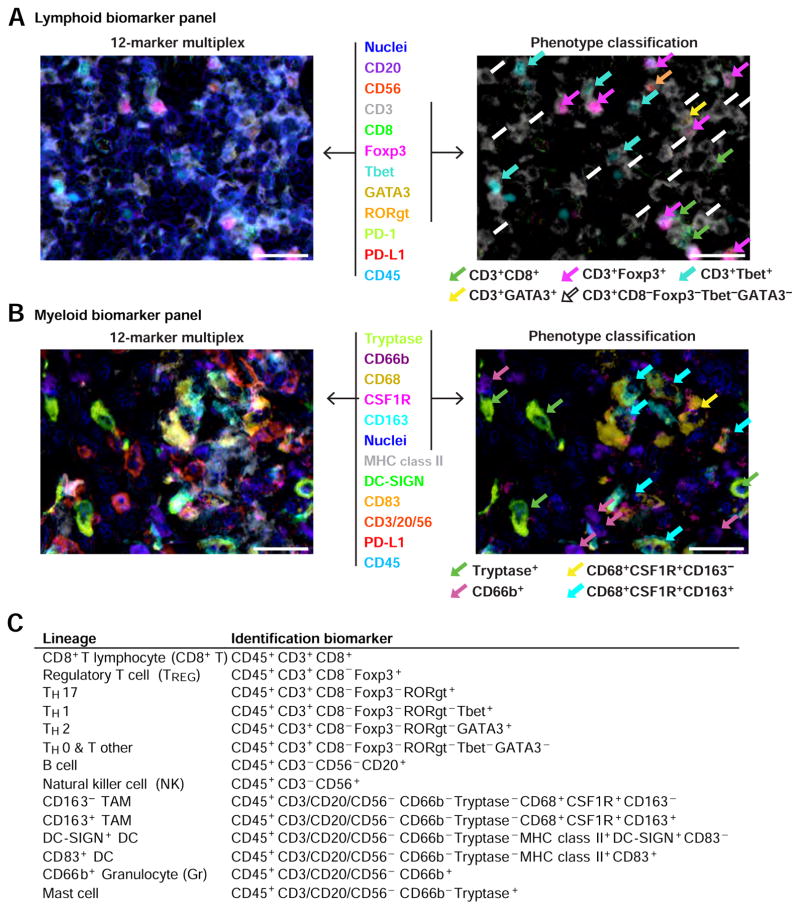
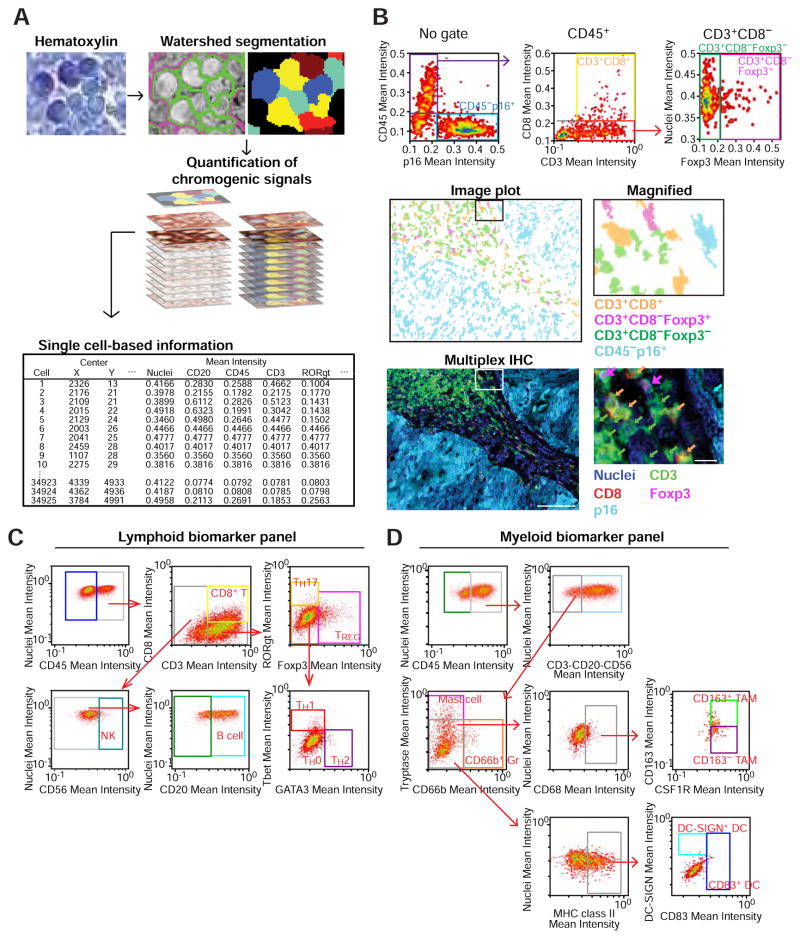
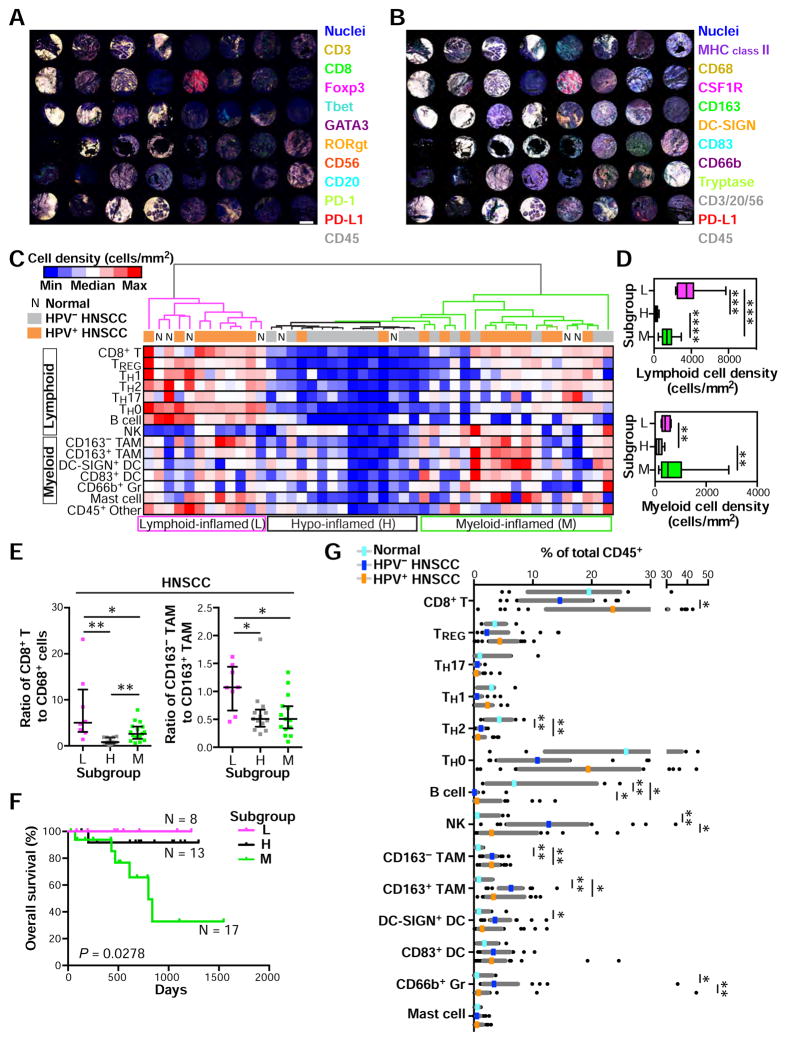
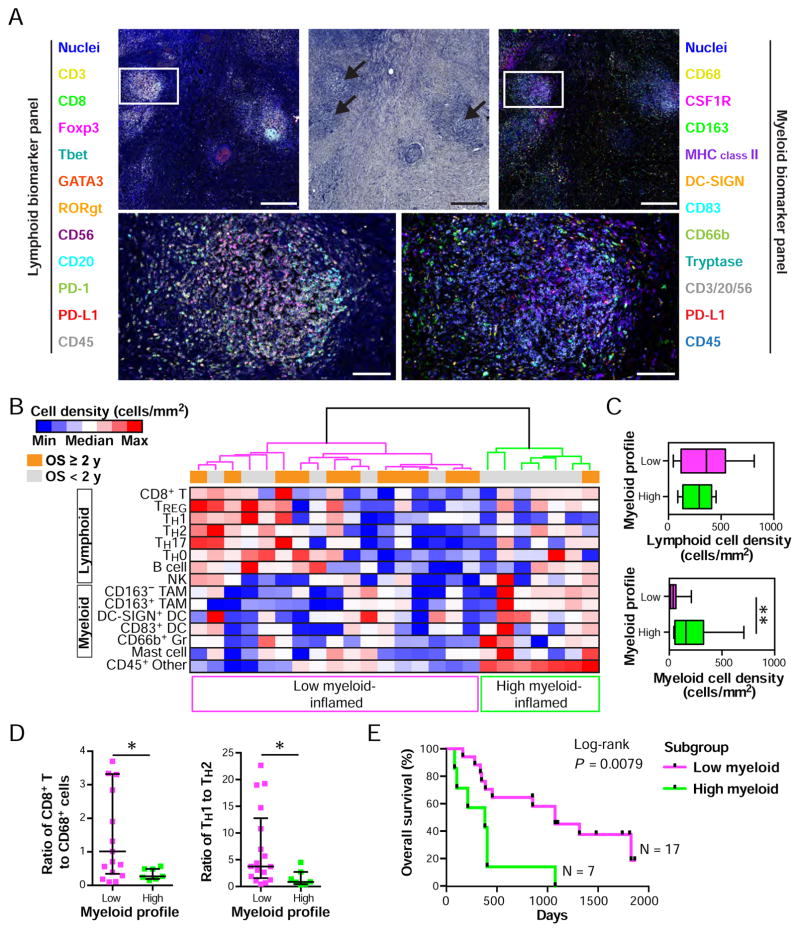
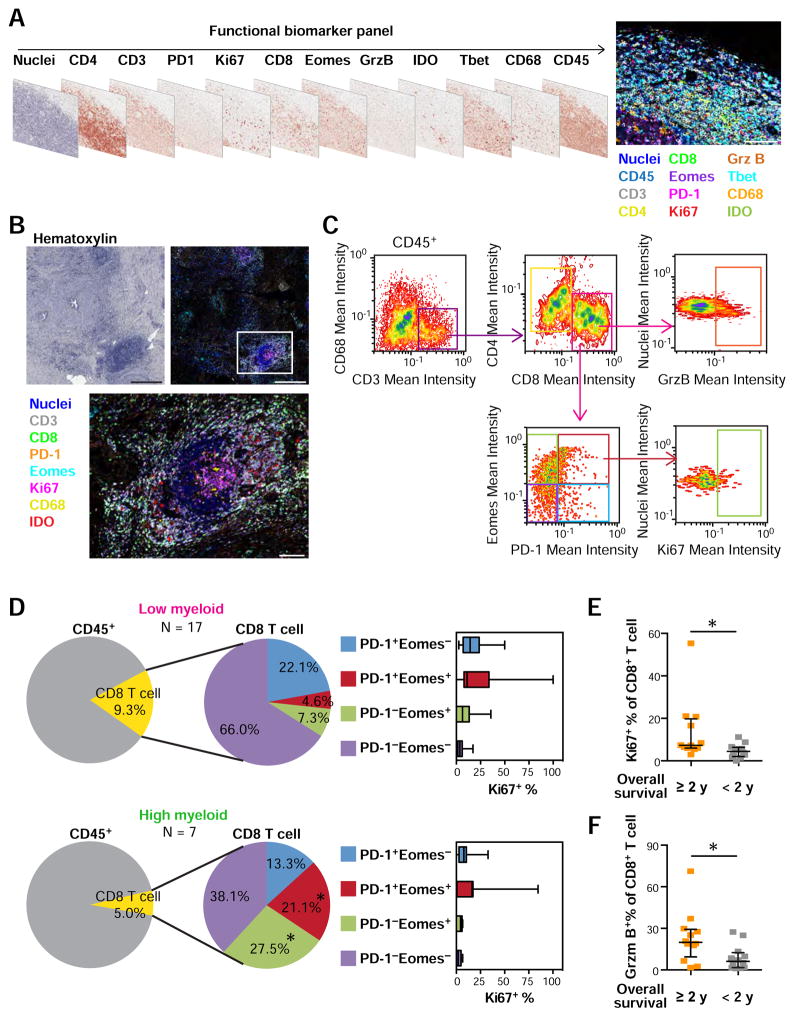
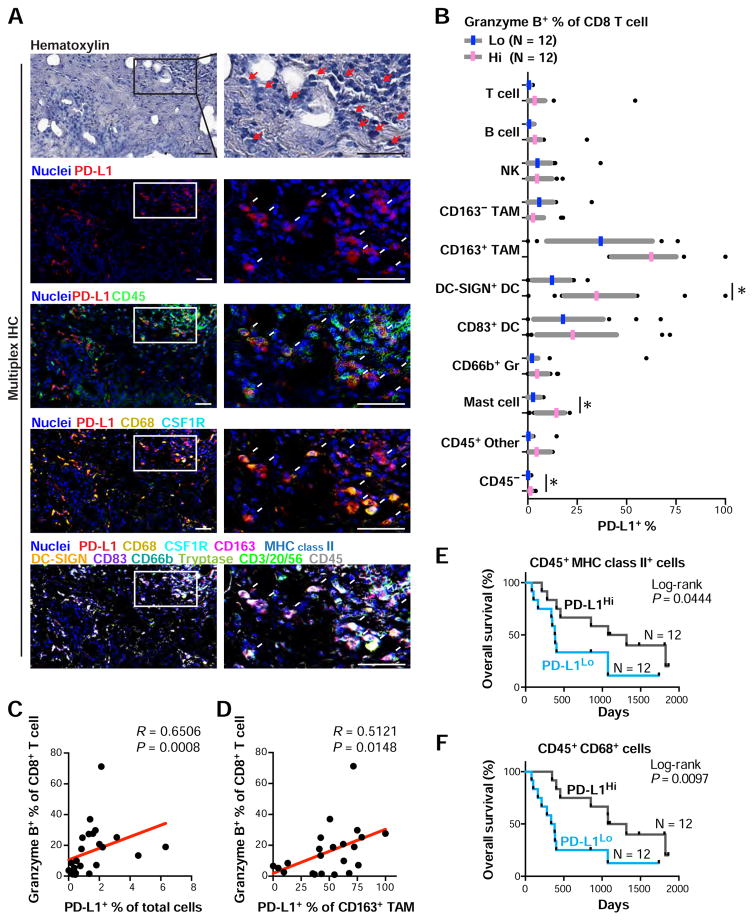
Here, we describe a multiplexed immunohistochemical platform with computational image processing workflows, including image cytometry, enabling simultaneous evaluation of 12 biomarkers in one formalin-fixed paraffin-embedded tissue section. To validate this platform, we used tissue microarrays containing 38 archival head and neck squamous cell carcinomas and revealed differential immune profiles based on lymphoid and myeloid cell densities, correlating with human papilloma virus status and prognosis. Based on these results, we investigated 24 pancreatic ductal adenocarcinomas from patients who received neoadjuvant GVAX vaccination and revealed that response to therapy correlated with degree of mono-myelocytic cell density and percentages of CD8+ T cells expressing T cell exhaustion markers. These data highlight the utility of in situ immune monitoring for patient stratification and provide digital image processing pipelines to the community for examining immune complexity in precious tissue sections, where phenotype and tissue architecture are preserved to improve biomarker discovery and assessment.

Keywords: cancer immunology; digital pathology; head and neck cancer; image cytometry; immunohistochemistry; multiplex; pancreatic cancer; tissue biomarker.


Figures

Figure 1
Figure 1. Schematic overview of 12-color sequential IHC and image visualization
(A, B) Digital scans representing bright field sequential IHC of one formalin-fixed paraffin embedded (FFPE) section of human head and neck squamous cell carcinoma (HNSCC) tissue enable assessment of 12 different lymphoid (A) and myeloid (B) biomarkers. Primary antibodies were visualized with horseradish peroxidase-conjugated polymer and 3-amino-9-ethylcarbazole (AEC) detection followed by whole slide digital scanning. Following destaining in an alcohol gradient and a heat-based antibody stripping using citrate pH 6.0 (see Experimental Procedures and Table S1), samples were restained sequentially with the indicated antibodies. (C) Following manual selection of single cell or structure indicated by magenta circles, the XY coordinates of scanned images were calculated and utilized for adjustment of alignment in CellProfiler (see Experimental Procedures). (D) AEC color signals were extracted from each digitized single marker image by color deconvolution, followed by pseudo-coloring. Scale bar = 100 μm. (E, F) Two serial FFPE sections of HNSCC were stained with the lymphoid (E) and myeloid biomarker (F) panels by pseudo-coloring. Biomarkers and colors are shown on right. Corresponding single marker images are shown in Figures S1A and S1B. Scale bars = 500 μm.
Figure 2
Figure 2. 12-color multiplex IHC to visualize lymphoid and myeloid immune cell phenotypes in FFPE sections
(A, B) FFPE sections of human HNSCC tissues were analyzed by the two 12-marker panels of lineage-selective antibodies to identify lymphoid (A) and myeloid (B) lineages (left panels). Figure S3 shows single-color images for composites shown in (A) and (B). Colocalization of multiple markers enabled discernment of immune cell phenotypes including CD3+CD8+ T cells, regulatory T cells (TREG), TH0, TH1, TH2 and TH17 lymphocytes, CD163+ and CD163 macrophages, CD66b+ granulocytes (Gr), and mast cells (right panels with colored arrows). Biomarkers and colors are shown in the center. Scale bars = 25 μm. (C) Lineages and corresponding identification markers utilized in this study are shown.
Figure 3
Figure 3. Multiparameter cytometric image analysis for quantification of multiplex IHC
(A) A hematoxylin-stained image used for automated cell segmentation based on watershed segmentation algorithms by CellProfiler is shown (see Experimental Procedures). Segmentation results were utilized as templates for quantification of serially scanned AEC images, and pixel intensities of chromogenic signals and area-shape measurements were extracted and recorded by single cell-analysis together with location in original images. (B) Obtained single cell-based chromogenic signal intensity, cell size/area, and location were utilized for density plots similar to flow cytometry by using a cytometry analysis software, FCS Express 5 Image Cytometry (De Novo Software). Three dot plots shown at top represent image cytometric analysis in a p16+ HNSCC tissue. Gated cell populations of CD45+CD3+CD8+ T cells, CD45+CD3+CD8Foxp3+, and CD45+CD3+CD8Foxp3, CD45p16+ cells are shown (middle) as an image plot with coloring of orange, magenta, green, and cyan, respectively. A 5-color multiplex IHC image corresponding to the image plot is shown at bottom, revealing matched identification between image cytometry and visualized images. The boxes depict magnified areas. Scale bars = 100 μm (low magnification) and 10 μm (high magnification). (C, D) Image cytometry-based cell population analyses for the lymphoid and myeloid biomarker panels are shown in (C) and (D), respectively. The markers used for identification of cell lineages are shown in Figure 2C. Gating thresholds for qualitative identification were determined based on data in negative controls (Figures S4B and S4C). The x and y axes are shown on a logarithmic scale.
Figure 4
Figure 4. Quantitation of immune cell density-based subgrouping, enables stratification for prognosis and human papilloma virus (HPV) status in HNSCC
(A, B) Two FFPE sections from a HNSCC-assembled TMA including HPV-negative (N = 17), HPV-positive oropharyngeal tumor (N = 21) and normal oropharynx (N = 8) were stained using the lymphoid (A) and myeloid biomarker antibody panels (B). Scale bar = 1.0 mm. (C) Cell densities (cells/mm2) of 15 immune cell lineages in each single core were quantified using image cytometry. Data sets from the two panels reflecting lymphoid and myeloid biomarkers were normalized based on CD45+ cell number. A heat map according to color scale (upper left) is shown with a dendrogram of unsupervised hierarchical clustering, depicting lymphoid-, hypo-, and myeloid-inflamed subgroups (L, H and M in bottom, respectively). See also Figure S5C and Table S2. (D) Immune cell densities of lymphoid and myeloid cell lineages comparing subgroups in Figure 4C. Bars, boxes and whiskers represent median, interquartile range and range, respectively. (E) Ratios of cell percentages comparing subgroups are shown. Bars show median with interquartile range. (F) Kaplan-Meier analysis of overall survival of HNSCC patients stratified by subgroups. Statistical significance was determined via log-rank test. (G) Immune cell percentages were quantified as a percentage of total CD45+ cells. Statistical differences in (D), (E) and (G) were determined via Kruskal-Wallis tests with false discovery rate (FDR) adjustments, with * P < 0.05, ** P < 0.01, *** P < 0.001, and **** P < 0.0001.
Figure 5
Figure 5. Immune complexity correlates with therapeutic response to neoadjvant GVAX therapy in pancreatic ductal adenocarcinoma (PDAC)
(A) Two adjacent FFPE sections from human PDAC tissues derived from neoadjuvant GVAX-treated (N = 24, see Table S3) individuals were analyzed by multiplex IHC. Representative 12-color composite images of myeloid and lymphoid biomarker panels are shown with a corresponding hematoxylin image. Biomarkers and colors are shown. The boxes represent the magnified area below. Scale bars = 500 μm (low) and 100 μm (high magnification). Corresponding single marker images are shown in Figures S6A and S6B. (B) Immune cell densities (cells/mm2) of three leukocyte hotspots in intratumoral regions (see Figure S6E) were assessed by multiplex IHC/image cytometry, in analogues to Figure 4C. A heat map according to color scale (upper left) is shown with a dendrogram of unsupervised hierarchical clustering, depicting low and high myeloid-inflamed subgroups. (C) Immune cell densities of lymphoid and myeloid cell lineages comparing subgroups in (B). Bars, boxes and whiskers represent median, interquartile range and range, respectively. (D) Ratios of cell percentages comparing subgroups are shown. Bars show median with interquartile range. Statistical differences in (C) and (D) were determined via Kruskal-Wallis tests, with * P < 0.05, and ** P < 0.01. (E) Kaplan-Meier analysis of neoadjuvant GVAX-treated PDAC cohort (N = 24) stratified by subgroups. Statistical significance was determined via log-rank test.
Figure 6
Figure 6. In situ T cell functional biomarker assessment elucidates CD8+ T cell status in non-responders to neoadjuvant GVAX treatment
(A) T cell functional biomarker panel is shown as digital scans of bright field sequential IHC derived from a single FFPE section of human tonsil tissue. Scale bar = 100 μm. Corresponding single marker images are shown in Figure S7A. (B) Representative images from PDAC tissue including lymphoid aggregates. Biomarkers and colors are shown. Boxes represent the magnified area below. Scale bars = 500 μm (low) and 100 μm (high magnification). See also Figure S7B. (C) Gating strategy for image cytometry of the T cell functional biomarker. (D) CD8+ T cells in neoadjuvant GVAX-treated PDAC tissues (N = 24) were assessed by T cell functional biomarker panel in three regions per tissue matched to analyzed regions in Figure 5C. Left pie charts represent average of CD8+ T cell percentages of total CD45+ cells, comparing low and high myeloid-inflamed profiles defined in Figure 5C. Middle pie charts show average percentages showing a composition of CD8+ T cells stratified by PD-1 and Eomes expression. Box whisker plots in right show Ki67+ percentages evaluated in each CD8+ T cell subpopulation. Bars, boxes and whiskers represent median, interquartile range and range, respectively. Statistical significances between the two groups were determined via Kruskal-Wallis tests with FDR adjustments, with * P < 0.05. (E, F) Percentages of Ki67 (E) and Granzyme B (F) in CD8+ T cells in neoadjuvant GVAX-treated PDAC tissues were shown, comparing overall survival ≥ 2 y (N = 12) and < 2 y (N = 12). Statistical significances were determined via Kruskal-Wallis tests, with * P < 0.05.
Figure 7
Figure 7. Myeloid PD-L1 expression correlates with favorable prognosis following neoadjuvant GVAX treatment, and associates with CD8+ T cell activation status
(A) Multiplex IHC images showing PD-L1 expression in neoadjuvant GVAX-treated PDAC tissues. Arrows depict PD-L1+ cells, demonstrating colocalization with CD45+ CD68+ CSF1R+ macrophages. Scale bars = 100 μm. (B) PD-L1+ percentages were assessed in cell lineages shown, and comparing low (N = 12) and high (N = 12) groups in granzyme B percentages of CD8+ T cells. Median (11.7%) was used for the cutoff line of granzyme B-status. Three regions per tissue matched to analyzed regions in Figure 5C were evaluated. Statistical significances were determined via Kruskal-Wallis tests with FDR adjustments, with * P < 0.05. (C, D) Spearman correlations of granzyme B+ percentages of CD8+ T cells versus PD-L1+ percentages of total cells (C) or CD163+ tumor associated macrophages (TAMs) (D) are shown with estimated regression lines (red) in the neoadjuvant GVAX-treated PDAC cohort (N = 24). (E, F) Kaplan-Meier analyses of neoadjuvant GVAX-treated PDAC stratified by PD-L1+ percentages in CD45+ CD68+ cells (E) and CD45+ MHC class II+ cells (F). Median (15.7% and 18.7%) was used for the cutoff line of PD-L1-status for E and F, respectively. Statistical significance was determined via log-rank test.

Similar articles

Cited by

References

    1. Affara NI, Ruffell B, Medler TR, Gunderson AJ, Johansson M, Bornstein S, Bergsland E, Steinhoff M, Li Y, Gong Q, et al. B cells regulate macrophage phenotype and response to chemotherapy in squamous carcinomas. Cancer Cell. 2014;25:809–821. - PMC - PubMed
    1. Carpenter AE, Jones TR, Lamprecht MR, Clarke C, Kang IH, Friman O, Guertin DA, Chang JH, Lindquist RA, Moffat J. CellProfiler: image analysis software for identifying and quantifying cell phenotypes. Genome Biol. 2006;7:R100. - PMC - PubMed
    1. DeNardo DG, Brennan DJ, Rexhepaj E, Ruffell B, Shiao SL, Madden SF, Gallagher WM, Wadhwani N, Keil SD, Junaid SA, et al. Leukocyte complexity predicts breast cancer survival and functionally regulates response to chemotherapy. Cancer Discov. 2011;1:54–67. - PMC - PubMed
    1. Fridman WH, Pages F, Sautes-Fridman C, Galon J. The immune contexture in human tumours: impact on clinical outcome. Nat Rev Cancer. 2012;12:298–306. - PubMed
    1. Galon J, Costes A, Sanchez-Cabo F, Kirilovsky A, Mlecnik B, Lagorce-Pages C, Tosolini M, Camus M, Berger A, Wind P, et al. Type, density, and location of immune cells within human colorectal tumors predict clinical outcome. Science. 2006;313:1960–1964. - PubMed

Publication types

Substances