

Downregulation of Talin1 promotes hepatocellular carcinoma progression through activation of the ERK1/2 pathway
- PMID: 28375585
- PMCID: PMC5480078
- DOI: 10.1111/cas.13247
Downregulation of Talin1 promotes hepatocellular carcinoma progression through activation of the ERK1/2 pathway
Abstract
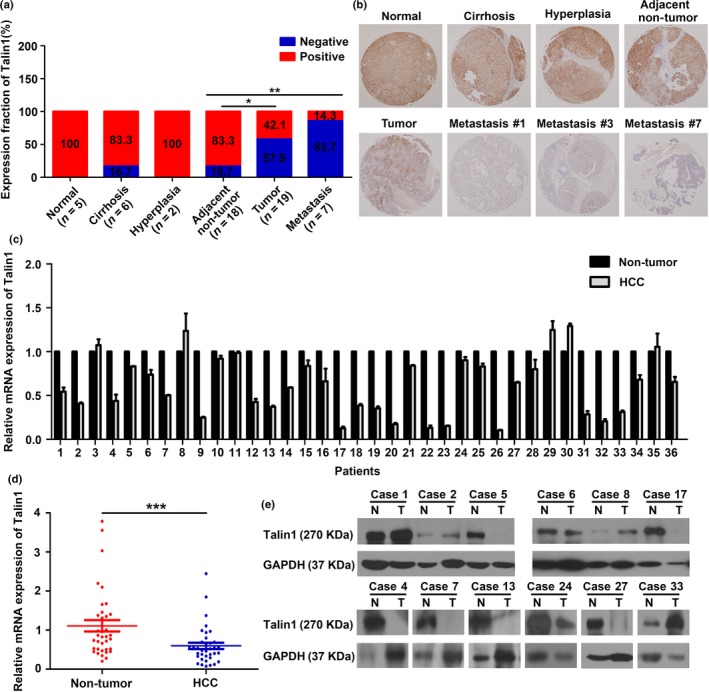
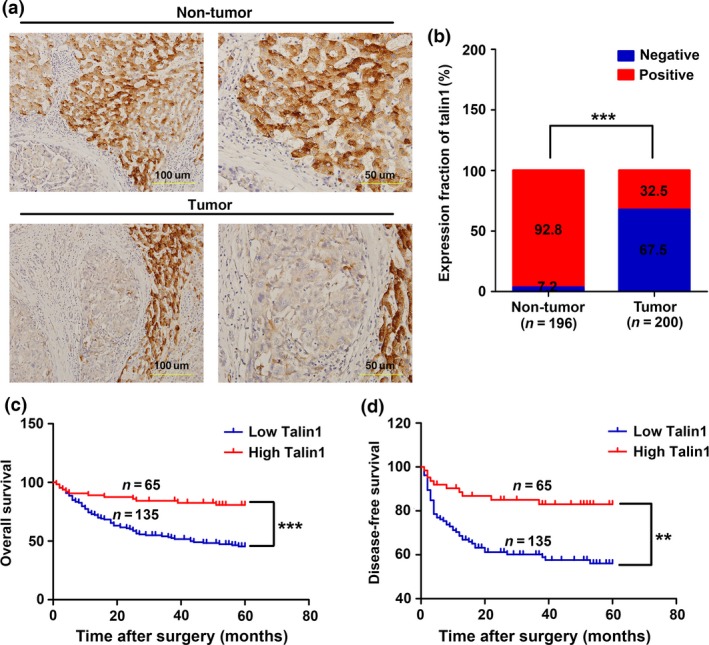
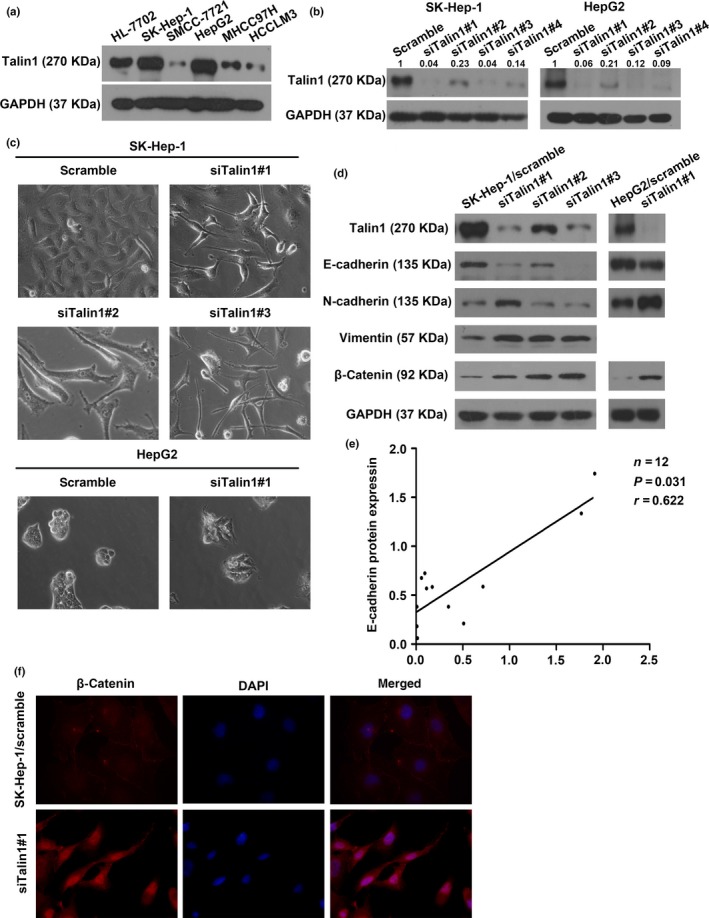
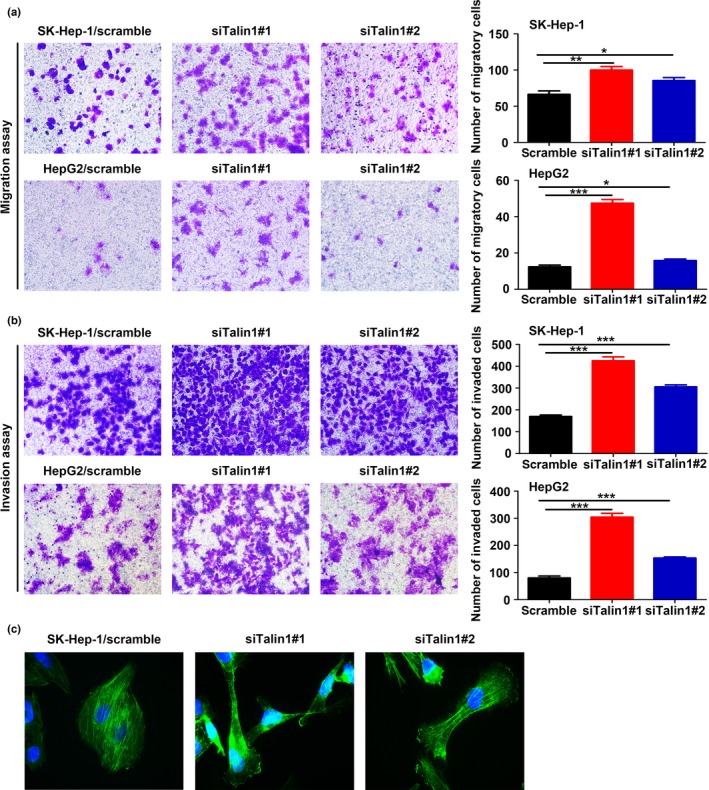
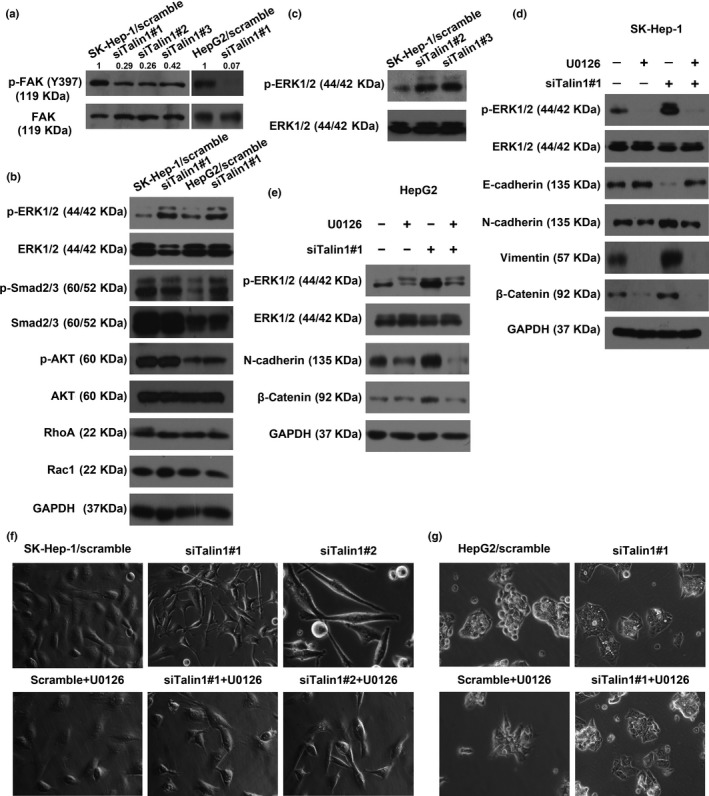
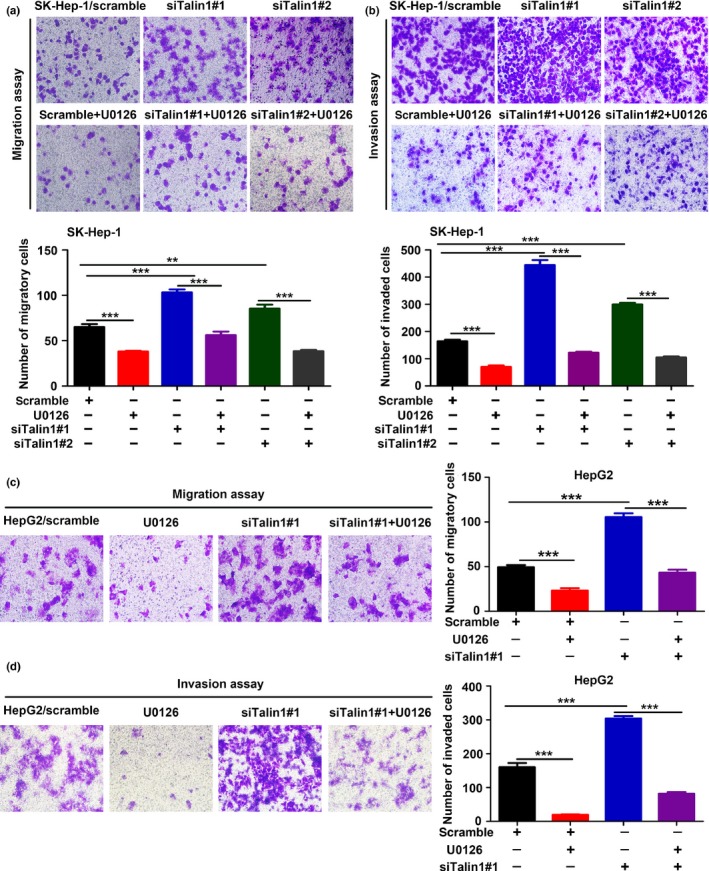
Talin1 is an adaptor protein that conjugates integrins to the cytoskeleton and regulates integrins and focal adhesion signaling. Several studies have found that Talin1 is overexpressed in several tumor types and promotes tumor progression. However, the explicit role of Talin1 in hepatocellular carcinoma (HCC) progression is still unclear and its functional mechanism remains largely unknown. In this study, we showed a trend of gradually decreasing expression of Talin1 from normal liver tissues to hepatocirrhosis, liver hyperplasia, the corresponding adjacent non-tumor, primary HCC, and eventually metastatic foci, indicating that Talin1 may correlate with HCC initiation to progression. Talin1 was significantly downregulated in HCC tissues compared with adjacent non-tumor tissues and low Talin1 expression was associated with HCC progression and poor prognosis. Furthermore, Talin1 knockdown induced epithelial-mesenchymal transition and promoted migration and invasion in SK-Hep-1 cells and HepG2 cells. Mechanistically, we found that the ERK pathway was responsible for these promoting effects of Talin1 knockdown in HCC cells. The promoting effects of Talin1 knockdown on epithelial-mesenchymal transition, migration, and invasion were reversed by U0126, a specific ERK1/2 inhibitor. Taken together, our results suggested that Talin1 might serve as a tumor suppressor in HCC and a potential prognostic biomarker for HCC patients.
Keywords: ERK1/2 pathway; Epithelial-mesenchymal transition; Talin1; hepatocellular carcinoma; prognostic biomarker.
© 2017 The Authors. Cancer Science published by John Wiley & Sons Australia, Ltd on behalf of Japanese Cancer Association.
Figures
Similar articles
-
MicroRNA-451: epithelial-mesenchymal transition inhibitor and prognostic biomarker of hepatocelluar carcinoma.Oncotarget. 2015 Jul 30;6(21):18613-30. doi: 10.18632/oncotarget.4317. Oncotarget. 2015. PMID: 26164082 Free PMC article.
-
HCRP1 downregulation promotes hepatocellular carcinoma cell migration and invasion through the induction of EGFR activation and epithelial-mesenchymal transition.Biomed Pharmacother. 2017 Apr;88:421-429. doi: 10.1016/j.biopha.2017.01.013. Epub 2017 Jan 22. Biomed Pharmacother. 2017. PMID: 28122307
-
The 14-3-3σ protein promotes HCC anoikis resistance by inhibiting EGFR degradation and thereby activating the EGFR-dependent ERK1/2 signaling pathway.Theranostics. 2021 Jan 1;11(3):996-1015. doi: 10.7150/thno.51646. eCollection 2021. Theranostics. 2021. PMID: 33391517 Free PMC article.
-
ITGBL1 promotes cell migration and invasion through stimulating the TGF-β signalling pathway in hepatocellular carcinoma.Cell Prolif. 2020 Jul;53(7):e12836. doi: 10.1111/cpr.12836. Epub 2020 Jun 14. Cell Prolif. 2020. PMID: 32537856 Free PMC article.
-
MicroRNA-370 Regulates Cellepithelial-Mesenchymal Transition, Migration, Invasion, and Prognosis of Hepatocellular Carcinoma by Targeting GUCD1.Yonsei Med J. 2019 Mar;60(3):267-276. doi: 10.3349/ymj.2019.60.3.267. Yonsei Med J. 2019. PMID: 30799589 Free PMC article.
Cited by
-
Exploring prognostic value and regulation network of PPP1R1A in hepatocellular carcinoma.Hum Cell. 2022 Nov;35(6):1856-1868. doi: 10.1007/s13577-022-00771-9. Epub 2022 Aug 26. Hum Cell. 2022. PMID: 36018458
-
Talin1 promotes HCC progression by regulating NRG1/PI3K/AKT pathway.Discov Oncol. 2024 Aug 20;15(1):360. doi: 10.1007/s12672-024-01243-2. Discov Oncol. 2024. PMID: 39162903 Free PMC article.
-
Elevated Circular RNA PVT1 Promotes Eutopic Endometrial Cell Proliferation and Invasion of Adenomyosis via miR-145/Talin1 Axis.Biomed Res Int. 2021 Feb 27;2021:8868700. doi: 10.1155/2021/8868700. eCollection 2021. Biomed Res Int. 2021. PMID: 33728345 Free PMC article.
-
Cancer associated talin point mutations disorganise cell adhesion and migration.Sci Rep. 2021 Jan 11;11(1):347. doi: 10.1038/s41598-020-77911-4. Sci Rep. 2021. PMID: 33431906 Free PMC article.
-
Binding blockade between TLN1 and integrin β1 represses triple-negative breast cancer.Elife. 2022 Mar 14;11:e68481. doi: 10.7554/eLife.68481. Elife. 2022. PMID: 35285795 Free PMC article.
References
-
- Jemal A, Bray F, Center MM, Ferlay J, Ward E, Forman D. Global cancer statistics. CA Cancer J Clin 2011; 61: 69–90. - PubMed
-
- Shao YY, Shau WY, Chan SY, Lu LC, Hsu CH, Cheng AL. Treatment efficacy differences of sorafenib for advanced hepatocellular carcinoma: a meta‐analysis of randomized clinical trials. Oncology 2015; 88: 345–52. - PubMed
MeSH terms
Substances
LinkOut - more resources
Full Text Sources
Other Literature Sources
Medical
Miscellaneous
