. 2017 Mar 29;13(3):e1006695.
doi: 10.1371/journal.pgen.1006695. eCollection 2017 Mar.

Transaldolase inhibition impairs mitochondrial respiration and induces a starvation-like longevity response in Caenorhabditis elegans

Affiliations

Transaldolase inhibition impairs mitochondrial respiration and induces a starvation-like longevity response in Caenorhabditis elegans

Christopher F Bennett et al. PLoS Genet. .

Abstract

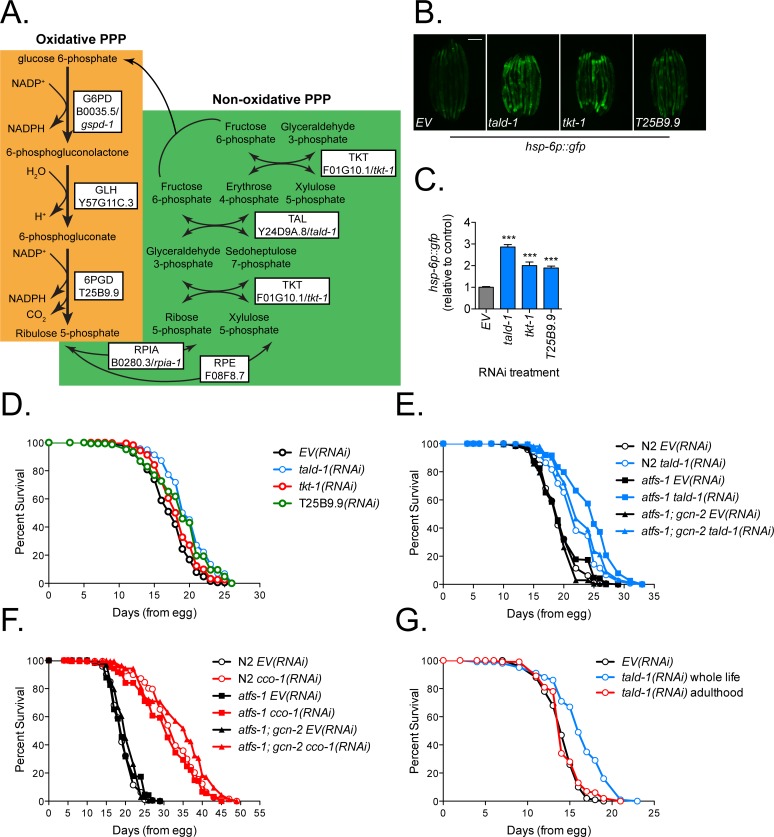
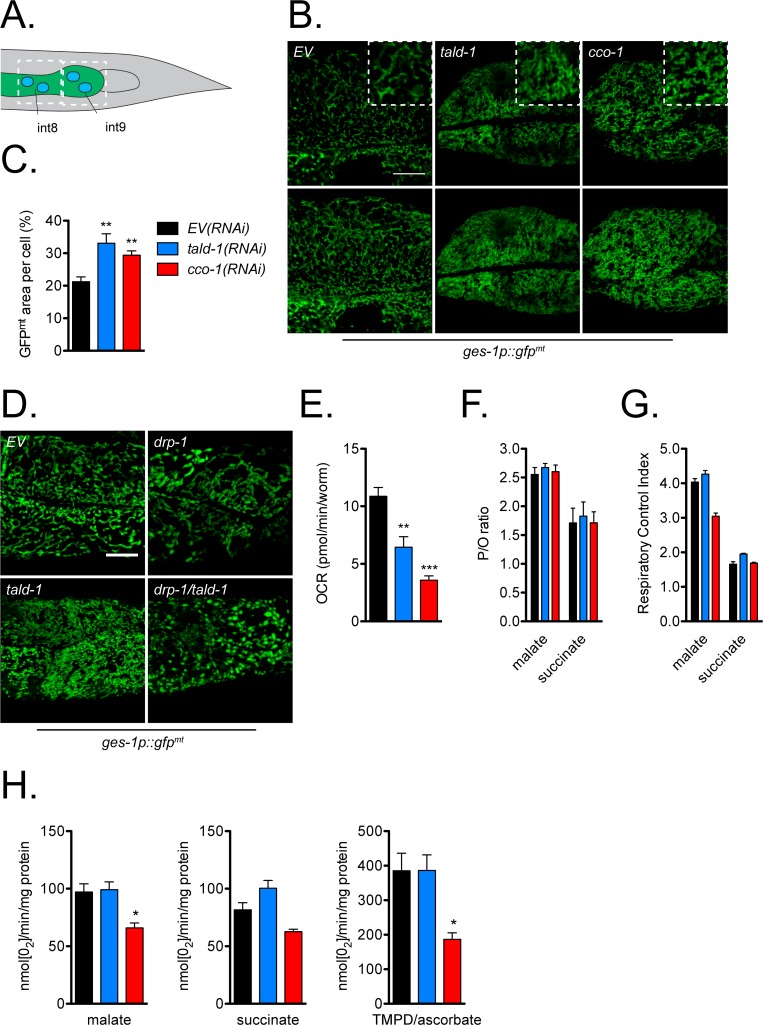
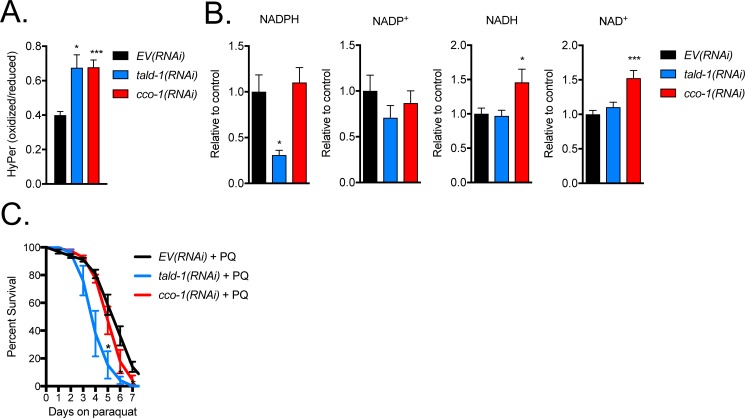
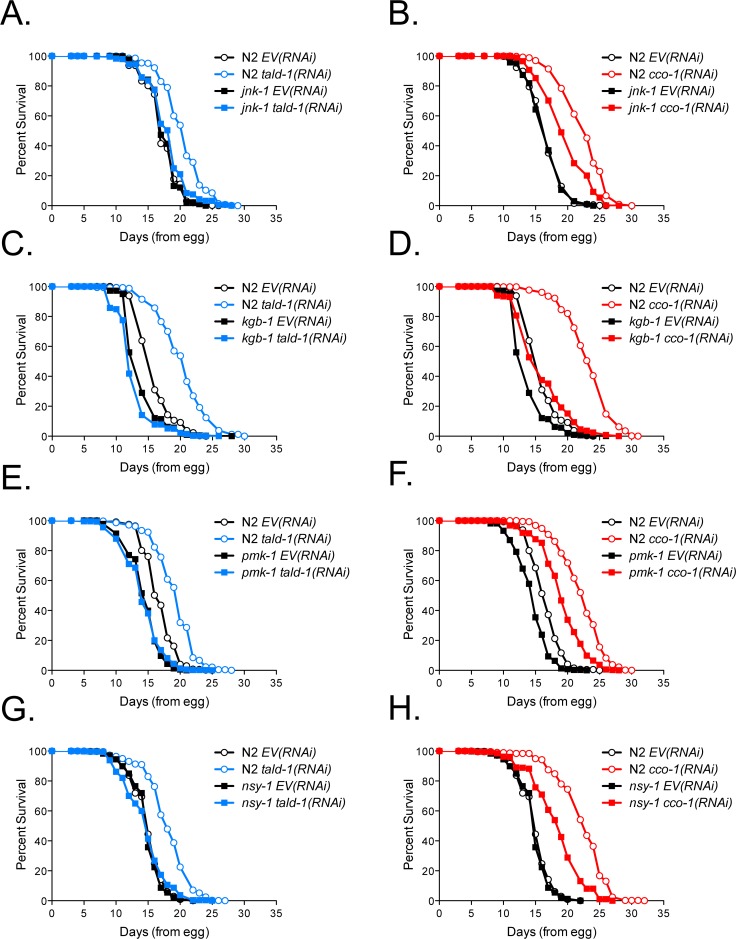
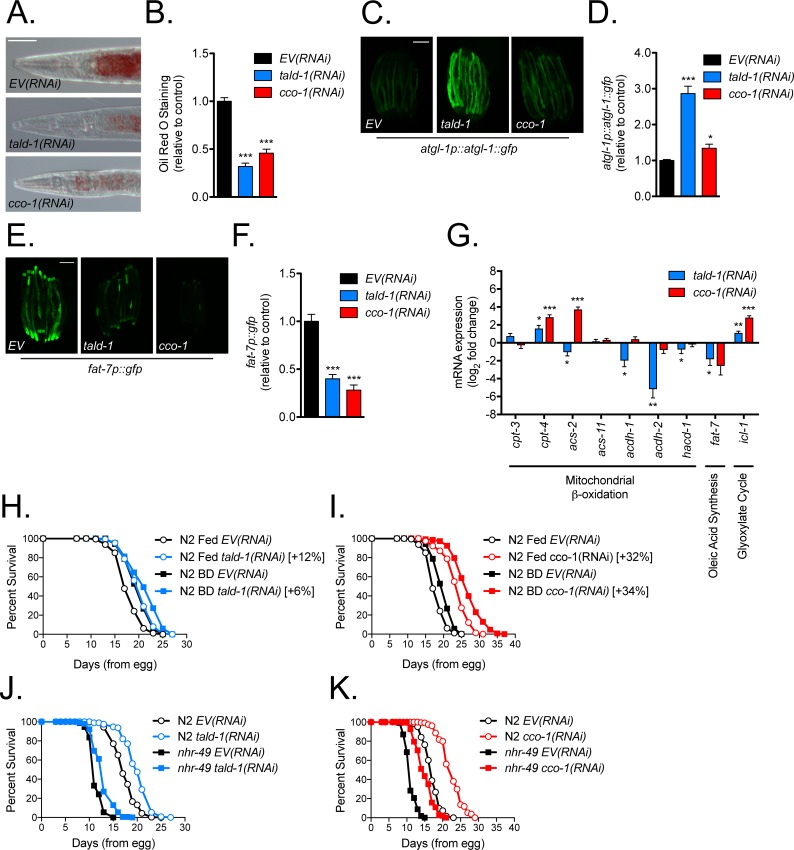
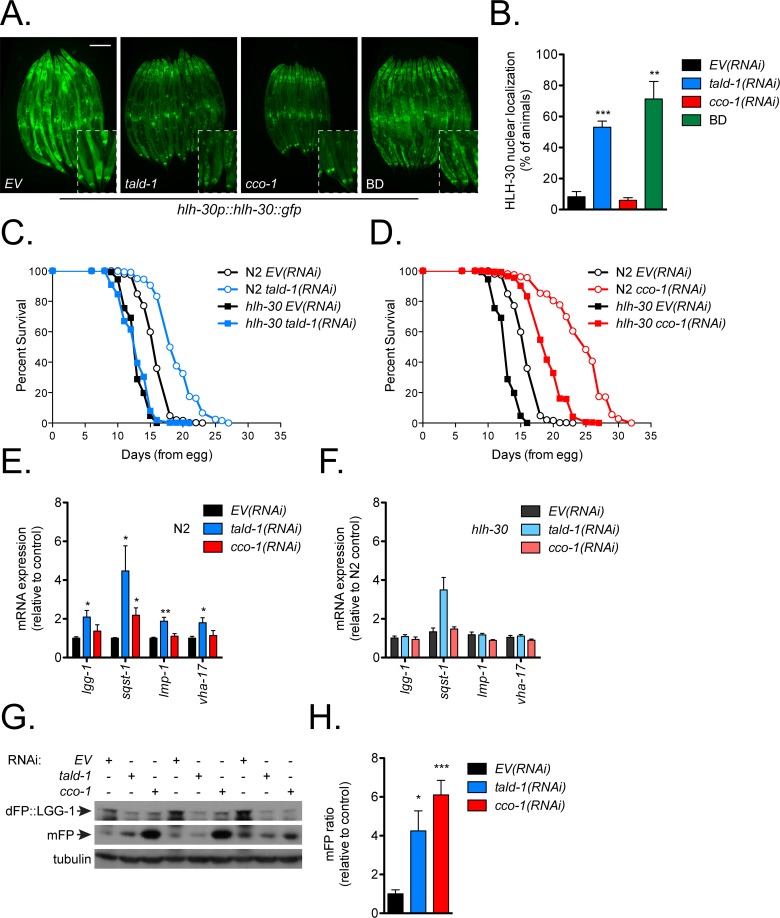
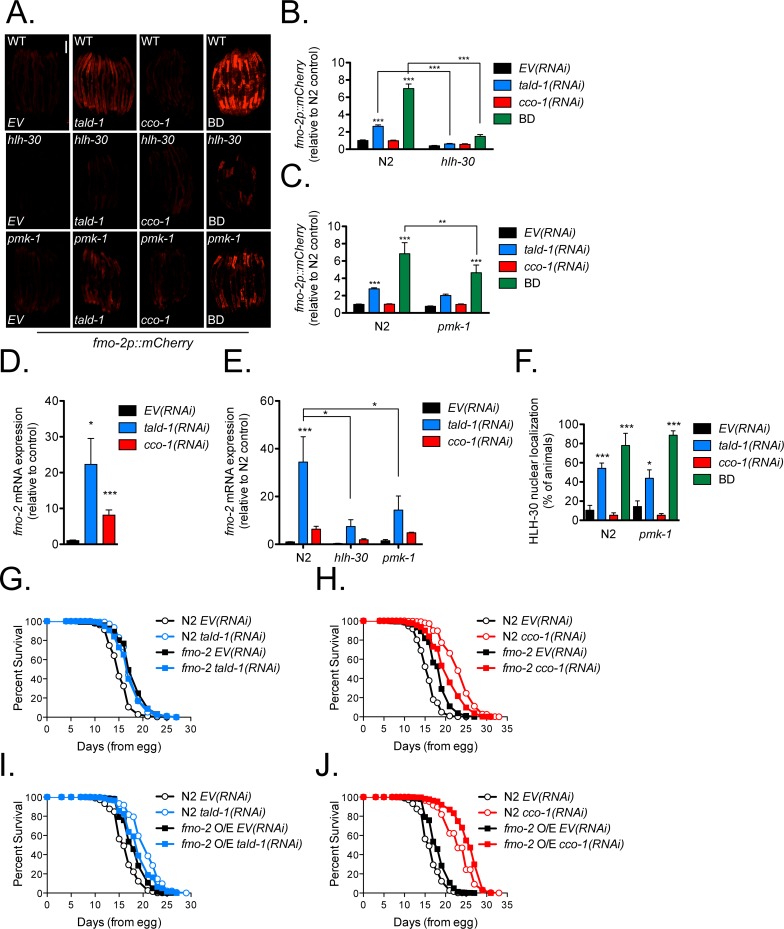
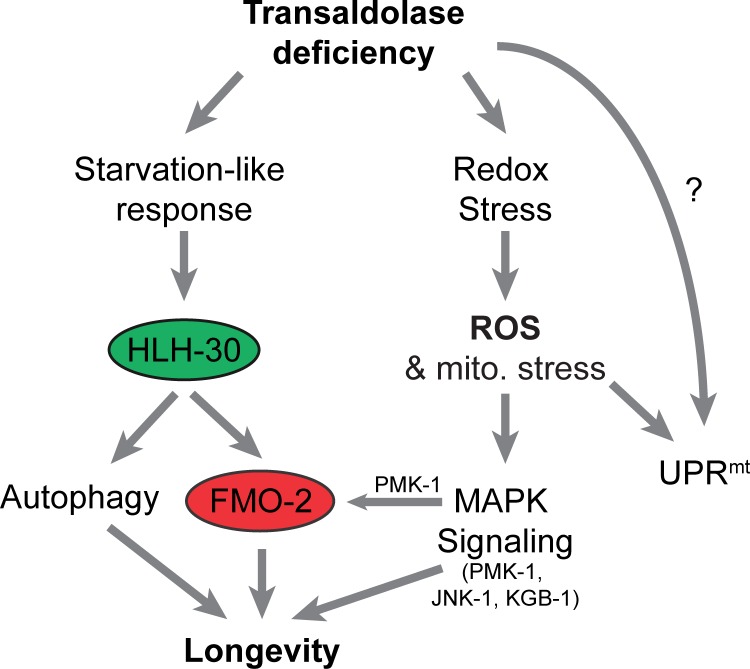
Mitochondrial dysfunction can increase oxidative stress and extend lifespan in Caenorhabditis elegans. Homeostatic mechanisms exist to cope with disruptions to mitochondrial function that promote cellular health and organismal longevity. Previously, we determined that decreased expression of the cytosolic pentose phosphate pathway (PPP) enzyme transaldolase activates the mitochondrial unfolded protein response (UPRmt) and extends lifespan. Here we report that transaldolase (tald-1) deficiency impairs mitochondrial function in vivo, as evidenced by altered mitochondrial morphology, decreased respiration, and increased cellular H2O2 levels. Lifespan extension from knockdown of tald-1 is associated with an oxidative stress response involving p38 and c-Jun N-terminal kinase (JNK) MAPKs and a starvation-like response regulated by the transcription factor EB (TFEB) homolog HLH-30. The latter response promotes autophagy and increases expression of the flavin-containing monooxygenase 2 (fmo-2). We conclude that cytosolic redox established through the PPP is a key regulator of mitochondrial function and defines a new mechanism for mitochondrial regulation of longevity.


Conflict of interest statement

The authors have declared that no competing interests exist.

Figures

Fig 1
Fig 1. Inhibition of the pentose phosphate pathway activates the UPRmt and extends lifespan.
(A) Diagram of both the oxidative and non-oxidative branches of the PPP. The oxidative branch produces NADPH, while the non-oxidative branch produces ribose-5-P and interconverts sugar carbon backbones. The white boxes contain enzyme names with the human gene listed above the C. elegans homolog. (B) PPP gene knockdown increases hsp-6p::gfp reporter expression. (C) Mean relative fluorescence of hsp-6p::gfp animals grown on PPP RNAi. Fluorescence is calculated relative to EV(RNAi) controls (N = 4 independent experiments, pooled individual worm values, error bars indicate s.e.m., student’s t-test with Bonferroni’s correction). (D) RNAi knockdown of PPP genes extends C. elegans lifespan. N2 fed EV(RNAi) (mean 17.4±0.1 days, n = 455), N2 fed tald-1(RNAi) (mean 19.9±0.2 days, n = 391), N2 fed tkt-1(RNAi) (mean 18.4±0.1 days, n = 461), N2 fed T25B9.9(RNAi) (mean 18.8±0.2 days, n = 311). Lifespans were performed at 25°C, with pooled data from four independent experiments shown. (E) RNAi knockdown of tald-1 extends lifespan independently of the UPRmt. N2 fed EV(RNAi) (mean 19.3±0.2 days, n = 192), N2 fed tald-1(RNAi) (mean 22.1±0.2 days, n = 251), atfs-1(tm4525) fed EV(RNAi) (mean 19.6±0.2 days, n = 230), atfs-1(tm4525) fed tald-1(RNAi) (mean 24.5±0.3 days, n = 228), atfs-1(tm4525);gcn-2(ok871) fed EV(RNAi) (mean 18.9±0.2 days, n = 205), atfs-1(tm4525);gcn-2(ok871) fed tald-1(RNAi) (mean 23.1±0.3 days, n = 220). Lifespans were performed at 20°C, with pooled data from two independent experiments shown. (F) RNAi knockdown of cco-1 extends lifespan independently of the UPRmt. N2 fed EV(RNAi) (mean 19.3±0.2 days, n = 192), N2 fed cco-1(RNAi) (mean 32.3±0.5 days, n = 187), atfs-1(tm4525) fed EV(RNAi) (mean 19.6±0.2 days, n = 230), atfs-1(tm4525) fed cco-1(RNAi) (mean 29±0.6 days, n = 194), atfs-1(tm4525);gcn-2(ok871) fed EV(RNAi) (mean 18.9±0.2 days, n = 205), atfs-1(tm4525);gcn-2(ok871) fed cco-1(RNAi) (mean 32.6±0.5 days, n = 228). Lifespans were performed at 20°C, with pooled data from two independent experiments shown. (G) RNAi knockdown of tald-1 extends lifespan only when knockdown occurs during development. N2 fed EV(RNAi) (mean 14.2±0.1 days, n = 361), N2 fed tald-1(RNAi) from hatching (mean 16.4±0.2 days, n = 468), N2 fed tald-1(RNAi) from L4 (mean 14.4±0.1 days, n = 330). Lifespans were performed at 25°C, with pooled data from three independent experiments shown. Lifespans in this figure are indicated as mean±s.e.m. and statistical analysis is provided in S1 Table. In this figure, statistics are displayed as: * p<0.05, ** p<0.01, *** p<0.001.
Fig 2
Fig 2. Transaldolase deficiency alters mitochondrial morphology and decreases in vivo mitochondrial respiration.
(A) Diagram depicting the posterior intestinal cells that were visualized for mitochondrial morphology. (B) Intestinal mitochondrial morphology is altered by tald-1(RNAi) and cco-1(RNAi). The top panel represents a single 0.34 μm slice imaged using confocal microscopy, with a magnified area displayed in a white dotted box to highlight morphology differences. The bottom panel consists of a max intensity projection of five z-slices to emphasize mitochondrial content in these cells. Scale bar, 10 μm. (C) Quantification of percent mitochondrial area per cell. (N = 2 independent experiments, error bars indicate s.e.m., student’s t-test with Bonferroni’s correction). (D) Mitochondrial morphology changes from tald-1(RNAi) are regulated by DRP-1. RNAi treatments include EV(RNAi), tald-1(RNAi) [50:50 with EV(RNAi)], drp-1(RNAi) [50:50 with EV(RNAi)], and tald-1(RNAi) [50:50 with drp-1(RNAi)]. Scale bar, 10 μm. (E) Oxygen consumption rate decreases with tald-1(RNAi) and cco-1(RNAi). OCR was measured using the Seahorse XF Analyzer and normalized to animal number (N = 6 independent experiments, error bars indicate s.e.m., student’s t-test with Bonferroni’s correction). (F) P/O ratio (the ATP produced per oxygen atom reduced), (G) respiratory control index (State 3:State 4 rates), (H) malate-driven respiration (Complex I-IV), succinate-driven respiration (Complex II-IV), and TMPD/ascorbate-driven respiration (Complex IV) were measured using the OXPHOS assay on isolated mitochondria from RNAi treated animals. Respiratory rates were measured as rate of disappearance of oxygen (nmol[O2]) per minute per mg protein (N = 4 independent experiments, error bars indicate s.e.m., student’s t-test with Bonferroni’s correction). Also, in this figure, color coating of bars and lines reflect the legend in (C).
Fig 3
Fig 3. Redox stress is downstream of transaldolase deficiency.
(A) H2O2 levels increase from RNAi knockdown of tald-1 or cco-1 (N = 7 independent experiments, error bars indicate s.e.m., student’s t-test with Bonferroni’s correction). (B) NADPH levels decrease from RNAi knockdown of tald-1 (N = 5+ biological replicates, error bars indicate s.e.m., student’s t-test with Bonferroni’s correction). (C) RNAi knockdown of tald-1 causes sensitivity to paraquat (PQ). Percent survival of N2 worms grown on RNAi bacteria and 10 mM PQ was measured over seven days. Survival analyses were performed at 25°C (N = 6 independent experiments, error bars indicate s.e.m., student’s t-test with Bonferroni’s correction). In this figure, statistics are displayed as: * p<0.05, ** p<0.01, *** p<0.001.
Fig 4
Fig 4. Lifespan extension from tald-1(RNAi) or cco-1(RNAi) requires stress-activated MAPKs.
(A) RNAi knockdown of tald-1 extends lifespan through the JNK MAPK JNK-1. N2 fed EV(RNAi) (mean 17.2±0.1 days, n = 506), N2 fed tald-1(RNAi) (mean 20.4±0.1 days, n = 500), jnk-1(gk7) fed EV(RNAi) (mean 17±0.1 days, n = 582), jnk-1(gk7) fed tald-1(RNAi) (mean 18.1±0.1 days, n = 488). Lifespans were performed at 25°C, with pooled data from five independent experiments shown. (B) RNAi knockdown of cco-1 extends lifespan partially through the JNK MAPK JNK-1. N2 fed EV(RNAi) (mean 16.9±0.1 days, n = 494), N2 fed cco-1(RNAi) (mean 22.7±0.2 days, n = 431), jnk-1(gk7) fed EV(RNAi) (mean 16.1±0.1 days, n = 594), jnk-1(gk7) fed cco-1(RNAi) (mean 19.9±0.2 days, n = 408). Lifespans were performed at 25°C, with pooled data from four independent experiments shown. (C) RNAi knockdown of tald-1 extends lifespan through the JNK MAPK KGB-1. N2 fed EV(RNAi) (mean 15±0.1 days, n = 630), N2 fed tald-1(RNAi) (mean 18.7±0.1 days, n = 657), kgb-1(um3) fed EV(RNAi) (mean 13.1±0.1 days, n = 580), kgb-1 fed tald-1(RNAi) (mean 11.9±0.1 days, n = 600). Lifespans were performed at 25°C, with pooled data from four independent experiments shown. (D) RNAi knockdown of cco-1 extends lifespan partially through the JNK MAPK KGB-1. N2 fed EV(RNAi) (mean 15±0.1 days, n = 630), N2 fed cco-1(RNAi) (mean 23.2±0.2 days, n = 511), kgb-1(um3) fed EV(RNAi) (mean 13.1±0.1 days, n = 580), kgb-1 fed cco-1(RNAi) (mean 15.8±0.2 days, n = 501). Lifespans were performed at 25°C, with pooled data from four independent experiments shown. (E) RNAi knockdown of tald-1 extends lifespan through the p38 MAPK PMK-1. N2 fed EV(RNAi) (mean 16.8±0.1 days, n = 494), N2 fed tald-1(RNAi) (mean 19.3±0.1 days, n = 460), pmk-1(km25) fed EV(RNAi) (mean 14.3±0.1 days, n = 514), pmk-1(km25) fed tald-1(RNAi) (mean 14±0.1 days, n = 525). Lifespans were performed at 25°C, with pooled data from four independent experiments shown. (F) RNAi knockdown of cco-1 does not require the p38 MAPK PMK-1 for lifespan extension. N2 fed EV(RNAi) (mean 16±0.1 days, n = 575), N2 fed cco-1(RNAi) (mean 22.3±0.2 days, n = 448), pmk-1(km25) fed EV(RNAi) (mean 13.8±0.1 days, n = 609), pmk-1(km25) fed cco-1(RNAi) (mean 18.7±0.1 days, n = 535). Lifespans were performed at 25°C, with pooled data from four independent experiments shown. (G) RNAi knockdown of tald-1 extends lifespan through the MAP3K NSY-1. N2 fed EV(RNAi) (mean 14.6±0.1 days, n = 542), N2 fed tald-1(RNAi) (mean 17.2±0.1 days, n = 599), nsy-1(ag3) fed EV(RNAi) (mean 14.9±0.1 days, n = 473), nsy-1(ag3) fed tald-1(RNAi) (mean 14.4±0.1 days, n = 508). Lifespans were performed at 25°C, with pooled data from four independent experiments shown. (H) RNAi knockdown of cco-1 extends lifespan partially through the MAP3K NSY-1. N2 fed EV(RNAi) (mean 14.6±0.1 days, n = 542), N2 fed cco-1(RNAi) (mean 22.5±0.2 days, n = 454), nsy-1(ag3) fed EV(RNAi) (mean 14.9±0.1 days, n = 473), nsy-1(ag3) fed cco-1(RNAi) (mean 18.5±0.2 days, n = 458). Lifespans were performed at 25°C, with pooled data from four independent experiments shown. Lifespans in this figure are indicated as mean±s.e.m. and statistical analysis is provided in S1 Table.
Fig 5
Fig 5. Transaldolase deficiency causes a starvation-like response that decreases animal fat content and rewires lipid metabolism gene expression.
(A) Intestinal fat staining decreases from RNAi knockdown of tald-1 or cco-1. Oil Red O (ORO) staining was performed on day 3 from hatching animals propagated at 20°C. Scale bar, 50 μm. (B) Quantification of ORO staining within anterior intestine (N = 2 independent experiments, pooled individual worm values, error bars indicate s.e.m., student’s t-test with Bonferroni’s correction). (C) RNAi knockdown of tald-1 causes an increase in adipose triglyceride lipase ATGL-1 protein levels. Scale bar, 200 μm. (D) Mean relative fluorescence of ATGL-1::GFP signal in animals grown on tald-1(RNAi) or cco-1(RNAi). Fluorescence is calculated relative to EV(RNAi) controls (N = 4 independent experiments, pooled individual worm values, error bars indicate s.e.m., student’s t-test with Bonferroni’s correction). (E) RNAi knockdown of tald-1 or cco-1 causes a decrease in stearoyl-CoA desaturase fat-7p::gfp reporter expression. Scale bar, 200 μm. (F) Mean relative fluorescence of fat-7p::gfp reporter animals grown on tald-1(RNAi) or cco-1(RNAi). Fluorescence is calculated relative to EV(RNAi) controls (N = 3 independent experiments, pooled individual worm values, error bars indicate s.e.m., student’s t-test with Bonferroni’s correction). (G) Gene expression of starvation-responsive lipid metabolism genes is altered in tald-1(RNAi) animals. Log2 fold change calculated to emphasize the increases and decreases in gene expression levels from RNAi treatments (N = 6–8 independent experiments, error bars indicate s.e.m., paired student’s t-tests with Bonferroni’s correction). (H) RNAi knockdown of tald-1 does not robustly extend lifespan of BD animals. N2 fed EV(RNAi) (mean 18.2±0.2 days, n = 161), N2 fed tald-1(RNAi) (mean 20.4±0.2 days, n = 151), BD animals developed on EV(RNAi) (mean 20.2±0.2 days, n = 123), BD animals developed on tald-1(RNAi) (mean 21.5±0.3 days, n = 150). Lifespans were performed at 25°C, with one experiment shown. (I) RNAi knockdown of cco-1 extends lifespan dissimilar from BD. N2 fed EV(RNAi) (mean 18.2±0.2 days, n = 161), N2 fed cco-1(RNAi) (mean 24±0.3 days, n = 156), BD animals developed on EV(RNAi) (mean 20.2±0.2 days, n = 123), BD animals developed on cco-1(RNAi) (mean 27.1±0.3 days, n = 148). Lifespans were performed at 25°C, with one experiment shown. (J) RNAi knockdown of tald-1 does not require NHR-49 for lifespan extension. N2 fed EV(RNAi) (mean 17.5±0.1 days, n = 366), N2 fed tald-1(RNAi) (mean 20.1±0.1 days, n = 397), nhr-49(nr2041) fed EV(RNAi) (mean 11.5±0.1 days, n = 310), nhr-49(nr2041) fed tald-1(RNAi) (mean 12.9±0.1 days, n = 333). Lifespans were performed at 25°C, with pooled data from three independent experiments shown. (K) RNAi knockdown of cco-1 does not require NHR-49 for lifespan extension. N2 fed EV(RNAi) (mean 17±0.1 days, n = 532), N2 fed cco-1(RNAi) (mean 22.6±0.2 days, n = 344), nhr-49(nr2041) fed EV(RNAi) (mean 11.1±0.1 days, n = 495), nhr-49(nr2041) fed cco-1(RNAi) (mean 15±0.1 days, n = 489). Lifespans were performed at 25°C, with pooled data from four independent experiments shown. Lifespans in this figure are indicated as mean±s.e.m. and statistical analysis is provided in S1 Table. In this figure, statistics are displayed as: * p<0.05, ** p<0.01, *** p<0.001.
Fig 6
Fig 6. HLH-30 mediates the lifespan extension and autophagy gene expression from tald-1(RNAi).
(A) RNAi knockdown of tald-1 increases nuclear localization of HLH-30 similarly to starvation. BD animals were starved for 8 hours on FUDR plates prior to imaging. Scale bar, 200 μm. (B) Percent of animals displaying HLH-30 nuclear localization. (N = 8 independent experiments, error bars indicate s.e.m., student’s t-test with Bonferroni’s correction). (C) HLH-30 is required for the lifespan extension from tald-1(RNAi). N2 fed EV(RNAi) (mean 16±0.1 days, n = 476), N2 fed tald-1(RNAi) (mean 19.2±0.1 days, n = 455), hlh-30(tm1978) fed EV(RNAi) (mean 12.9±0.1 days, n = 510), hlh-30(tm1978) fed tald-1(RNAi) (mean 12.9±0.1 days, n = 514). Lifespans were performed at 25°C, with pooled data from four independent experiments shown. (D) HLH-30 is not required for the lifespan extension from cco-1(RNAi). N2 fed EV(RNAi) (mean 16±0.1 days, n = 476), N2 fed cco-1(RNAi) (mean 24.3±0.2 days, n = 362), hlh-30(tm1978) fed EV(RNAi) (mean 12.9±0.1 days, n = 510), hlh-30(tm1978) fed cco-1(RNAi) (mean 19.2±0.1 days, n = 533). Lifespans were performed at 25°C, with pooled data from four independent experiments shown. (E) Gene expression of autophagy genes is upregulated in tald-1(RNAi) animals (N = 6 biological replicates, error bars indicate s.e.m., student’s t-test with Bonferroni’s correction). (F) HLH-30 is required for the upregulation of autophagy genes by tald-1(RNAi). qRT-PCR was performed on RNA isolated from hlh-30(tm1978) animals (N = 3 biological replicates, error bars indicate s.e.m., student’s t-test with Bonferroni’s correction). (G) Autophagic flux increases from RNAi knockdown of tald-1 or cco-1. Western blot analysis was performed on protein lysates from eft-3p::dFP::lgg-1 animals using an anti-GFP antibody to detect full-length dFP-LGG-1 and monomeric FP. An anti-α-tubulin antibody was used as a loading control. Three biological replicates for each RNAi treatment are presented. (H) Quantification of the dFP::LGG-1 ratiometric reporter. The intensity of monomeric FP to full-length dFP::LGG-1 was measured to determine autophagic flux (N = 5 independent experiments, error bars indicate s.e.m., student’s t-test with Bonferroni’s correction). Lifespans in this figure are indicated as mean±s.e.m. and statistical analysis is provided in S1 Table. In this figure, statistics are displayed as: * p<0.05, ** p<0.01, *** p<0.001.
Fig 7
Fig 7. The flavin-containing monooxygenase FMO-2 is upregulated in a HLH-30 and PMK-1 dependent fashion and regulates the lifespan extension from tald-1(RNAi).
(A) fmo-2p::mCherry reporter expression is increased by tald-1(RNAi) or BD in a HLH-30 and PMK-1 dependent fashion. BD animals were starved for 24 hours on FUDR plates prior to imaging. Scale bar, 200 μm. (B) Mean relative fluorescence of fmo-2p::mCherry reporter animals in the context of the hlh-30(tm1978) mutation. Fluorescence is calculated relative to N2 EV(RNAi) controls (N = 3 independent experiments, pooled individual worm values, error bars indicate s.e.m., ANOVA with Bonferroni’s post-hoc). (C) Mean relative fluorescence of fmo-2p::mCherry reporter animals in the context of the pmk-1(km25) mutation. Fluorescence is calculated relative to N2 EV(RNAi) controls (N = 5 independent experiments, pooled individual worm values, error bars indicate s.e.m., ANOVA with Bonferroni’s post-hoc). (D) Gene expression of fmo-2 is upregulated by tald-1(RNAi) or cco-1(RNAi) (N = 11 biological replicates, error bars indicate s.e.m., student’s t-test with Bonferroni’s correction). (E) Gene expression of fmo-2 is upregulated by tald-1(RNAi) in a HLH-30 and PMK-1 dependent fashion (N = 3–6 biological replicates, error bars indicate s.e.m., ANOVA with Bonferroni’s post-hoc). (F) Percent of animals displaying HLH-30 nuclear localization. BD animals were starved for 8 hours on FUDR plates prior to imaging (N = 5 independent experiments, error bars indicate s.e.m., ANOVA with Bonferroni’s post-hoc). (G) FMO-2 is required for the lifespan extension from tald-1(RNAi). N2 fed EV(RNAi) (mean 15.3±0.1 days, n = 341), N2 fed tald-1(RNAi) (mean 17.8±0.1 days, n = 353), fmo-2(ok2147) fed EV(RNAi) (mean 18±0.2 days, n = 314), fmo-2(ok2147) fed tald-1(RNAi) (mean 17.4±0.2 days, n = 382). Lifespans were performed at 25°C, with pooled data from three independent experiments shown. (H) FMO-2 is partially required for the lifespan extension from cco-1(RNAi). N2 fed EV(RNAi) (mean 15.7±0.1 days, n = 562), N2 fed cco-1(RNAi) (mean 23.3±0.2 days, n = 616), fmo-2(ok2147) fed EV(RNAi) (mean 18.3±0.1 days, n = 474), fmo-2(ok2147) fed cco-1(RNAi) (mean 20.5±0.2 days, n = 473). Lifespans were performed at 25°C, with pooled data from five independent experiments shown. (I) Lifespan extension from fmo-2 overexpression is not additive with tald-1(RNAi). N2 fed EV(RNAi) (mean 16.5±0.1 days, n = 453), N2 fed tald-1(RNAi) (mean 20.6±0.1 days, n = 421), eft-3p::fmo-2 fed EV(RNAi) (mean 18.2±0.1 days, n = 439), eft-3p::fmo-2 fed tald-1(RNAi) (mean 19.1±0.1 days, n = 435). Lifespans were performed at 25°C, with pooled data from three independent experiments shown. (J) Lifespan extension from fmo-2 overexpression is additive with cco-1(RNAi). N2 fed EV(RNAi) (mean 16.5±0.1 days, n = 453), N2 fed cco-1(RNAi) (mean 23.3±0.2 days, n = 259), eft-3p::fmo-2 fed EV(RNAi) (mean 18.2±0.1 days, n = 439), eft-3p::fmo-2 fed cco-1(RNAi) (mean 25.5±0.2 days, n = 352). Lifespans were performed at 25°C, with pooled data from three independent experiments shown. Lifespans in this figure are indicated as mean±s.e.m. and statistical analysis is provided in S1 Table. In this figure, statistics are displayed as: * p<0.05, ** p<0.01, *** p<0.001.
Fig 8
Fig 8. Model of transaldolase deficiency mediated longevity.
Reduced activity of the pentose phosphate pathway enzyme transaldolase has several consequences, including inhibition of mitochondrial respiration, induction of a mitochondrial stress response, alterations in redox homeostasis, and activation of a starvation-like metabolic response. Lifespan extension in response to transaldolase deficiency appears to be mediated by both MAPK signaling and HLH-30 mediated induction of autophagy and activation of FMO-2.

Similar articles

Cited by

References

    1. Harman D. The biologic clock: the mitochondria? J Am Geriatr Soc. 1972;20(4):145–7. - PubMed
    1. Barja G. The mitochondrial free radical theory of aging. Prog Mol Biol Transl Sci. 2014;127:1–27. 10.1016/B978-0-12-394625-6.00001-5 - DOI - PubMed
    1. Wang Y, Hekimi S. Mitochondrial dysfunction and longevity in animals: Untangling the knot. Science. 2015;350(6265):1204–7. 10.1126/science.aac4357 - DOI - PubMed
    1. Dillin A, Hsu AL, Arantes-Oliveira N, Lehrer-Graiwer J, Hsin H, Fraser AG, et al. Rates of behavior and aging specified by mitochondrial function during development. Science. 2002;298(5602):2398–401. 10.1126/science.1077780 - DOI - PubMed
    1. Lee SS, Lee RY, Fraser AG, Kamath RS, Ahringer J, Ruvkun G. A systematic RNAi screen identifies a critical role for mitochondria in C. elegans longevity. Nat Genet. 2003;33(1):40–8. 10.1038/ng1056 - DOI - PubMed

Publication types

MeSH terms

Substances