. 2017 Apr 3;214(4):1011-1027.
doi: 10.1084/jem.20161616. Epub 2017 Mar 28.

CXCR1 remodels the vascular niche to promote hematopoietic stem and progenitor cell engraftment

Affiliations

CXCR1 remodels the vascular niche to promote hematopoietic stem and progenitor cell engraftment

Bradley W Blaser et al. J Exp Med. .

Abstract

The microenvironment is an important regulator of hematopoietic stem and progenitor cell (HSPC) biology. Recent advances marking fluorescent HSPCs have allowed exquisite visualization of HSPCs in the caudal hematopoietic tissue (CHT) of the developing zebrafish. Here, we show that the chemokine cxcl8 and its receptor, cxcr1, are expressed by zebrafish endothelial cells, and we identify cxcl8/cxcr1 signaling as a positive regulator of HSPC colonization. Single-cell tracking experiments demonstrated that this is a result of increases in HSPC-endothelial cell "cuddling," HSPC residency time within the CHT, and HSPC mitotic rate. Enhanced cxcl8/cxcr1 signaling was associated with an increase in the volume of the CHT and induction of cxcl12a expression. Finally, using parabiotic zebrafish, we show that cxcr1 acts HSPC nonautonomously to improve the efficiency of donor HSPC engraftment. This work identifies a mechanism by which the hematopoietic niche remodels to promote HSPC engraftment and suggests that cxcl8/cxcr1 signaling is a potential therapeutic target in patients undergoing hematopoietic stem cell transplantation.


Figures

Figure 1.
Figure 1.
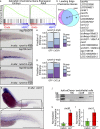
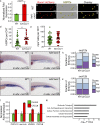
Gene expression profiling and a gain-of-function screen identify potential regulators of HSPC colonization. (a) GSEA enrichment plots for the chemokine gene set in embryonic and adult endothelial cells and HSCs. In both plots, genes enriched in endothelial cells are plotted to the left and genes enriched in HSCs are plotted to the right (P = 0.000 for both comparisons). (b) Overlap of the leading-edge chemokine genes from the embryonic and adult GSEA. (c–g) Leading edge genes were induced by heat shock at 36 and 48 hpf, followed by fixation at 72 hpf and WISH using a mix of runx1/c-myb probes to mark HSCs and HSPCs. Representative animals injected with heat shock inducible plasmids encoding GFP (c), cxcr1 (d), and cxcl8 (f) are shown. Bars, 100 µm. Bar plots (e and g) show blinded scoring data for runx1/c-myb staining in the CHT of CXCR1 (e) and CXCL8 (g) groups compared with GFP control (Wilcoxon rank sum test, P = 0.033, n = 43 for GFP control, and n = 20 for CXCR1; P = 0.0028; n = 15 for GFP control and n = 26 for CXCL8). Both experiments were repeated twice with similar results. Representative experiments are shown. To account for clutch-to-clutch variability in staining, all experimental groups were compared only to controls from the same clutch. (h and i) WISH for cxcr1 expression in a WT 48 hpf embryo. The images are representative of two separate clutches. Bars, 700 µm. (j) Expression of cxcl8 and cxcr1 mRNA in endothelial cells freshly sorted from 72 hpf kdrl:mCherry embryos. (k and l) Sorted endothelial cells were treated with EET or DMSO (control) for 30 min before assessment of cxcl8 (k) and cxcr1 (l) expression by qRT-PCR. Experiments in j–l were repeated twice, with similar results.
Figure 2.
Figure 2.
Cxcl8/cxcr1 signaling is a positive regulator of HSPC colonization. (a) Transmitted light image of a 72 hpf embryo. HSCs and HSPCs were enumerated in the entire CHT (black box) using digital image analysis as described in the text. The red box shows the approximate area selected for the representative images below. Bar, 300 µm. (b–d) GFP or cxcr1 was overexpressed by heat shock induction at 36 and 48 hpf and HSPC colonization of the CHT was quantified at 72 hpf. Representative fluorescence images (bi and ci), digital image segmentation (bii and cii), and overlays (biii and ciii) are shown. (d) GFP and CXCR1 groups were compared using Student’s t test (P = 0.020, n = 10 for GFP control; n = 16 for CXCR1). The experiment was repeated twice; combined results are shown. (e–g) GFP or cxcr1 was overexpressed as in panels b-d except that heat shock induction was performed at 48 and 60 hpf with imaging at 84 hpf (P = 0.023, Student’s t test, n = 15 for GFP control and n = 13 for CXCR1). The experiment was repeated twice; combined results are shown. (h–k) Runx1:mCherry;cxcl8+/− animals were in-crossed to generate Runx1:mCherry;cxcl8+/+ (h), Runx1:mCherry;cxcl8+/− (i), and Runx1:mCherry;cxcl8−/− (j) animals. Animals were imaged at 72 hpf and HSPC colonization of the CHT was quantified (k; P = 0.02 for the comparison of +/+ and −/− groups; Student’s t test; n = 17 for +/+, n = 9 for +/−, and n = 10 for −/− groups). The experiment was repeated four times; combined results are shown. Bars, 20 µm. (l) Expression of GFP or cxcr2 was induced by heat shock at 36 and 48 hpf, as before. Animals were imaged at 72 hpf, and HSPCs were enumerated in the CHT. Groups were compared using Student’s t test (p = NS; n = 14 for GFP control and n = 12 for cxcr2). The experiment was repeated twice with similar results; combined results are shown.
Figure 3.
Figure 3.
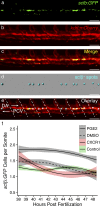
Induction of cxcr1 at 36 hpf does not enhance HSPC emergence. Scl-β:GFP;kdrl:mCherry transgenic animals were injected with DNA encoding cxcr1 or empty vector (Control) and gene expression was induced by heat shock at 36 hpf. Uninjected animals were treated with DMSO or PGE2 beginning at the 16-somite stage and served as additional negative and positive controls. The AGM region was imaged from 38–49 hpf. (a–e) Representative fluorescence images showing sclβ-GFP (a), kdrl:mCherry (b), merged GFP and mCherry channels (c), sclβ+ spots identified by digital image analysis and an overlay image with somite boundaries and dorsal aorta (DA) and posterior cardinal vein (PCV) marked (e). Bar = 70 µm. (f) Time series plot showing the cumulative numbers of sclβ:GFP+ cells in the AGM of each group (n = 9 for PGE2, n = 5 for DMSO, n = 10 for control, and n = 6 for CXCR1). Colored bands represent 95% confidence intervals. The experiment was repeated twice with similar results; a representative experiment is shown.
Figure 4.
Figure 4.
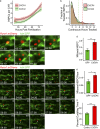
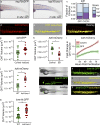
Overexpression of cxcr1 increases HSPC residency time, mitotic rate and endothelial cell cuddling within the CHT. (a–e) Runx1:mCherry or Runx1:mCherry;kdrl:GFP zebrafish embryos were microinjected with DNA encoding hsp70l:cxcr1 or control DNA (hsp70l:GFP or empty vector), gene expression was induced by heat shock at 36 and 48 hpf, and HSPC colonization of the CHT was quantified by time lapse video microscopy from 52 to 72 hpf. (a) Time series plot showing the number of HSPCs in each group (n = 7 for Control and n = 5 for CXCR1). Colored bands represent 95% confidence intervals. The experiment was repeated twice with similar results; a representative experiment is shown. (b) Cumulative density function showing the fraction of HSPCs tracked in the CHT for any duration of time. The area under the curve between any two points on the x-axis represents the fraction of HSPCs continuously tracked for that length of time. Dashed lines represent the lower limit of the 10% of cells with the longest CHT residency time (CXCR1 in red, Control in green). n = 10 animals, 461 total tracked HSPCs for Control and n = 6 animals, 187 total tracked HSPCs for CXCR1, P = 0.029 (Student’s t test). The experiment was repeated twice with similar results; combined results are shown. (c–e) Tracked HSPCs were followed and mitotic events were enumerated. (c) A representative mitotic event in a Runx1:mCherry;kdrl:GFP transgenic injected with DNA encoding hsp70l:cxcr1. HSPCs undergoing mitosis were observed to reduce their migration (ci) and undergo nuclear cleavage (cii-ciii), often rotating in the process, followed by release of the daughter cell (cvii). Bars, 10 µm. The number of mitotic events per HSPC is plotted in (d; P = 0.0041, Student’s t test) and the number of mitotic events per HSPC per hour of CHT residency time for that HSPC is plotted in (e; P = 0.02, Wilcoxon’s rank sum test). n = 6 animals, 122 total tracked HSPCs for GFP/Control and n = 5 animals, 107 total tracked HSPCs for CXCR1. The experiment was repeated twice with similar results; a representative experiment is shown. (f–g) Runx1:mCherry;kdrl:GFP double transgenic embryos were injected with DNA encoding empty vector or hsp70l:cxcr1 and gene expression was induced at 36 and 48 hpf, followed by time lapse microscopy. (f) Representative still frames showing an HSPC (arrow) entering an endothelial cell pocket (fi-iii), followed by cuddling (fiv-xvii) and finally exit from the endothelial cell pocket (fxviii). Numbers in the bottom left corner of each frame represent hh:mm after fertilization; this track lasted for 8.5 h and produced one mitotic event (fvi, arrowhead). Bar, 20 µm. (g) The time that each tracked HSPC spent cuddled in the endothelial cell pocked is plotted as a percent of the overall track duration within the CHT (P = 6.28 × 10⁻⁷, Wilcoxon’s rank sum test). n = 5 animals, 354 tracked HSPCs for Control and n = 3 animals, 114 tracked HSPCs for CXCR1. The experiment was repeated twice with similar results; a representative experiment is shown.
Figure 5.
Figure 5.
Cxcl8/cxcr1 signaling in endothelial cells induces gene expression changes favoring HSPC colonization. (a) Kdrl:cxcr1;kdrl:mCherry zebrafish and kdrl:mCherry clutchmates (WT) were dissociated at 72 hpf, and mCherry+ endothelial cells were FACS sorted. Quantitative PCR for cxcr1 is shown. The experiment was repeated three times with similar results. (b–d) Kdrl:cxcr1;Runx1:mCherry zebrafish were imaged at 72 hpf for HSPC colonization of the CHT (a and b). Bars, 20 µm. (d) Plot showing increased HSPC colonization in kdrl:cxcr1 animals (P = 0.001, Wilcoxon’s rank sum test; n = 35 for WT control; n = 28 for kdrl:cxcr1) The experiment was repeated twice with similar results; combined results are shown. (e) Mpx:GFP (WT) and kdrl:cxcr1;mpx:GFP zebrafish were imaged at 72 hpf, and neutrophil numbers in the CHT were quantified (p = NS, Student’s t test; n = 47 for WT control; n = 35 for kdrl:cxcr1). The experiment was repeated three times with similar results. Combined results are shown. (f–k) Kdrl:cxcr1 and WT clutchmates were fixed at 72 hpf and WISH was performed for cxcl12a (f–h) and cxcl12b (i–k). Bar, 100 µm. h and k show the results of blinded semiquantitative scoring of CHT staining for each probe (cxcl12a: P = 0.03, Wilcoxon’s rank sum test, n = 26 for WT control and n = 34 for kdrl:cxcr1; cxcl12b: p = NS, Wilcoxon’s rank sum test, n = 19 for WT control and n = 22 for kdrl:cxcr1). The experiment was performed three times with similar results; combined results are shown. (l) HUVECs were serum starved for 12 h, and then treated with 10 ng/ml rhCXCL8 or vehicle control. Quantitative RT-PCR was performed for expression of CXCL12, CXCL8, and survivin and VEGFA. (m) RNA sequencing was performed on HUVEC RNA. IPA analysis identifying the top enriched molecular and cellular functions is shown. The HUVEC experiments were performed with biological duplicates.
Figure 6.
Figure 6.
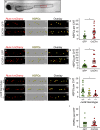
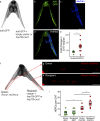
Cxcr1 signaling alters the structure of the CHT. (a–c) Overexpression of GFP (control) or cxcr1 was induced in microinjected zebrafish by heat shock at 36 and 48 hpf. (a and b) Representative WISH images for kdrl, marking endothelial cells, at 72 hpf are shown. Bars, 100 µm. (c) Blinded scoring of kdrl staining in the CHT (Wilcoxon rank sum test, P = 0.041; n = 17 for GFP control; n = 23 for cxcr1). The experiment was repeated twice with similar results; a representative experiment is shown. (d–f) Isosurface rendering of the CHT using Imaris. A representative kdrl:mCherry transgenic fish, imaged at 72 hpf, is shown (d). A three-dimensional isosurface rendering of the CHT and overlay are shown (e and f). Only the yellow portion of the isosurface was included in the volumetric analysis. Bars, 100 µm. (g–j) CHT volume was measured in kdrl:GFP or kdrl:mCherry reporter zebrafish at 72 hpf. CHT volume is plotted in µm3. (g) All zebrafish were injected with hsp70l:cxcr1 DNA and gene expression was induced in one half of the animals by heat shock at 36 and 48 hpf (Wilcoxon rank sum test, P = 0.02, n = 15 for uninduced controls and n = 15 for heat shock–induced embryos). The experiment was repeated three times with similar results, a representative experiment is shown. (h) Kdrl:mCherry transgenic fish were treated with the CXCR1/2 inhibitor SB225002 (SB) or DMSO control from 48 to 72 hpf (Student’s t test, P = 0.012; n = 9 for untreated controls; n = 7 for treated embryos). The experiment was repeated twice with similar results; a representative experiment is shown. (i) Kdrl:mCherry zebrafish were injected with hsp70l:cxcr1 DNA or hsp70l:GFP as a control followed by heat shock at 36 and 48 hpf. A time series plot showing the relative change in CHT volume from 52 to 72 hpf compared with baseline is shown. Colored bands represent 95% confidence intervals. n = 5 for GFP control and n = 5 for hsp70l:cxcr1. The experiment was repeated twice with similar results; a representative experiment is shown. (j) The CHT volume of kdrl:mCherry;kdrl:cxcr1 zebrafish and kdrl:mCherry (WT) clutchmates is shown (Student’s t test, P = 0.02; n = 9 for WT; n = 7 for kdrl:cxcr1). The experiment was repeated twice, with similar results. A representative experiment is shown. (k–p) Representative images of a lyve1b:GFP;kdrl:cxcr1 transgenic are shown. (k–m) Low power views showing expression of the lyve1b:GFP reporter transgene predominantly in the CHT. GFP expression in the heart is driven by a secondary marker transgene (cmlc:GFP) for kdrl:cxcr1. Bars, 500 µm. (n–p) High power views of the CHT in the same embryo. (n) GFP expression in the CHT and caudal vein (CV). (o) Three dimensional isosurface of the lyve1b:GFP-expressing tissues. Only the yellow portion of the isosurface is used for quantifying CHT volume. (p) Overlay of the isosurface and lyve1b:GFP expression. Bars, 100 µm. (q) The CHT volume of lyve1b:DsRed (WT) and kdrl:cxcr1;lyve1b:DsRed (kdrl:cxcr1) transgenics was measured at 72 hpf as before (P = 0.0006, Wilcoxon rank sum test; n = 23 for WT; n = 20 for kdrl:cxcr1). The experiment was repeated twice with similar results; a representative experiment is shown.
Figure 7.
Figure 7.
Cxcr1 acts stem cell nonautonomously in parabiotic zebrafish. (a–e) Uninjected kdrl:GFP embryos were fused to kdrl:GFP embryos injected with DNA encoding hsp70l:cxcr1 or empty vector (Control), and gene expression was induced at 36 and 48 hpf. Fluorescent blue dextran was used to mark the injected halves of each pair. (a-d) Low magnification views showing a representative parabiotic from this experiment in transmitted light (a), green channel (b), blue channel (c), and green/blue overlay. Bars, 500 µm. (e) The fold change in CHT volume (injected:uninjected) is plotted for Control and CXCR1 groups (P = 0.012, Student’s t test; n = 4 for Control; n = 10 for CXCR1). The experiment was repeated twice with similar results; combined results are shown. (f–i) In these parabiotic animals, donor halves are Runx1:mCherry transgenics and recipient halves are casper injected with DNA encoding hsp70l:GFP or hsp70l:cxcr1 followed by heat shock induction at 36 and 48 hpf. (f–h) Representative transmitted light and fluorescence images of these parabiotics. The CHT of the donor and recipient animal is boxed in red and shown in fluorescence in panels g and h. Bars, 100 µm. (i) Expression of cxcr1 in the recipient niche favored HSPC engraftment there over colonization of the donor autologous niche (red circles, P = 0.019, paired Student’s t test). There was no difference between donors and recipients in the GFP group (green circles). Overall HSPC numbers were also increased in donors and recipients by recipient expression of cxcr1 (donor GFP vs. CXCR1, P = 0.045, Student’s t test; recipient GFP vs. CXCR1, P = 0.007, Student’s t test). n = 6 for GFP control; n = 5 for CXCR1. The experiment was repeated twice with similar results; combined results are shown.

Similar articles

Cited by

References

    1. Adám A., Bártfai R., Lele Z., Krone P.H., and Orbán L.. 2000. Heat-inducible expression of a reporter gene detected by transient assay in zebrafish. Exp. Cell Res. 256:282–290. 10.1006/excr.2000.4805 - DOI - PubMed
    1. Ara T., Tokoyoda K., Sugiyama T., Egawa T., Kawabata K., and Nagasawa T.. 2003. Long-term hematopoietic stem cells require stromal cell-derived factor-1 for colonizing bone marrow during ontogeny. Immunity. 19:257–267. 10.1016/S1074-7613(03)00201-2 - DOI - PubMed
    1. Bertrand J.Y., Chi N.C., Santoso B., Teng S., Stainier D.Y.R., and Traver D.. 2010. Haematopoietic stem cells derive directly from aortic endothelium during development. Nature. 464:108–111. 10.1038/nature08738 - DOI - PMC - PubMed
    1. Butler J.M., Nolan D.J., Vertes E.L., Varnum-Finney B., Kobayashi H., Hooper A.T., Seandel M., Shido K., White I.A., Kobayashi M., et al. . 2010. Endothelial cells are essential for the self-renewal and repopulation of Notch-dependent hematopoietic stem cells. Cell Stem Cell. 6:251–264. 10.1016/j.stem.2010.02.001 - DOI - PMC - PubMed
    1. Cacalano G., Lee J., Kikly K., Ryan A.M., Pitts-Meek S., Hultgren B., Wood W.I., and Moore M.W.. 1994. Neutrophil and B cell expansion in mice that lack the murine IL-8 receptor homolog. Science. 265:682–684. 10.1126/science.8036519 - DOI - PubMed

Publication types

MeSH terms