

Endocytic proteins are partitioned at the edge of the clathrin lattice in mammalian cells
- PMID: 28346440
- PMCID: PMC7509982
- DOI: 10.1038/ncb3498
Endocytic proteins are partitioned at the edge of the clathrin lattice in mammalian cells
Abstract
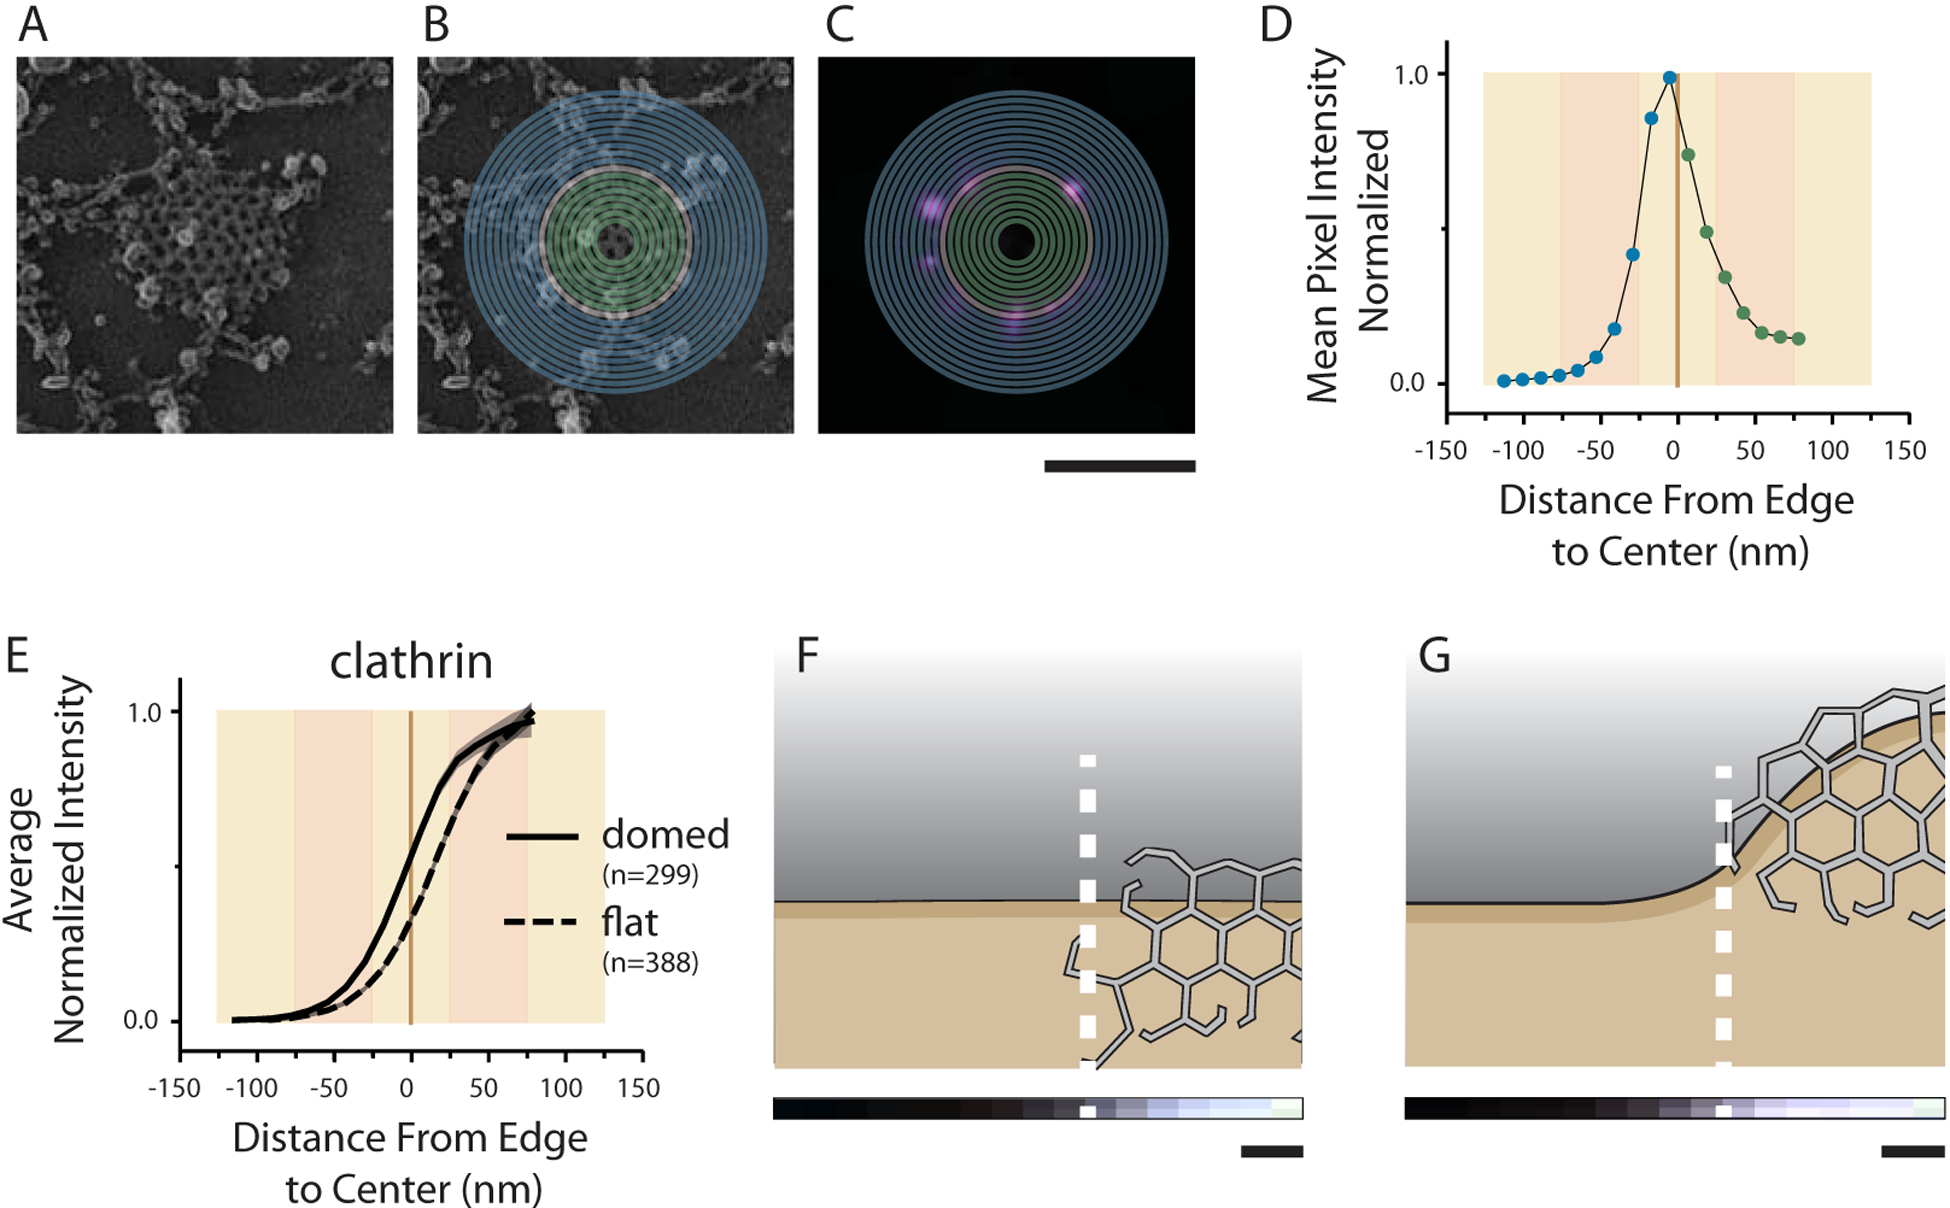
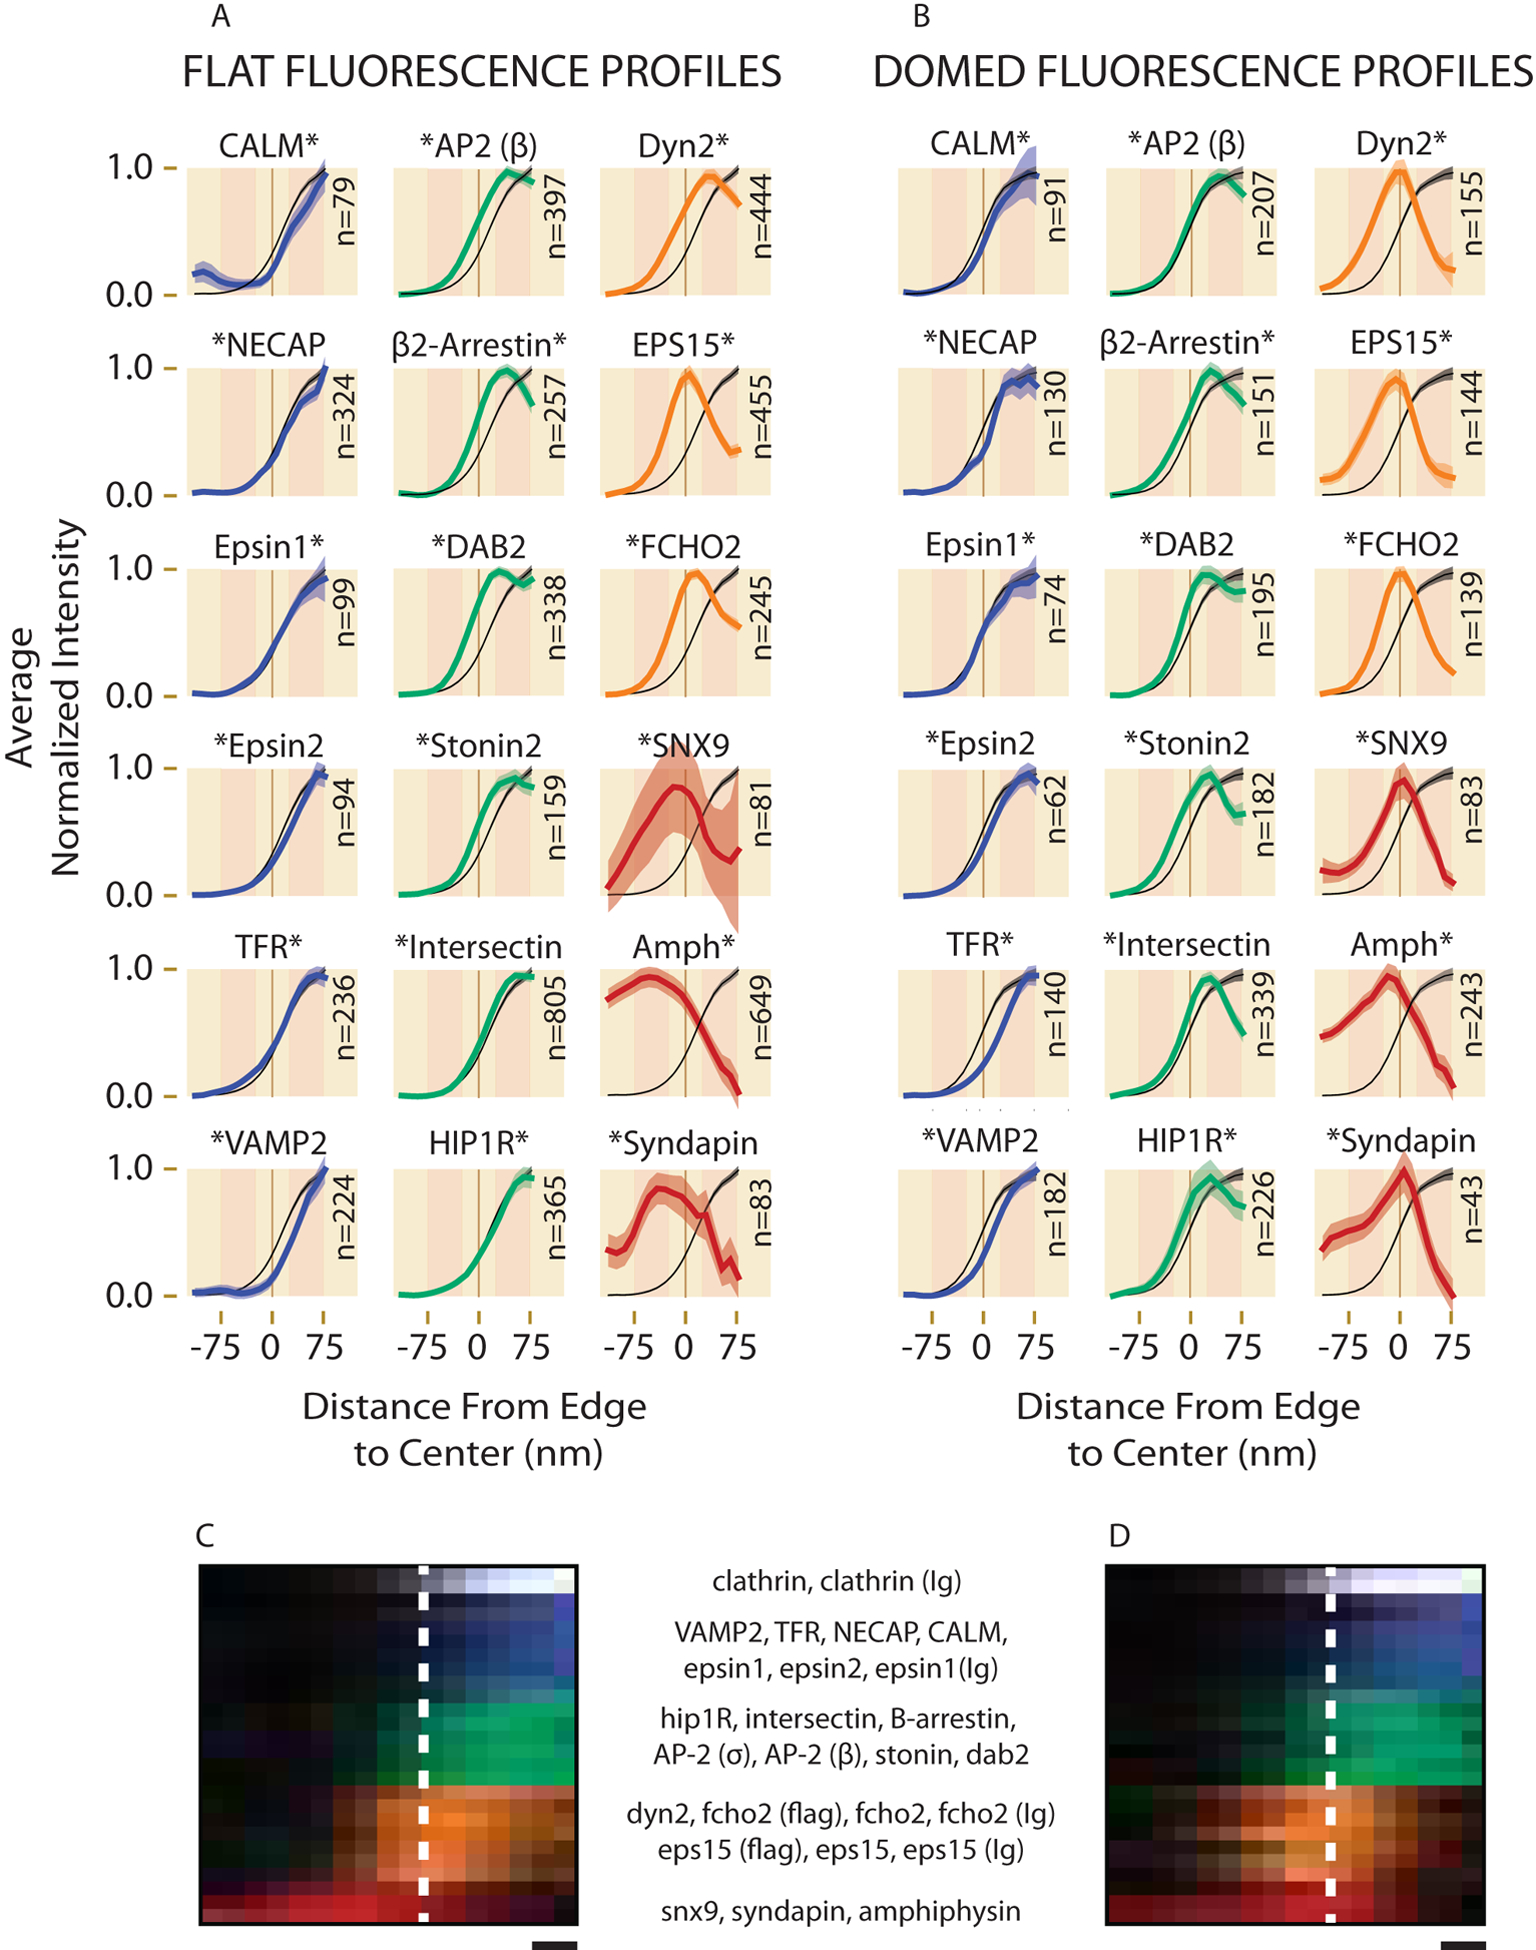
Dozens of proteins capture, polymerize and reshape the clathrin lattice during clathrin-mediated endocytosis (CME). How or if this ensemble of proteins is organized in relation to the clathrin coat is unknown. Here, we map key molecules involved in CME at the nanoscale using correlative super-resolution light and transmission electron microscopy. We localize 19 different endocytic proteins (amphiphysin1, AP2, β2-arrestin, CALM, clathrin, DAB2, dynamin2, EPS15, epsin1, epsin2, FCHO2, HIP1R, intersectin, NECAP, SNX9, stonin2, syndapin2, transferrin receptor, VAMP2) on thousands of individual clathrin structures, generating a comprehensive molecular architecture of endocytosis with nanoscale precision. We discover that endocytic proteins distribute into distinct spatial zones in relation to the edge of the clathrin lattice. The presence or concentrations of proteins within these zones vary at distinct stages of organelle development. We propose that endocytosis is driven by the recruitment, reorganization and loss of proteins within these partitioned nanoscale zones.
Conflict of interest statement
Competing Financial Interest:
The authors declare no competing financial interest.
Figures


Similar articles
-
A high precision survey of the molecular dynamics of mammalian clathrin-mediated endocytosis.PLoS Biol. 2011 Mar;9(3):e1000604. doi: 10.1371/journal.pbio.1000604. Epub 2011 Mar 22. PLoS Biol. 2011. PMID: 21445324 Free PMC article.
-
Intersectin1 promotes clathrin-mediated endocytosis by organizing and stabilizing endocytic protein interaction networks.Cell Rep. 2024 Dec 24;43(12):114989. doi: 10.1016/j.celrep.2024.114989. Epub 2024 Nov 22. Cell Rep. 2024. PMID: 39580802 Free PMC article.
-
The clathrin adaptor Dab2 recruits EH domain scaffold proteins to regulate integrin β1 endocytosis.Mol Biol Cell. 2012 Aug;23(15):2905-16. doi: 10.1091/mbc.E11-12-1007. Epub 2012 May 30. Mol Biol Cell. 2012. PMID: 22648170 Free PMC article.
-
Mechanistic divergences of endocytic clathrin-coated vesicle formation in mammals, yeasts and plants.J Cell Sci. 2024 Aug 15;137(16):jcs261847. doi: 10.1242/jcs.261847. Epub 2024 Aug 20. J Cell Sci. 2024. PMID: 39161994 Free PMC article. Review.
-
Regulation of Clathrin-Mediated Endocytosis.Annu Rev Biochem. 2018 Jun 20;87:871-896. doi: 10.1146/annurev-biochem-062917-012644. Epub 2018 Apr 16. Annu Rev Biochem. 2018. PMID: 29661000 Free PMC article. Review.
Cited by
-
Correlative single-molecule and structured illumination microscopy of fast dynamics at the plasma membrane.Nat Commun. 2024 Jul 10;15(1):5813. doi: 10.1038/s41467-024-49876-9. Nat Commun. 2024. PMID: 38987559 Free PMC article.
-
Imaging VIPER-labeled Cellular Proteins by Correlative Light and Electron Microscopy.Bio Protoc. 2019 Nov 5;9(21):e3414. doi: 10.21769/BioProtoc.3414. eCollection 2019 Nov 5. Bio Protoc. 2019. PMID: 33654913 Free PMC article.
-
Exploration and insights into the cellular internalization and intracellular fate of amphiphilic polymeric nanocarriers.Acta Pharm Sin B. 2021 Apr;11(4):903-924. doi: 10.1016/j.apsb.2021.02.019. Epub 2021 Feb 27. Acta Pharm Sin B. 2021. PMID: 33996406 Free PMC article. Review.
-
β-arrestin-dependent PI(4,5)P2 synthesis boosts GPCR endocytosis.Proc Natl Acad Sci U S A. 2021 Apr 27;118(17):e2011023118. doi: 10.1073/pnas.2011023118. Proc Natl Acad Sci U S A. 2021. PMID: 33879605 Free PMC article.
-
Load adaptation by endocytic actin networks.Mol Biol Cell. 2022 May 15;33(6):ar50. doi: 10.1091/mbc.E21-11-0589. Epub 2022 Apr 7. Mol Biol Cell. 2022. PMID: 35389747 Free PMC article.
References
-
- McMahon HT & Boucrot E Molecular mechanism and physiological functions of clathrin-mediated endocytosis. Nature reviews Molecular cell biology 12, 517–533 (2011). - PubMed
-
- Tebar F, Sorkina T, Sorkin A, Ericsson M & Kirchhausen T Eps15 is a component of clathrin-coated pits and vesicles and is located at the rim of coated pits. Journal of Biological Chemistry 271, 28727–28730 (1996). - PubMed
-
- Daumke O, Roux A & Haucke V BAR domain scaffolds in dynamin-mediated membrane fission. Cell 156, 882–892 (2014). - PubMed
Publication types
MeSH terms
Substances
Grants and funding
LinkOut - more resources
Full Text Sources
Other Literature Sources
Research Materials
Miscellaneous
