. 2017 Mar 22;7(1):299.
doi: 10.1038/s41598-017-00406-2.

The Role of Angiotensin II in Glomerular Volume Dynamics and Podocyte Calcium Handling

Affiliations

The Role of Angiotensin II in Glomerular Volume Dynamics and Podocyte Calcium Handling

Daria V Ilatovskaya et al. Sci Rep. .

Abstract

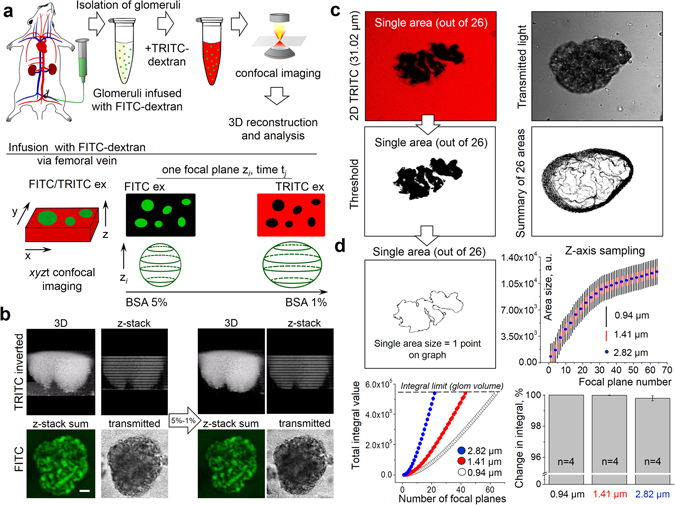
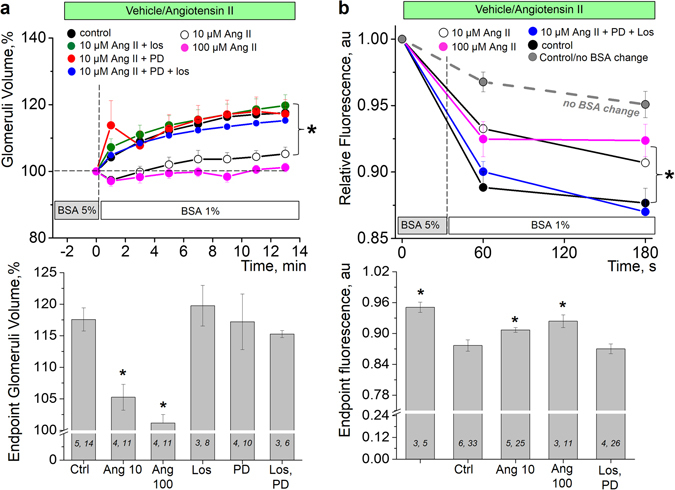
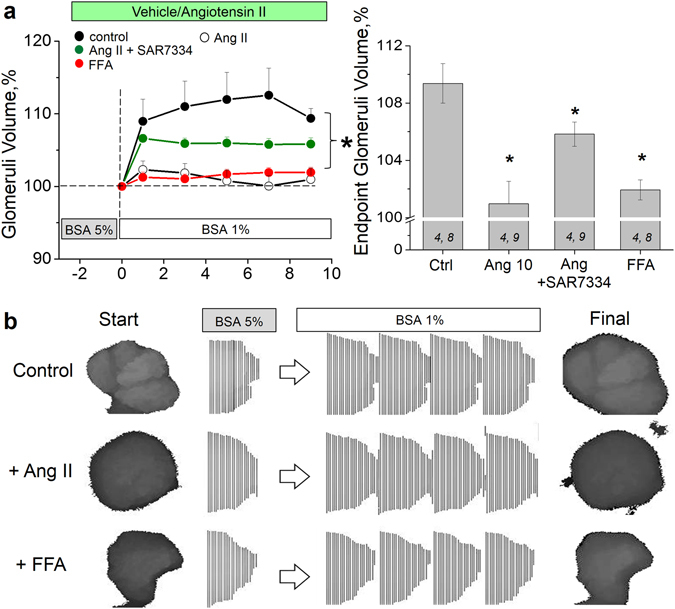
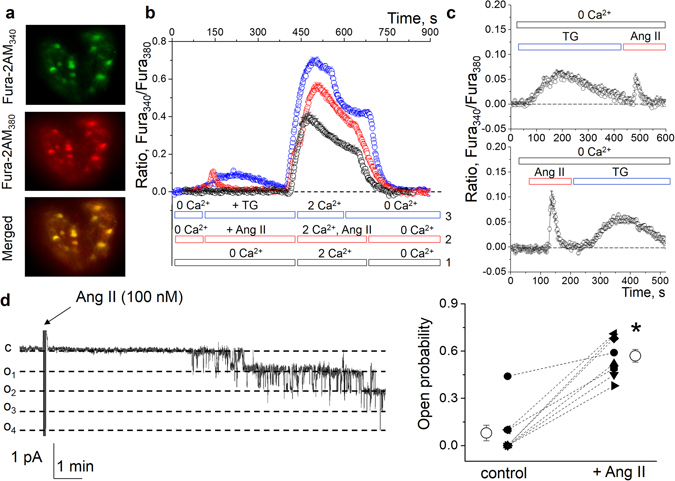
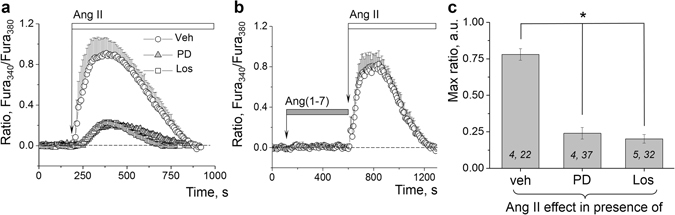
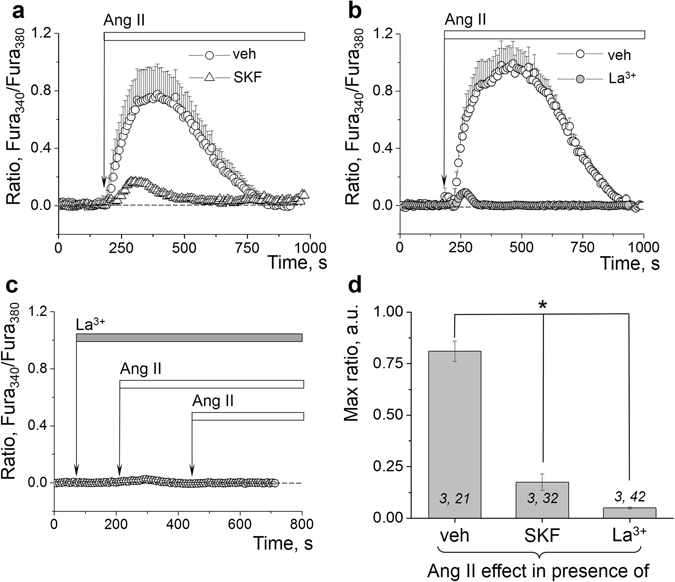
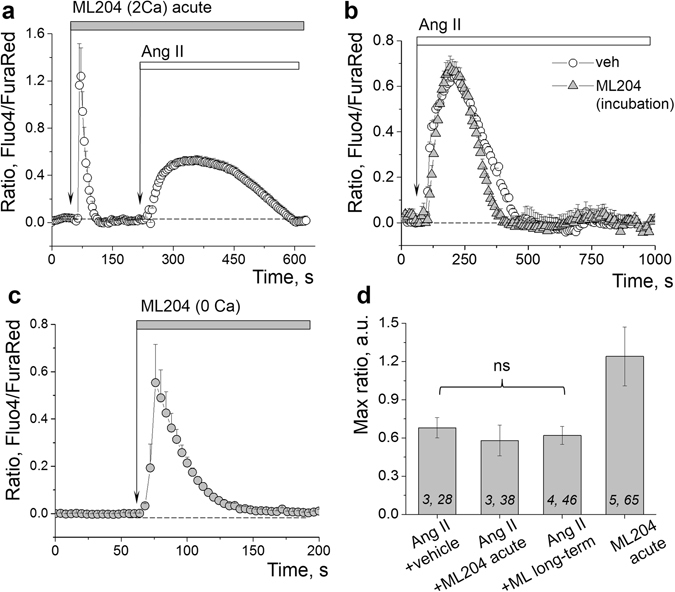
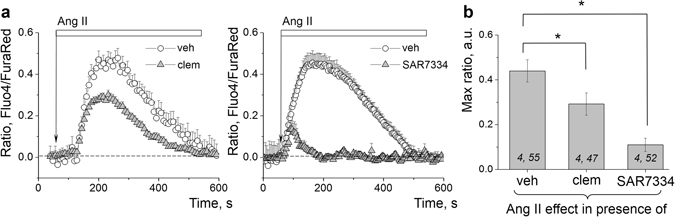
Podocytes are becoming a primary focus of research efforts due to their association with progressive glomeruli damage in disease states. Loss of podocytes can occur as a result of excessive intracellular calcium influx, and we have previously shown that angiotensin II (Ang II) via canonical transient receptor potential 6 (TRPC6) channels caused increased intracellular Ca2+ flux in podocytes. We showed here with patch-clamp electrophysiology that Ang II activates TRPC channels; then using confocal calcium imaging we demonstrated that Ang II-dependent stimulation of Ca2+ influx in the podocytes is precluded by blocking either AT1 or AT2 receptors (ATRs). Application of Ang(1-7) had no effect on intracellular calcium. Ang II-induced calcium flux was decreased upon inhibition of TRPC channels with SAR7334, SKF 96365, clemizole hydrochloride and La3+, but not ML204. Using a novel 3D whole-glomerulus imaging ex vivo assay, we revealed the involvement of both ATRs in controlling glomerular permeability; additionally, using specific inhibitors and activators of TRPC6, we showed that these channels are implicated in the regulation of glomerular volume dynamics. Therefore, we provide evidence demonstrating the critical role of Ang II/TRPC6 axis in the control of glomeruli function, which is likely important for the development of glomerular diseases.


Conflict of interest statement

The authors declare that they have no competing interests.

Figures

Figure 1
Figure 1
Schematic explanation of the measurements of glomeruli permeability and volume changes. (a) General steps of the glomeruli permeability assay: surgical preparation of the anesthetized animal and injection of 150 kDa FITC-dextran into circulation via femoral vein; glomeruli isolation, incubation and addition of 150 kDa TRITC-dextran into the solution containing FITC-labeled glomeruli; fast xyzt confocal fluorescence microscopy scanning during the changes in oncotic gradient (BSA 5% to 1%); 3D reconstruction and image analysis of glomerular volume and inner fluorescence changes. (b) Example of glomerular volume reconstitution and image analysis for the permeability assay. Fluorescence intensity was summarized from corresponding FITC values and subsequently analyzed. Also shown is a transmitted light image of a single glomerulus. Arrow illustrates solution change from 5% to 1% BSA. Scale bar is 20 µm. (c) Glomeruli volume reconstitution. To assess the glomerulus volume, images from 26 focal planes with a slice thickness of 2.82 μm were obtained along the z-axis of each glomerulus. Shown here (“2D TRITC”, left upper panel) is an example of a scanned area from the middle of the imaging stack (slice 11 out of 26, which corresponds to 31.02 μm on z-axis), that reveals a detailed structure of glomerulus (black) covered with TRITC-dextran (red). Adjusted threshold level used to calculate slice area in the Analyze Particles Module (ImageJ), as well as a 3D summary of all areas for current glomerulus are shown in the right panel. (d) Glomerular volume calculation. Shown on the left (upper panel on D) is a single area used to calculate the glomerulus volume. Right upper panel demonstrates three different sampling rates (2.82 (26 z-slices), 1.41 (52 slices) or 0.94 μm (78 slices)), each point on the graph corresponds to the size of the single area (shown on left). Total integral value for each sampling rate, and the summary bar graph (lower panel) demonstrate that independently of the size of the z-axis step, total integral value (glomerulus volume) riches the same level.
Figure 2
Figure 2
Effects of ATR blockers on rat glomeruli permeability and volume changes. (a) Activation of AT receptors by 10 or 100 µM of Ang II significantly suppresses glomeruli ability to respond to oncotic gradient changes evoked by solution change from 5% to 1% BSA (black, white and magenta data points represent control (vehicle), and 10 or 100 µM of Ang II, respectively). Inhibition of either AT1 or AT2 receptors with 10 µM losartan or 1 µM PD 123319, respectively (green and red data points) or both antagonists together (blue data points) restores normal glomeruli function and attenuates permeability. Summary graph for the endpoint glomeruli volume is shown on the lower panel. (b) Pre-application of Ang II significantly inhibits changes in glomerular FITC fluorescence and corresponding water flux across the capillary wall in response to changes in oncotic gradient. Application of ATRs blockers restores normal renal hemodynamics and attenuates glomerular permeability to protein. Summary graph for the endpoint glomeruli fluorescence is shown on the lower panel. (i,j) noted on graph is number of animals (i) and glomeruli (j) analyzed in each group, respectively. *P < 0.05 versus control experiment.
Figure 3
Figure 3
Effects of flufenamic acid and SAR7334 on rat glomeruli volume. (a) The effects of activation of TRPC6 channels by flufenamic acid (100 µM, FFA) or their blockage by SAR7334 (1 µM) on Ang II–induced glomeruli volume dynamics (left panel), and a summary plot for the endpoint glomeruli volume (right panel). (b) Representative reconstituted glomerular volumes and combined z-stacks illustrating the changes in the volume of a single glomerulus during the solution change from 5% to 1% BSA in control, and upon incubation with Ang II and FFA.
Figure 4
Figure 4
Ang II evokes [Ca2+]i elevation and activates TRPC channels in the podocytes of the freshly isolated rat glomeruli. (a) Images of the Fura-2AM-loaded glomeruli obtained by fluorescence microscopy (examples of the fluorescence signals at 340 and 380 nm, and an image merged with brightfield view are shown). (b) Representative time course of the changes in [Ca2+]i determined in podocytes of the freshly isolated glomeruli by the ratio of Fura340/Fura380 fluorescence, under three different conditions: (1) modulations in [Ca2+]i induced by changes of medium containing 0 to medium with 2 mM Ca2+ (black values); (2) medium containing 0 or 2 mM Ca2 supplemented with 1 μM Ang II (red values); and (3) medium containing 10 μM thapsigargin (TG, as shown; blue values). Please note a transient in response to Ang II in Ca2+-free media (associated with store depletion). N = 4 animals per group. (c) Ang II-stimulated [Ca2+]i peak is inhibited after calcium store depletion with TG. Shown is a [Ca2+]i response after depletion of the intracellular store with TG and consecutive treatment with Ang II, and a reverse experiment. (d) Representative continuous current trace from a cell-attached patch containing endogenous TRPC channels. Arrow demonstrates addition of Ang II (100 nM) to the external bath solution. The patch was held at a −60 mV test potential during the course of experiment. The c and oi denote closed and open current levels, respectively. Right panel shows a summary graph for the channels’ open probability (P o) before and after application of Ang II. *P < 0.05 versus before Ang II.
Figure 5
Figure 5
Ang II–dependent calcium influx in the podocytes is precluded by ATR inhibition. (a) Representative effects of losartan (Los, 10 µM, 30 min incubation) or PD 123319 (PD, 1 µM, 10 min), on Ca2+ transients evoked in the podocytes by 10 µM Ang II. (b) Illustrates the lack of an acute effect of a Mas receptor agonist Ang(1–7) on calcium influx in podocytes (concentration applied was 10 µM). (c) Summarized data for the effects of Ang II on calcium influx in the podocytes in the absence or presence of losartan or PD. (i,j) noted on graph is number of animals (i) and podocytes (j) analyzed in each group. *P < 0.01 versus Ang II.
Figure 6
Figure 6
Ang II–dependent calcium influx in the podocytes mediated via TRPC channels. (a) Representative effects of the TRPC channel blocker SKF 96365 (SKF, 1 µM, 5 min) on Ca2+ transients evoked in the podocytes by 10 µM Ang II. (b) Representative transient demonstrating that 50 µM LaCl3 (upon 10 min pre-incubation) precludes the increase in calcium influx in response to Ang II in the podocytes. (c) Transient illustrating the lack of a potentiating effect of LaCl3 on calcium influx, and immediate inhibitory effect on Ang II-evoked calcium transients (10 µM Ang II was applied twice consecutively). (d) Graph summarizing the effects of Ang II on calcium influx in the podocytes in presence of SKF or LaCl3. (i,j) noted on graph is number of animals (i) and podocytes (j) analyzed in each group. *P < 0.01 versus Ang II.
Figure 7
Figure 7
The effects of ML204 on calcium influx in the podocytes. (a) The representative effect of acute applications of 20 µM ML204 followed by 10 µM Ang II on Ca2+ level in the podocytes (in calcium-containing media). (b) Representative effect of ML204 (20 µM, 10 min incubation) on Ca2+ transient evoked in the podocytes by 10 µM Ang II. (c) The representative effect of the acute application of 20 µM ML204 on Ca2+ level in the podocytes in calcium-free solution. (d) Graph summarizing the effects of Ang II on calcium influx in the podocytes in presence of ML204, or an acute application of ML204 alone. (i,j) noted on graph is number of animals (i) and podocytes (j) analyzed in each group. ns denotes no statistically significant difference versus Ang II application in the absence of the inhibitor.
Figure 8
Figure 8
The involvement of TRPC6 channels into the Ang II–dependent calcium influx in the podocytes. (a) Representative effects of the TRPC channel blockers clemizole hydrochloride (Clem, 5 µM, 10 min) and SAR7334 (1 µM, 10 min) on Ca2+ transients evoked in the podocytes with 10 µM Ang II. (b) Graph summarizing the effects of Ang II on calcium influx in the podocytes in presence of clemizole and SAR7334. (i,j) noted on graph is number of animals (i) and podocytes (j) analyzed in each group. *P < 0.05 versus Ang II.

Similar articles

Cited by

References

    1. Scott RP, Quaggin SE. The cell biology of renal filtration. J. Cell Biol. 2015;209:199–210. doi: 10.1083/jcb.201410017. - DOI - PMC - PubMed
    1. Winn MP, et al. A mutation in the TRPC6 cation channel causes familial focal segmental glomerulosclerosis. Science. 2005;308:1801–1804. doi: 10.1126/science.1106215. - DOI - PubMed
    1. Winn MP, Daskalakis N, Spurney RF, Middleton JP. Unexpected role of TRPC6 channel in familial nephrotic syndrome: does it have clinical implications? J. Am. Soc. Nephrol. 2006;17:378–387. doi: 10.1681/ASN.2005090962. - DOI - PubMed
    1. Krall P, et al. Podocyte-specific overexpression of wild type or mutant trpc6 in mice is sufficient to cause glomerular disease. PLoS ONE. 2010;5:e12859. doi: 10.1371/journal.pone.0012859. - DOI - PMC - PubMed
    1. Wang, L. et al. Gq signaling causes glomerular injury by activating TRPC6. J. Clin. Invest. 125, 1913-26 (2015). - PMC - PubMed

Publication types