. 2017 Jun 1;77(11):2952-2963.
doi: 10.1158/0008-5472.CAN-16-1638. Epub 2017 Mar 17.

Tumor-Localized Secretion of Soluble PD1 Enhances Oncolytic Virotherapy

Affiliations

Tumor-Localized Secretion of Soluble PD1 Enhances Oncolytic Virotherapy

Mee Y Bartee et al. Cancer Res. .

Abstract

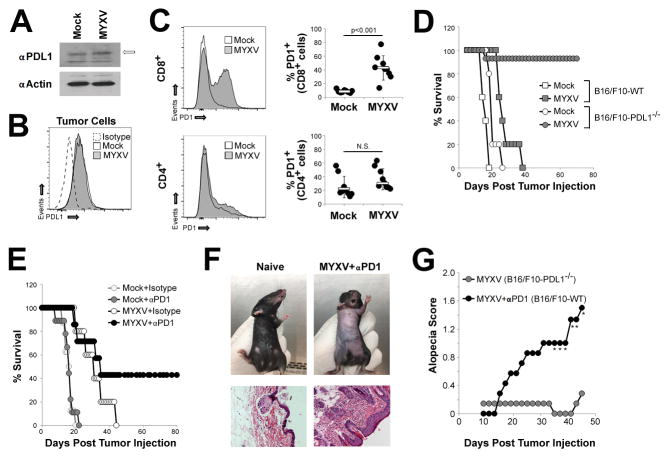
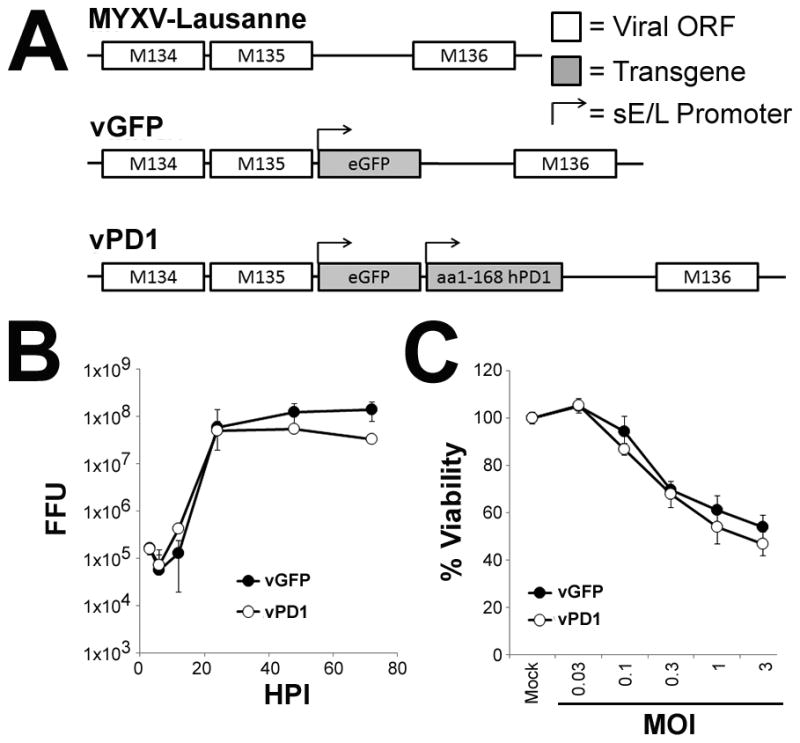
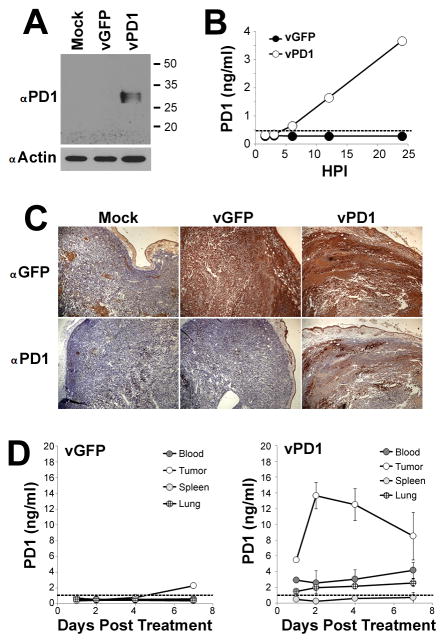
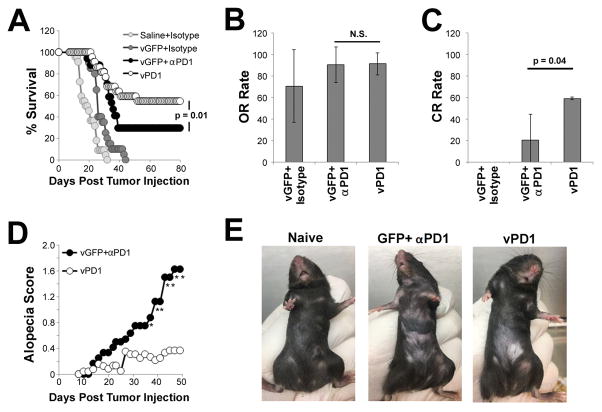
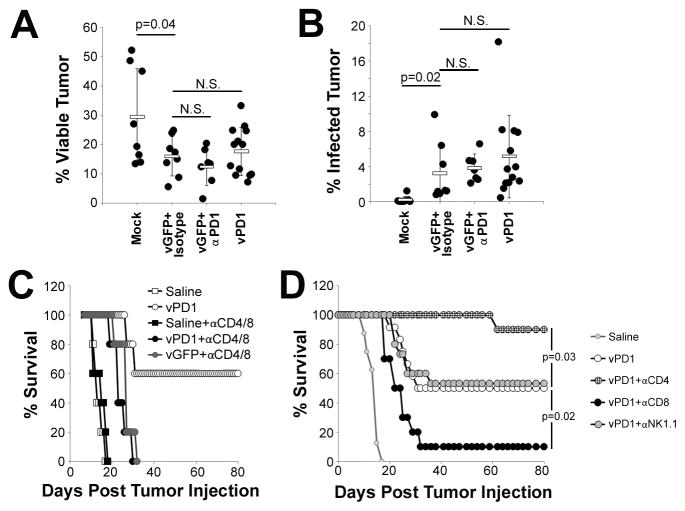
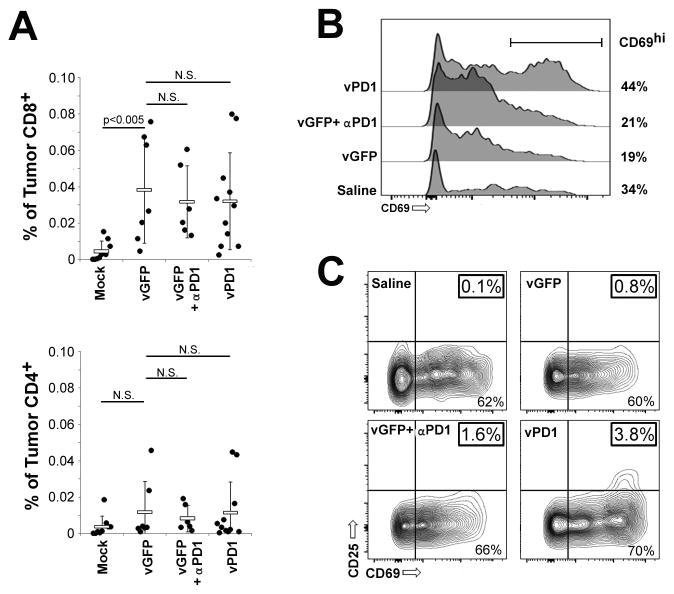
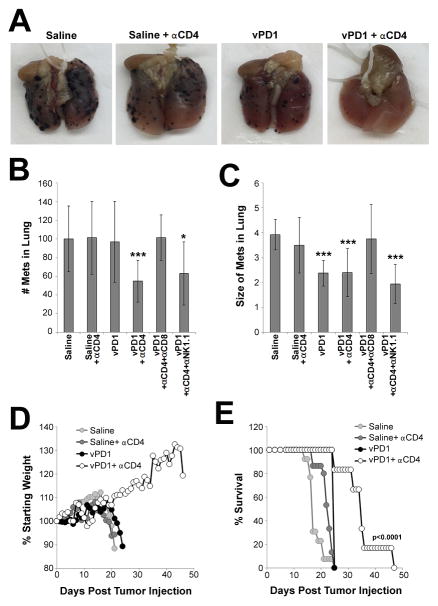
Oncolytic virotherapy represents an attractive option for the treatment of a variety of aggressive or refractory tumors. While this therapy is effective at rapidly debulking directly injected tumor masses, achieving complete eradication of established disease has proven difficult. One method to overcome this challenge is to use oncolytic viruses to induce secondary antitumor immune responses. Unfortunately, while the initial induction of these immune responses is typically robust, their subsequent efficacy is often inhibited through a variety of immunoregulatory mechanisms, including the PD1/PDL1 T-cell checkpoint pathway. To overcome this inhibition, we generated a novel recombinant myxoma virus (vPD1), which inhibits the PD1/PDL1 pathway specifically within the tumor microenvironment by secreting a soluble form of PD1 from infected cells. This virus both induced and maintained antitumor CD8+ T-cell responses within directly treated tumors and proved safer and more effective than combination therapy using unmodified myxoma and systemic αPD1 antibodies. Localized vPD1 treatment combined with systemic elimination of regulatory T cells had potent synergistic effects against metastatic disease that was already established in secondary solid organs. These results demonstrate that tumor-localized inhibition of the PD1/PDL1 pathway can significantly improve outcomes during oncolytic virotherapy. Furthermore, they establish a feasible path to translate these findings against clinically relevant disease. Cancer Res; 77(11); 2952-63. ©2017 AACR.


Figures

Figure 1
Figure 1. PD1 blockade enhances MYXV treatment of established melanoma
(A) B16/F10 cells were either mock infected or infected with MYXV at MOI=10. 24 hours post infection cells were harvested and the total level of PDL1 was analyzed using westernblot (band representing PDL1 is indicated by arrow). Expression of β Actin is shown as a loading control. Data shown is representative is three independent experiments. (B) B16/F10 cells were either mock infected or infected with MYXV at MOI=10. 24 hours post infection cells were harvested and the cell surface expression of PDL1 was analyzed using flowcytometry. Data shown is representative of two independent experiments. (C) C57/B6 mice were injected SQ with 4x10⁵ B16/F10 cells. On days 7, 9, and 11 post injection mice were given IT injection of either saline (n=9) or 1x10⁷ FFU of MYXV (n=9). On day 12, mice were euthanized and the percentage of either CD4+ or CD8+ splenocytes expressing PD1 was determined using flowcytometry. Data represents the summation of four independent experiments. Significance was determined using unpaired students T-Test. (D) C57/B6 mice were injected SQ with either 4x10⁵ B16/F10-wt or B16/F10-PDL1−/− cells. On days 7, 9, and 11 post injection mice were given IT injection of either saline (B16/F10 n=5, B16/F10-PDL1−/− n=5) or 1x10⁷ FFU of MYXV (B16/F10 n=5, B16/F10-PDL1−/− n=14). Animals were then monitored for tumor burden and euthanized when tumors reached 15mm in any direction. Data is representative of two independent experiments. (E) C57/B6 mice were injected SQ with 4x10⁵ B16/F10 cells. On day 7 post injection, mice were randomly separated into one of four cohorts: saline + isotype (n=9), saline + αPD1 antibody (n=8), MYXV + isotype (n=5), MYXV + αPD1 antibody (n=7). Viral injections consisted of 1x10⁷ FFU of MYXV and were given on days 7, 9, and 11. Antibody injections consisted of 100μg/injection and were given on days 7, 11, 14, and 18. Animals were then monitored for tumor burden and euthanized when tumors reached 15mm in any direction. Data is representative >four independent experiments. (F) Example of alopecia in mice on day 70 post-treatment and H&E stain from the belly skin of displayed animal. (G) Average alopecia score from MYXV + αPD1 antibody treated animals (n=7, shown in 1E) and B16/F10-PDL1−/− bearing animals treated with MYXV (n=14, shown in 1D). * denotes significance of p<0.05 for the indicated day and was determined using unpaired students T-Test.
Figure 2
Figure 2. Construction of MYXV expressing soluble PD1
(A) Schematic of the genomic structure of unmodified MYXV and the derivative recombinant MYXV’s vGFP and vPD1. (B) B16/F10 cells were infected with either vGFP or vPD1 at MOI=10. At the indicated times post-infection, cells were harvested and frozen. Amount of infectious virus present at each time point was then determined by mechanically lysing cells and counting the number of GFP+ foci formed following a serial titration onto BSC40 cells. Data represents summation of two independent experiments. (C) B16/F10 cells were mock infected or infected with the indicated MOI’s of either vGFP or vPD1. 24 hours post-infection, cellular viability was determined using MTT assay. Data is shown as percent viability compared to mock-infected control and represents the summation of two independent experiments. Abbreviations: FFU (foci forming units), HPI (hours post infection), MOI (multiplicity of infection), sE/L (poxviral synthetic early/late promoter).
Figure 3
Figure 3. vPD1 secretes soluble PD1 specifically within the tumor microenvironment
(A) B16/F10 cells were either mock infected or infected with vGFP or vPD1 at MOI=10. 24 hours post infection cells were harvested and the expression of intracellular PD1 was analyzed using westernblot. Expression of β Actin is shown as a loading control. Data shown is representative of two independent experiments. (B) B16/F10 cells were infected with either vGFP or vPD1 at MOI=10. At the indicated times post-infection, supernatant was collected from each infection and frozen. The concentration of soluble human PD1 in each sample was then determined using ELISA. Dotted line indicates approximate detection limit of assay. Data shown is representative of two independent experiments. (C) C57/B6 mice were injected SQ with 4x10⁵ B16/F10 cells. On day 7 post-injection, mice were treated with a single IT injection of either saline or 1x10⁷ FFU of vGFP or vPD1. 48 hours post-treatment, tumors were harvested and stained for either GFP or human PD1 using immunohistochemistry. Data shown is representative of two independent experiments each with n>5. (D) C57/B6 mice were injected SQ with 4x10⁵ B16/F10 cells. On day 7 post-injection, mice were treated with a single IT injection of either saline (n=3) or 1x10⁷ FFU of vGFP (n=3) or vPD1 (n=3). At the indicated times post infection, animals were euthanized and serum as well as the indicated tissues were harvested. Tissues were disassociated over a 40μM mesh and separated into cell and non-cell fractions. The concentration of human PD1 in the non-cell-associated fraction was then determined using ELISA. Dotted line indicates approximate detection limit of assay. Data is representative of two independent experiments.
Figure 4
Figure 4. Monotherapy with vPD1 can eradicate established melanomas
(A–C) C57/B6 mice were injected SQ with 4x10⁵ B16/F10 cells. On day 7 post injection, mice were randomly separated into one of four cohorts: saline + isotype (n=12), vGFP + isotype (n=10), vGFP + αPD1 antibody (n=17), or vPD1 (n=22). Viral injections consisted of 1x10⁷ FFU of MYXV and were given on days 7, 9, and 11. Antibody injections consisted of 100μg/injection and were given on days 7, 11, 14, and 18. (A) Animals were monitored for tumor burden and euthanized when tumors reached 15mm in any direction. Data represents summation of four independent experiments. Significance was determined using log-rank test. (B) Average overall response rates for each treatment group (defined as the number of animals surviving when the last saline treated animal was euthanized). Significance was determined by averaging response rates from four experiments and analyzing using unpaired students T-Test. (C) Average complete response rates for each treatment group (defined as animals displaying no remaining tumor burden 80 days post treatment). Significance was determined by averaging response rates from four experiments and analyzing using unpaired students T-Test. (D) Average alopecia score from vGFP + αPD1 antibody (n=12) and vPD1 (n=22) treated animals. * denotes significance of p<0.05 for the indicated day and was determined using unpaired students T-Test. (E) Example of alopecia in mice on day 70 post treatment. Abbreviations: OR (overall response), CR (compete response).
Figure 5
Figure 5. vPD1 functions through an immunotherapeutic mechanism
(A and B) C57/B6 mice were injected SQ with 4x10⁵ B16/F10 cells. On day 7 post injection, mice were randomly separated into one of four cohorts: saline (n=9), vGFP + isotype (n=7), vGFP + αPD1 antibody (n=6), or vPD1 (n=11). Viral injections consisted of 1x10⁷ FFU of MYXV and were given on days 7, 9, and 11. Antibody injections consisted of 100μg/injection and were given on days 7 and 11. On day 12, mice were euthanized and tumors were extracted and disassociated into single cells for analysis by flowcytometry. (A) Percent of tumor cells staining as viable. (B) Percent of viable tumor cells expressing detectable GFP fluorescence. Data represents summation of four independent experiments. Significance was determined using unpaired students T-Test. (C) C57/B6 mice were injected SQ with 4x10⁵ B16/F10 cells. On day 5, animals were split into two groups and given either mock injection or IP injection of depleting antibodies against both CD4 and CD8. Antibody depletion treatment was repeated on day 12. Depleted animals were separated into three cohorts and given IT injections of either: saline (n=5), or 1x10⁷ FFU of vGFP (n=5) or vPD1 (n=5) on days 7, 9, and 11. Non-depleted animals injected IT with either saline (n=5) or 1x10⁷ FFU vPD1 (n=5) were used as controls. Animals were then monitored for tumor burden and euthanized when tumors reached 15mm in any direction. (D) C57/B6 mice were injected SQ with 4x10⁵ B16/F10 cells. On day five, animals were given either mock injection (n=12) or IP injection of depleting antibodies against CD4 (n=10), CD8 (n=10), or NK1.1 (n=15). Antibody depletion treatment was repeated on day 12. Animals were then treated with IT injection of 1x10⁷ FFU of vPD1 on days 7, 9, and 11. Non-depleted animals treated with IT injection of saline (n=8) were included as a control. Animals were then monitored for tumor burden and euthanized when tumors reached 15mm in any direction. Data represents summation of two independent experiments. Significance was determined using log-rank test.
Figure 6
Figure 6. vPD1 enhances activation of CD8+ TILs
(AC) C57/B6 mice were injected SQ with 4x10⁵ B16/F10 cells. On day 7, mice were randomly separated into one of four cohorts: saline (n=9), vGFP + isotype (n=7), vGFP + αPD1 antibody (n=6), or vPD1 (n=11). Viral injections consisted of 1x10⁷ FFU and were given on days 7, 9, and 11. Antibody injections consisted of 100μg/injection and were given on days 7 and 11. On day 12, mice were euthanized, tumors disassociated into single cell suspensions, and TIL’s extracted using Histopaque. TILs were then analyzed using flowcytometry. (A) Numbers of CD4+ and CD8+ cells as percentage of total viable cells. (B) Surface expression of the early activation marker CD69 on CD8+ TILs. (C) Surface expression of the early and late activation markers CD69 and CD25 on the surface of CD8+ TILS. Data represents summation of four independent experiments. Significance was determined using unpaired students T-Test.
Figure 7
Figure 7. Localized vPD1 therapy can treat metastatic melanoma
(A–C) C57/B6 mice were injected with B16/F10 cells both SQ (4x10⁵ cells) and IV (1x10⁵ cells). On day five, animals were given either mock injection or IP injection of depleting antibodies against CD4 and either CD8 or NK1.1. Animals were then separated further and given IT injection of either saline or 1x10⁷ FFU of vPD1 into the SQ lesion on days 7, 9, and 11. This resulted in six cohorts: saline (n=7), saline + αCD4 (n=5), vPD1 (n=8), vPD1 + αCD4 (n=10), vPD1 + αCD4 + αCD8 (n=8), vPD1 + αCD4 + αNK1.1 (n=8). Antibody depletion was repeated on day 12. On day 16, mice were euthanized and the lungs examined for the presence of melanin+ lesions. (A) Pictures of representative lungs from the indicated cohorts. (B) Average number of melanin+ lesions (regardless of size) present in the lungs of each mouse. (C) Average size of each melanin+ lesion (regardless of number) present in the lungs of each mouse. Data represents summation of two independent experiments. Significance was determined using unpaired students T-Test (* = p<0.05 and *** =p<0.001). (D and E). C57/B6 mice were injected with B16/F10 cells both SQ (4x10⁵ cells) and IV (1x10⁵ cells). On day five, animals were given either mock injection or IP injection of a depleting antibody against CD4. Each group was then separated into two cohorts and given IT injection of either saline or 1x10⁷ FFU of vPD1 into the SQ lesion on days 7, 9, and 11. Animals were then monitored daily for body weight and euthanized when they displayed either a body weight <80% of starting weight or a BCS=2.0. (D) Average animal body weight for each group as a percentage of starting weight. (E) Overall survival of animals in each cohort. Data represents summation of two independent experiments. Significance was determined using log-rank test.

Similar articles

Cited by

References

    1. Dock G. The influence of complicating diseases upon leukemia. Am J Med Sci. 1904;127:563.
    1. Liu TC, Galanis E, Kirn D. Clinical trial results with oncolytic virotherapy: a century of promise, a decade of progress. Nature clinical practice Oncology. 2007 Feb;4:101. - PubMed
    1. Melcher A, Parato K, Rooney CM, Bell JC. Thunder and lightning: immunotherapy and oncolytic viruses collide. Molecular therapy : the journal of the American Society of Gene Therapy. 2011 Jun;19:1008. - PMC - PubMed
    1. Bell MP, Pavelko KD. Enhancing the Tumor Selectivity of a Picornavirus Virotherapy Promotes Tumor Regression and the Accumulation of Infiltrating CD8+ T Cells. Molecular cancer therapeutics. 2016 Mar;15:523. - PMC - PubMed
    1. Ishihara M, et al. Systemic CD8+ T cell-mediated tumoricidal effects by intratumoral treatment of oncolytic herpes simplex virus with the agonistic monoclonal antibody for murine glucocorticoid-induced tumor necrosis factor receptor. PloS one. 2014;9:e104669. - PMC - PubMed

Publication types

Substances