. 2017 Mar 14;18(11):2608-2621.
doi: 10.1016/j.celrep.2017.02.056.

Canonical Wnt Signaling Ameliorates Aging of Intestinal Stem Cells

Affiliations

Canonical Wnt Signaling Ameliorates Aging of Intestinal Stem Cells

Kodandaramireddy Nalapareddy et al. Cell Rep. .

Abstract

Although intestinal homeostasis is maintained by intestinal stem cells (ISCs), regeneration is impaired upon aging. Here, we first uncover changes in intestinal architecture, cell number, and cell composition upon aging. Second, we identify a decline in the regenerative capacity of ISCs upon aging because of a decline in canonical Wnt signaling in ISCs. Changes in expression of Wnts are found in stem cells themselves and in their niche, including Paneth cells and mesenchyme. Third, reactivating canonical Wnt signaling enhances the function of both murine and human ISCs and, thus, ameliorates aging-associated phenotypes of ISCs in an organoid assay. Our data demonstrate a role for impaired Wnt signaling in physiological aging of ISCs and further identify potential therapeutic avenues to improve ISC regenerative potential upon aging.

Keywords: Wnt signaling; aging; intestinal stem cells; regeneration.


Figures

Figure 1
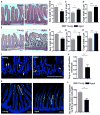
Figure 1. Aging Alters the Architecture of the Intestinal Crypt and Villus and Proliferation
(A) Representative picture of H&E-stained longitudinal sections of the proximal part of the intestine (duodenum) from 2- to 3-months-old (young) and 20- to 22-month-old (aged) mice. Scale bars, 100 μm. (B) Number of crypts per millimeter of small intestine of young and aged mice. (C and D) Average height (C) and width (D) of the crypts in duodenum from young and aged mice. (E) Representative picture of H&E-stained longitudinal sections of the distal part of the intestine (ileum) from young and aged mice. Scale bars, 100 μm. (F) Number of crypts per millimeter of the distal part (ileum) of small intestine of young and aged mice. (G and H) Average height (G) and width (H) of the crypts in ileum. (I) Representative pictures of anti-phospho-histone 3 (pH3) staining in young and aged intestinal crypts. Scale bar, 100 μm. (J) Number of pH3-positive cells per crypt in young and aged intestine. (K) Representative pictures of BrdU-stained young and aged mouse small intestine 72 hr after BrdU treatment. Scale bars, 100 μm. (L) Distance from the crypt base to the middle of the BrdU-positive stripe in the proximal part of young and aged mouse small intestine 72 hr after BrdU treatment. n = 3–4 mice/experimental group. *p < 0.05, **p < 0.01, ***p < 0.001. Error bars indicate SD.
Figure 2
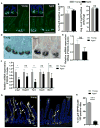
Figure 2. Effect of Aging on ISCs
(A) Representative picture of a formalin-fixed longitudinal cryosection of young and aged Lgr5eGFPCreER(T2) mice. Scale bar, 100 μm. (B) Histogram showing the average percentage of Lgr5-positive (GFP-positive) crypts in the proximal part of young and aged mouse small intestine. (C) Histogram showing the average number of Lgr5-positive (GFP-positive) cells from position 0 to +4 at the crypt base in the proximal part of young and aged mouse small intestine. (D) Representative picture of Olfm4 in situ hybridization on young and aged mouse intestine. Scale bar, 50 μm. A blue/purple color indicates Olfm4 in situ staining, and a light brown color indicates lysozyme staining. (E) Olfm4 expression normalized to β Actin transcript levels in young and aged crypts of mouse small intestine. (F) Lrig1, HopX1, Tert, Sox 9, and Bmi1 expression normalized to β actin transcript levels in young and aged crypts of mouse small intestine. (G) Representative pictures of formalin-fixed longitudinal sections of the proximal part of young and aged Lgr5eGFPCreER(T2) Rosa26 YFP mouse intestine 4 weeks after one shot of tamoxifen. Scale bar, 50 μm. (H) Number of YFP-positive villus/Lgr5 EGFP-positive crypts in the proximal part of young and aged mouse intestine 4 weeks after one shot of tamoxifen. All Expression data were analyzed with the 2−DDCt method. All qRT-PCRs were performed on RNA isolated from crypts of the proximal part of mouse small intestine. n = 3–4 mice/experimental group. *p < 0.05, **p < 0.01, ***p < 0.001. Error bars represent SD.
Figure 3
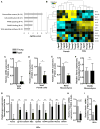
Figure 3. Aging Affects Gene Expression in ISCs and Niche
(A) Histogram showing the downregulated process in ISCs from aged intestine. (B) Heatmap showing differential expression of Wnt genes in young and aged ISCs and Paneth cells. (C) Wnt3 expression normalized to β Actin transcript levels in young and aged ISCs of mouse small intestine. (D) Wnt3 expression normalized to β Actin transcript levels in young and aged Paneth cells. (E) Wnt3 expression normalized to β Actin transcript levels in young and aged mesenchyme of mouse small intestine. (F) Wnt2b expression normalized to β Actin transcript levels in young and aged mesenchyme of mouse small intestine. (G) β Catenin, Axin 2, Ascl2, and Lgr5 expression normalized to β Actin transcript levels in young and aged ISCs. (H and I) Notch1 (H) and Atoh1 (I) expression normalized to β Actin transcript levels in young and aged ISCs of mouse small intestine. All qRT-PCRs were performed on RNA isolated from crypts of the proximal part of mouse small intestine. n = 3–5 mice/experimental group. *p < 0.05, **p < 0.01, ***p < 0.001. Error bars represent SD.
Figure 4
Figure 4. Aging Increases the Number of Intestinal Secretory Cells
(A) Representative picture of staining for lysozyme identifying Paneth cells (red) in the proximal part of young and aged mouse small intestine (nucleus, DAPI, blue). Scale bar, 50 μm. (B) Number of lysozyme-positive cells per crypt in young and aged mice. (C) Representative picture of Alcian blue staining identifying goblet cells in young and aged mice. Scale bar, 50 μm. (D) Number of goblet cells per crypt villus axis in young and aged mice. Scale bar, 50 μm. n = 3–4 mice/experimental group. *p < 0.05, **p < 0.01, ***p < 0.001. Error bars represent SD.
Figure 5
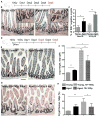
Figure 5. Impaired Regenerative Response in Aged Mouse Intestine
(A) Experimental setup. (B) Representative picture of Ki67 staining in young and aged crypts 5 days after 10-Gy radiation. Scale bar, 100 μm. (C) Percentage of Ki67-negative crypts in young and aged mice. (D) Experimental setup. (E) Representative picture of Ki67 staining in young and aged crypts without radiation (control). Scale bar, 100 μm. (F) Crypt depth in the proximal part of mouse small intestine 5 days after 10+10-Gy radiation. (G) Representative picture of Ki67 staining in young and aged crypts 5 days after 10+10-Gy radiation. Scale bar, 100 μm. (H) Percentage of crypt fission in young and aged crypts 5 days after 10+10-Gy radiation. n = 8 mice/experimental group. *p < 0.05, **p < 0.01, ***p < 0.001. Error bars represent SD.
Figure 6
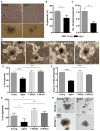
Figure 6. Restoration of Canonical Wnt Signaling in Aged Organoids Restores Youthful Function
(A) Representative picture of organoids of young and aged intestine after three passages as well as pictures of single organoids. Scale bar, 400 μm. (B) Percentage of organoid growth after three passages. (C) Number of lobes per organoid in organoids derived from young and aged crypts of mouse small intestine after three passages. (D) Representative pictures of young and aged organoids in the presence or absence of recombinant Wnt3a. Scale bar, 100 μm. (E and F) Percentage of organoid growth (E) and number of lobes per organoid (F) after three passages of young and aged organoids in the presence or absence of Wnt3a. (G) Percentage of organoids derived from human small intestine at week 1 after initial plating in the presence or absence of recombinant Wnt3a. (H) Representative pictures of organoids derived from young and aged human intestine. Scale bar, 100 μm. Young, n = 4; aged, n = 5. *p < 0.05, **p < 0.01, ***p < 0.001. Error bars represent SD.

Similar articles

Cited by

References

    1. Barker N, van Es JH, Kuipers J, Kujala P, van den Born M, Cozijnsen M, Haegebarth A, Korving J, Begthel H, Peters PJ, Clevers H. Identification of stem cells in small intestine and colon by marker gene Lgr5. Nature. 2007;449:1003–1007. - PubMed
    1. Barker N, van de Wetering M, Clevers H. The intestinal stem cell. Genes Dev. 2008;22:1856–1864. - PMC - PubMed
    1. Blau HM, Cosgrove BD, Ho AT. The central role of muscle stem cells in regenerative failure with aging. Nat Med. 2015;21:854–862. - PMC - PubMed
    1. Boj SF, Hwang CI, Baker LA, Chio II, Engle DD, Corbo V, Jager M, Ponz-Sarvise M, Tiriac H, Spector MS, et al. Organoid models of human and mouse ductal pancreatic cancer. Cell. 2015;160:324–338. - PMC - PubMed
    1. Brack AS, Conboy MJ, Roy S, Lee M, Kuo CJ, Keller C, Rando TA. Increased Wnt signaling during aging alters muscle stem cell fate and increases fibrosis. Science. 2007;317:807–810. - PubMed

Publication types