. 2017 Mar 6;14(1):48.
doi: 10.1186/s12974-017-0814-9.

Cell-specific deletion of C1qa identifies microglia as the dominant source of C1q in mouse brain

Affiliations

Cell-specific deletion of C1qa identifies microglia as the dominant source of C1q in mouse brain

Maria I Fonseca et al. J Neuroinflammation. .

Abstract

Background: The complement cascade not only provides protection from infection but can also mediate destructive inflammation. Complement is also involved in elimination of neuronal synapses which is essential for proper development, but can be detrimental during aging and disease. C1q, required for several of these complement-mediated activities, is present in the neuropil, microglia, and a subset of interneurons in the brain.

Methods: To identify the source(s) of C1q in the brain, the C1qa gene was selectively inactivated in the microglia or Thy-1+ neurons in both wild type mice and a mouse model of Alzheimer's disease (AD), and C1q synthesis assessed by immunohistochemistry, QPCR, and western blot analysis.

Results: While C1q expression in the brain was unaffected after inactivation of C1qa in Thy-1+ neurons, the brains of C1qa FL/FL :Cx3cr1 CreERT2 mice in which C1qa was ablated in microglia were devoid of C1q with the exception of limited C1q in subsets of interneurons. Surprisingly, this loss of C1q occurred even in the absence of tamoxifen by 1 month of age, demonstrating that Cre activity is tamoxifen-independent in microglia in Cx3cr1 CreERT2/WganJ mice. C1q expression in C1qa FL/FL : Cx3cr1 CreERT2/WganJ mice continued to decline and remained almost completely absent through aging and in AD model mice. No difference in C1q was detected in the liver or kidney from C1qa FL/FL : Cx3cr1 CreERT2/WganJ mice relative to controls, and C1qa FL/FL : Cx3cr1 CreERT2/WganJ mice had minimal, if any, reduction in plasma C1q.

Conclusions: Thus, microglia, but not neurons or peripheral sources, are the dominant source of C1q in the brain. While demonstrating that the Cx3cr1 CreERT2/WganJ deleter cannot be used for adult-induced deletion of genes in microglia, the model described here enables further investigation of physiological roles of C1q in the brain and identification of therapeutic targets for the selective control of complement-mediated activities contributing to neurodegenerative disorders.

Keywords: Alzheimer’s; C1q; Complement; Conditional knockout; Expression; Microglia; Mouse model.


Figures
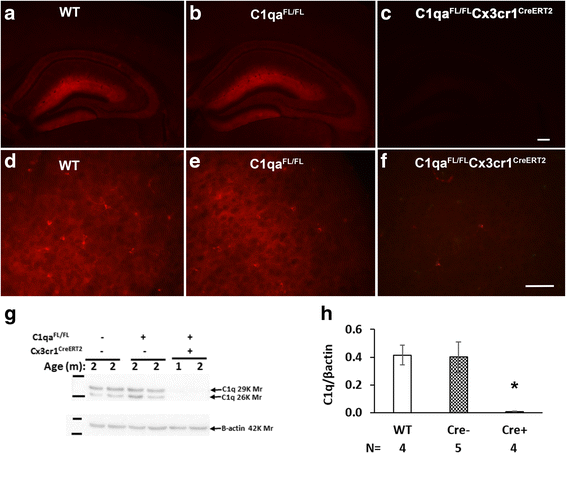
Fig. 1
Fig. 1
Expression of C1q is present at normal levels in the brains of C1qa FL/FL mice but nearly absent in C1qa FL/FL :Cx3cr1 CreERT2 mice independent of tamoxifen administration. C1q staining in hippocampus of a WT, b C1qa FL/FL, and c C1qa FL/FL :Cx3cr1 CreERT2 mice and in the cortex of d WT, e C1qa FL/FL, and f C1qa FL/FL :Cx3cr1 CreERT2 in the absence of tamoxifen treatment. Representative images of n = 3–4 animals per genotype (ages 3–6 m) in (af). Scale bars: ac:200 um, df: 50 um. g Representative western blots of total brain protein extract (60 ug per lane) from WT, C1qa FL/FL, and C1qa FL/FL:Cx3cr1 CreERT2, run under reducing conditions and probed with polyclonal anti-mouse C1q (1151) and anti-actin, as a loading control. h Densitometric ratio of C1q/ß-actin from several western blots performed as in (g), presented as the means +/− SEM of 4–5 animals per group as noted. *P < .03 relative to either WT or C1qFL/FL lacking Cre by one-way ANOVA followed by Bonferroni’s multiple comparisons test
Fig. 2
Fig. 2
C1q colocalizes with YFP in microglia of Cx3cr1 CreERT2 mice but not with YFP in Thy1 CreERT2 mice. Colocalization of C1q (red) with a YFP (green) in Cx3cr1 CreERT2 mice or b, c YFP (green) in the C1qa FL :Thy1 CreERT2 mice. a Cx3cr1 CreERT2 8 m, b C1qa FL/+ :Thy1 CreERT2 CA1, 4 m, c C1qa FL/FL :Thy1 CreERT2 hippocampus, 9 m. Representative pictures of n = 3–4 animals per genotype. Scale bar (ac): 20 um
Fig. 3
Fig. 3
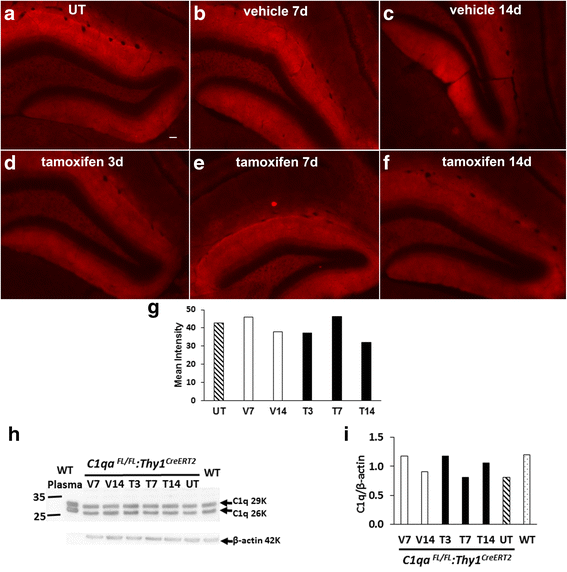
Tamoxifen treatment of C1qa FL/FL :Thy1 CreERT2 mice did not change levels of C1q in the brain. C1q reactivity (red) in hippocampus of untreated (UT) WT (a) and C1qa FL/FL :Thy1 CreERT2 (bf) mice treated with vehicle (b, c) or tamoxifen (d, e, f) for 5 days and perfused at 3,7,or 14 days after treatment. Age 5 m. Scale bar: 50 μm in (a); same magnification in (af). Mean intensity of C1q immunofluorescence (g) in the molecular layer of hippocampus of pictures shown in panels in (af). Brain extracts (60 ug per lane) (h) from C1qa FL/FL:Thy1 CreERT2 treated with vehicle (V) or tamoxifen (T) as in (af), C1q WT at 5 m, and wild type (WT) plasma (1 ul), were run under reducing conditions and probed with polyclonal anti-C1q (1151) and anti actin, as a loading control. Densitometric ratio (i) of C1q/ß-actin of blot in (h)
Fig. 4
Fig. 4
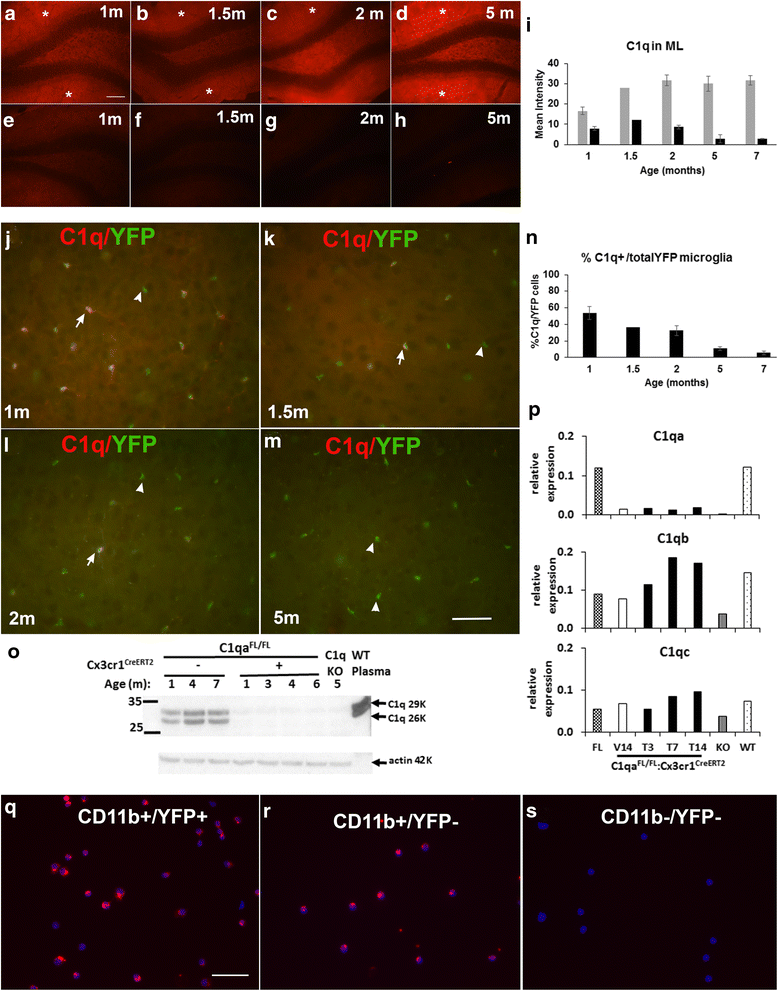
C1q reactivity is present in neonatal microglia of C1qa FL/FL :Cx3cr1 CreERT2 pups, but is decreased at 1 month and continues to decline with age in C1qa FL/FL :Cx3cr1 CreERT2. Representative images of C1q immunostaining (red) in the hippocampus (ah) and cortex (jm) of C1q FL/FL (a, b), WT (c, d), or C1q FL/FL :Cx3cr1 CreERT2 (eh, jm) at different ages as noted in the panels. Identical exposure time and illumination settings were used for each image in (ah) and similarly were identical for the images in (jm). Merged images of C1q immunostaining (red) and YFP (green) showing C1q colocalization with microglia (yellow, arrows) or progressive lack of C1q (YFP green only, arrowheads) in C1q FL/FL Cx3cr1 CreERT2 mice with age (jm). Average of the mean intensity of C1q immunostaining in the molecular layer (*) of C1qa FL/FL (grasy) or C1qa FL/FL:Cx3cr1 CreERT2 (black) at different ages (1 month, n = 4; 1.5 months, n = 1; 2 months, n = 2; 5 months, n = 3; 7 months, n = 2), respectively (i). p values obtained from data from 3–4 mice at 1 and 5 months by ANOVA single factor analysis are p = 0.02 and 0.005, respectively. Quantification of the percentage of total microglia that were C1q positive in the cortex of C1qa FL/FL:Cx3cr1 CreERT2 mice (n). Percentage of C1q-positive microglia per animal was obtained by averaging five images per section per mouse. Bar represent average % of C1q-positive microglia in n mice per age (1 month, n = 4; 1.5 months, n = 1; 2 months, n = 2; 5 months, n = 3; 7 months, n = 2). Brain extracts (60 ug per lane) from C1qa FL/FL and C1qa FL/FL:Cx3cr1 CreERT2 littermates at 1 to 7 months of age, C1qKO at 5 m, and wild type (WT) plasma (1 ul) (o), were run as in Fig. 1. Representative of 3–9 animals per genotype. C1qa, C1qb, and C1qc mRNA relative to Hprt (p) in the brain from C1qa FL/FL (FL), C1qa FL/FL:Cx3cr1 CreERT2 at 3, 7, or 14 days after treatment with vehicle (V) or tamoxifen (T), C1qaKO (KO), and wild type (WT) mice by qPCR. Cells isolated from the brains of 2-day-old C1qa FL/FL :Cx3cr1 CreERT2 (YFP+) and C1qa FL/FL (YFP−) mice were stained with anti-CD11b, sorted by CD11b and YFP and subsequently stained with anti-C1q (red) and DAPI (blue) (qs). Representative pictures of microglia (CD11b+) that are (q) Cx3cr1 CreERT2 (YFP+) show similar C1q staining compared to (r) C1qa FL/FL (YFP−) microglia (CD11b+). No C1q is present in populations negative for CD11b and YFP (neurons, astrocytes) (s). Scale bar 100 μm (ah) or 50 μm (jm,qs)
Fig. 5
Fig. 5
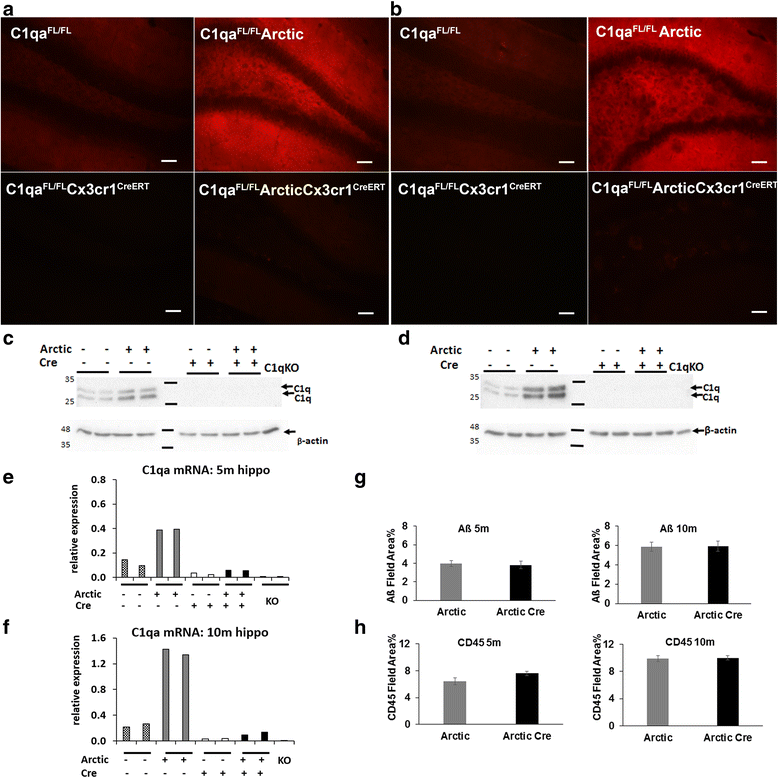
C1q reactivity in the hippocampus is nearly absent in AD C1qa FL/FL mouse models crossed to C1qa FL/FL:Cx3cr1 CreERT2 mice. a, b C1q immunostaining (red) in the brains of C1qa FL/FL (left column) and Arctic C1qa FL/FL (right column) without (top row) or with Cx3cr1 CreERT2 (bottom row) at 5 (a) and 10 m (b) of age. Representative images of the molecular layer of 8–10 animals per genotype per age. Acquisition time and camera gain are identical for each panel within (a or b). The exposure time was shorter in (b) than in (a) to avoid overexposure due to higher levels of C1q in the Arctic brain at 10 months than at 5 months of age (c and d). Scale bars: 50 um. Western blot analysis for C1q in hippocampal extracts (60 ug per lane) from C1qa FL/FL, Arctic:C1qa FL/FL, C1qa FL/FL:Cx3cr1 CreERT2 and Arctic:C1qa FL/FL:Cx3cr1 CreERT2 at c 5 and d 10 months of age. Representative of 4 animals per genotype per age. e, f Increased C1qa mRNA expression relative to Hprt in hippocampal extracts from Arctic compared C1qa FL/FL, mice at both e 5 months and f 10 months, with almost complete absence in all animals containing C1qa FL/FL:Cx3cr1 CreERT2. Representative of 2–4 animals per genotype for 5mo and 3 animals per genotype for 10mo old mice. g Quantification (% Field Area) of amyloid and h CD45 staining in Arctic C1qa FL/FL with and without Cx3cr1CreERT2 at 5 (left) and 10 (right) months of age. n = 8–10 mice per genotype per age. Not statistically different by genotype at each age as assessed by one-way ANOVA (CD45 p = 0.10 (5 months) and p = 0.9 (10 months); Aß p = 0.8 (5 months) and p = 0.95 (10 months)
Fig. 6
Fig. 6
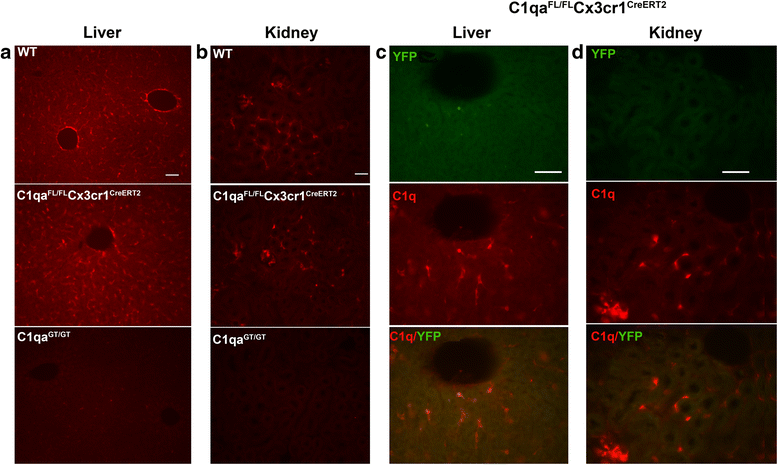
No overt difference in expression of C1q in liver cells and kidney macrophages in C1qa FL/FL:Cx3cr1 CreERT2 compared to wild type mice, correlating with lack of YFP/Cre expression in these tissues in C1qa FL/FL:Cx3cr1 CreERT2. C1q staining of the liver (a) or kidney (b) WT (top panels), C1qa FL/FL :Cx3cr1 CreERT2 (middle panels). C1q reactivity is absent from C1qGT/GT (bottom panels) as expected demonstrating specificity of the antibody in these tissues. Representative pictures of n = 2–5 mice per genotype per age at 4–6 months. C1q (red) but not YFP (green) is detected in the liver (c) and kidney (d) of Cx3cr1 CreERT2 mice (4 months). Bottom panels of (c and d) are the merged images of C1q and YFP. Scale bars: 50 um
Fig. 7
Fig. 7
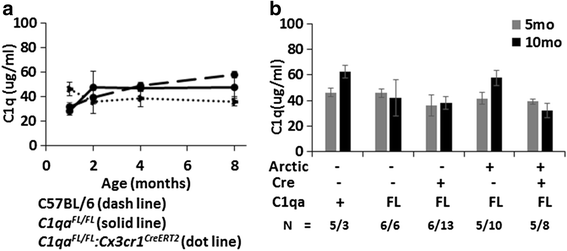
C1q concentration is similar in the blood of C1qa FL/FL:Cx3cr1 CreERT2 and C1qa FL/FL littermates lacking Cx3cr1 CreERT2. a Compiled densitometry of western blot analysis of plasma (1 ul loaded per lane under reducing conditions) from a total of 82 animals: C1qa FL/FL:Cx3cr1 CreERT2 (dotted line, N = 5, 5, 8, and 19), C1qa FL/FL littermates (solid line, N = 3, 4, 8, and 10), and C57BL6/J (dashed line, N = 2, 5, 10, and 3). Plotted values for 4 and 8 months are pooled data from 3–5 and 7–10 months of age, respectively. Membranes were probed with rabbit anti-mouse C1q antibody (1151). Values are +/− SEM. Concentration was determined relative to known wild type plasma C1q concentration on each gel. No significant difference was observed between the groups by one-way ANOVA followed by Bonferroni’s multiple comparisons test (GraphPad). b The same analysis was performed for 5 months (gray) and 10 months (black) C57BL6/J, C1qa FL/FL, Arctic C1qa FL/FL, C1qa FL/FL:Cx3cr1 CreERT2, and Arctic:C1qa FL/FL:Cx3cr1 CreERT2, all in the absence of tamoxifen treatment. There are no statistical differences in plasma C1q concentration among these ages and genotypes, using one-way ANOVA with Bonferroni’s multiple comparisons test

Similar articles

Cited by

References

    1. Sjoberg AP, Trouw LA, Blom AM. Complement activation and inhibition: a delicate balance. Trends Immunol. 2009;30(2):83–90. doi: 10.1016/j.it.2008.11.003. - DOI - PubMed
    1. Hajishengallis G, Lambris JD. Crosstalk pathways between Toll-like receptors and the complement system. Trends Immunol. 2010;31(4):154–163. doi: 10.1016/j.it.2010.01.002. - DOI - PMC - PubMed
    1. Abe T, Hosur KB, Hajishengallis E, Reis ES, Ricklin D, Lambris JD, Hajishengallis G. Local complement-targeted intervention in periodontitis: proof-of-concept using a C5a receptor (CD88) antagonist. J Immunol. 2012;189(11):5442–5448. doi: 10.4049/jimmunol.1202339. - DOI - PMC - PubMed
    1. Brekke OL, Waage C, Christiansen D, Fure H, Qu H, Lambris JD, Osterud B, Nielsen EW, Mollnes TE. The effects of selective complement and CD14 inhibition on the E. coli-induced tissue factor mRNA upregulation, monocyte tissue factor expression, and tissue factor functional activity in human whole blood. Adv Exp Med Biol. 2013;734:123–136. doi: 10.1007/978-1-4614-4118-2_8. - DOI - PubMed
    1. Alexander JJ, Anderson AJ, Barnum SR, Stevens B, Tenner AJ. The complement cascade: Yin-Yang in neuroinflammation—neuro-protection and -degeneration. J Neurochem. 2008;107(5):1169–1187. doi: 10.1111/j.1471-4159.2008.05668.x. - DOI - PMC - PubMed

Publication types

MeSH terms

LinkOut - more resources