

The Repertoire Dissimilarity Index as a method to compare lymphocyte receptor repertoires
- PMID: 28264647
- PMCID: PMC5340033
- DOI: 10.1186/s12859-017-1556-5
The Repertoire Dissimilarity Index as a method to compare lymphocyte receptor repertoires
Abstract
Background: The B and T cells of the human adaptive immune system leverage a highly diverse repertoire of antigen-specific receptors to protect the human body from pathogens. The sequencing and analysis of immune repertoires is emerging as an important tool to understand immune responses, whether beneficial or harmful (in the case of autoimmunity). However, methods for studying these repertoires, and for directly comparing different immune repertoires, are lacking.
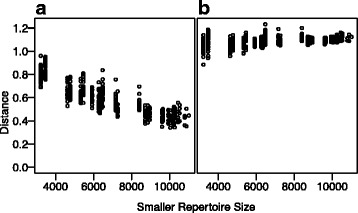
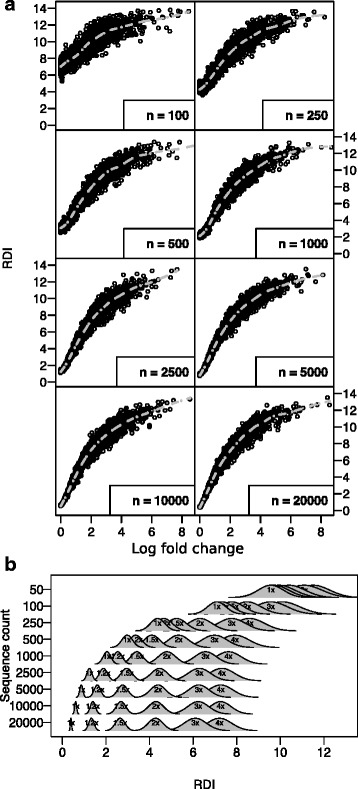
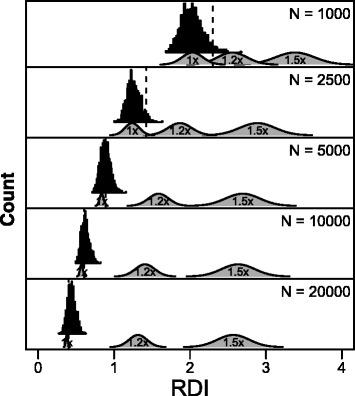
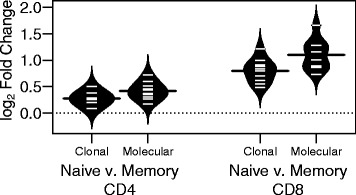
Results: In this paper, we present a non-parametric method for directly comparing sequencing repertoires, with the goal of rigorously quantifying differences in V, D, and J gene segment utilization. This method, referred to as the Repertoire Dissimilarity Index (RDI), uses a bootstrapped subsampling approach to account for variance in sequencing depth, and, coupled with a data simulation approach, allows for direct quantification of the average variation between repertoires. We use the RDI method to recapitulate known differences in the formation of the CD4+ and CD8+ T cell repertoires, and further show that antigen-driven activation of naïve CD8+ T cells is more selective than in the CD4+ repertoire, resulting in a more specialized CD8+ memory repertoire.
Conclusions: We prove that the RDI method is an accurate and versatile method for comparisons of immune repertoires. The RDI method has been implemented as an R package, and is available for download through Bitbucket.
Keywords: Immunology; Nonparametric methods; Repertoire sequencing.
Figures
Similar articles
-
Longitudinal analysis of T-cell receptor repertoires reveals persistence of antigen-driven CD4+ and CD8+ T-cell clusters in systemic sclerosis.J Autoimmun. 2021 Feb;117:102574. doi: 10.1016/j.jaut.2020.102574. Epub 2020 Dec 8. J Autoimmun. 2021. PMID: 33307312
-
Individual heritable differences result in unique cell lymphocyte receptor repertoires of naïve and antigen-experienced cells.Nat Commun. 2016 Mar 23;7:11112. doi: 10.1038/ncomms11112. Nat Commun. 2016. PMID: 27005435 Free PMC article.
-
Quantifiable predictive features define epitope-specific T cell receptor repertoires.Nature. 2017 Jul 6;547(7661):89-93. doi: 10.1038/nature22383. Epub 2017 Jun 21. Nature. 2017. PMID: 28636592 Free PMC article.
-
Antigen-driven T-cell repertoire selection.Crit Rev Immunol. 2005;25(1):59-74. doi: 10.1615/critrevimmunol.v25.i1.40. Crit Rev Immunol. 2005. PMID: 15833083 Review.
-
New perspectives for large-scale repertoire analysis of immune receptors.Mol Immunol. 2008 May;45(9):2437-45. doi: 10.1016/j.molimm.2007.12.018. Epub 2008 Feb 14. Mol Immunol. 2008. PMID: 18279958 Review.
Cited by
-
Reference-based comparison of adaptive immune receptor repertoires.Cell Rep Methods. 2022 Aug 22;2(8):100269. doi: 10.1016/j.crmeth.2022.100269. eCollection 2022 Aug 22. Cell Rep Methods. 2022. PMID: 36046619 Free PMC article.
-
Comparing T cell receptor repertoires using optimal transport.PLoS Comput Biol. 2022 Dec 7;18(12):e1010681. doi: 10.1371/journal.pcbi.1010681. eCollection 2022 Dec. PLoS Comput Biol. 2022. PMID: 36476997 Free PMC article.
-
T Cell Receptor Profiling in Type 1 Diabetes.Curr Diab Rep. 2017 Oct 11;17(11):118. doi: 10.1007/s11892-017-0946-4. Curr Diab Rep. 2017. PMID: 29022222 Free PMC article. Review.
-
Extensive age-dependent loss of antibody diversity in naturally short-lived turquoise killifish.Elife. 2022 Feb 7;11:e65117. doi: 10.7554/eLife.65117. Elife. 2022. PMID: 35129436 Free PMC article.
-
Characterization of T-Cell Receptor Repertoire in Patients with Rheumatoid Arthritis Receiving Biologic Therapies.Dis Markers. 2019 Jul 7;2019:2364943. doi: 10.1155/2019/2364943. eCollection 2019. Dis Markers. 2019. PMID: 31360262 Free PMC article.
References
-
- Schatz DG, Ji Y. Recombination centres and the orchestration of V(D)J recombination. Nat. Rev. Immunol. [Internet]. 2011 [cited 2016 Aug 15];11:251–63. Available from: http://www.ncbi.nlm.nih.gov/pubmed/21394103. - PubMed
-
- Rubelt F, Bolen CR, McGuire HM, Vander Heiden JA, Gadala-Maria D, Levin M, Euskirchen GM, Mamedov MR, Swan GE, Dekker CL, et al. Individual heritable differences result in unique cell lymphocyte receptor repertoires of naïve and antigen-experienced cells. Nat Commun. 2016;7:11112. Available from: https://www.ncbi.nlm.nih.gov/pubmed/27005435. - PMC - PubMed
MeSH terms
Substances
Grants and funding
LinkOut - more resources
Full Text Sources
Other Literature Sources
Research Materials
