. 2017 Feb 28;18(9):2113-2123.
doi: 10.1016/j.celrep.2017.02.014.

Ultrastructural Characterization of Zika Virus Replication Factories

Affiliations

Ultrastructural Characterization of Zika Virus Replication Factories

Mirko Cortese et al. Cell Rep. .

Abstract

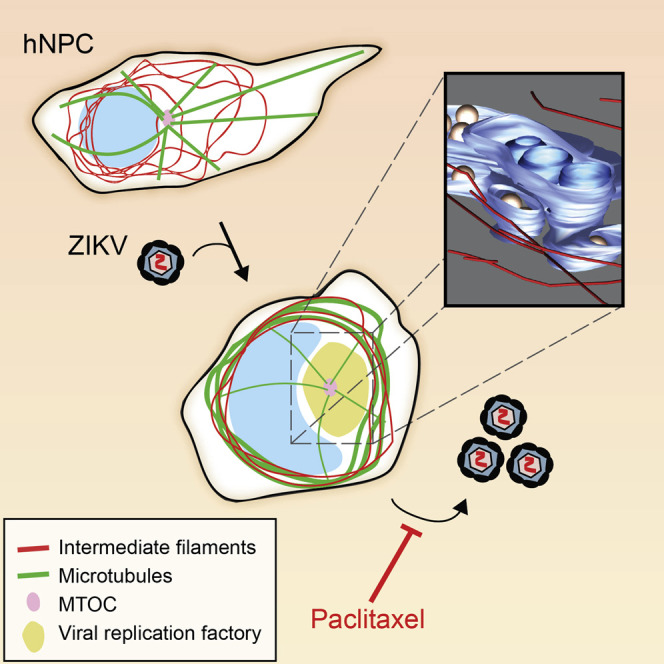
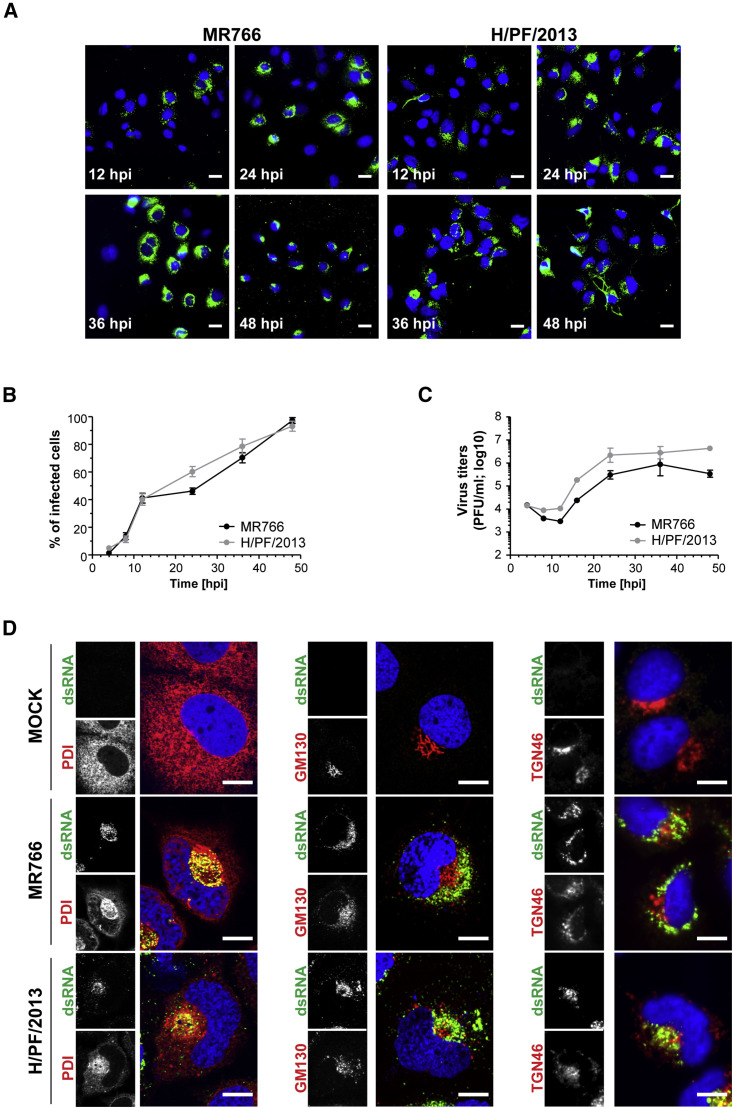
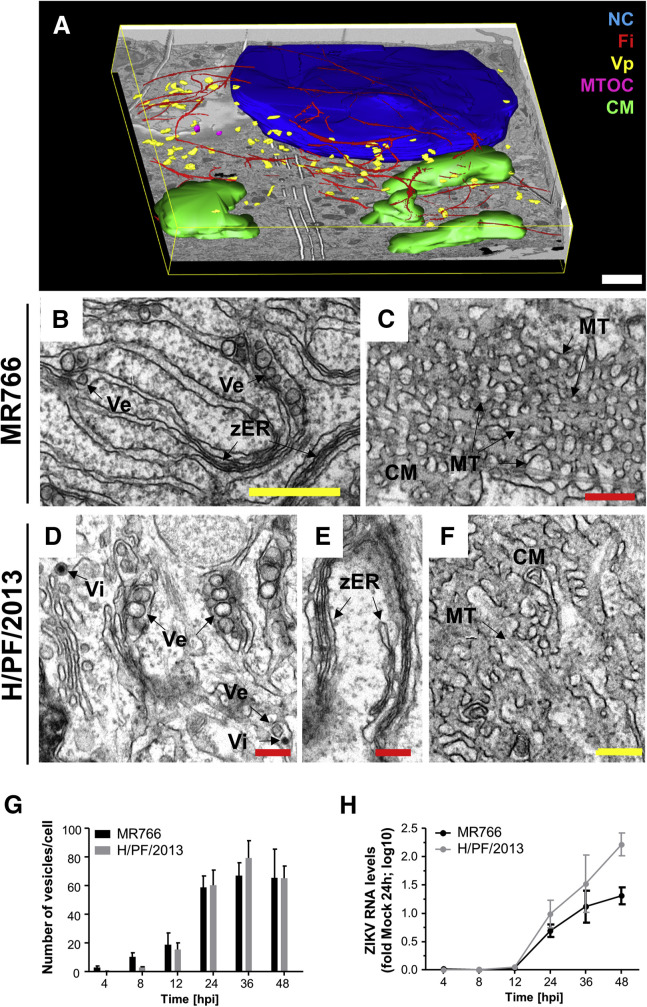
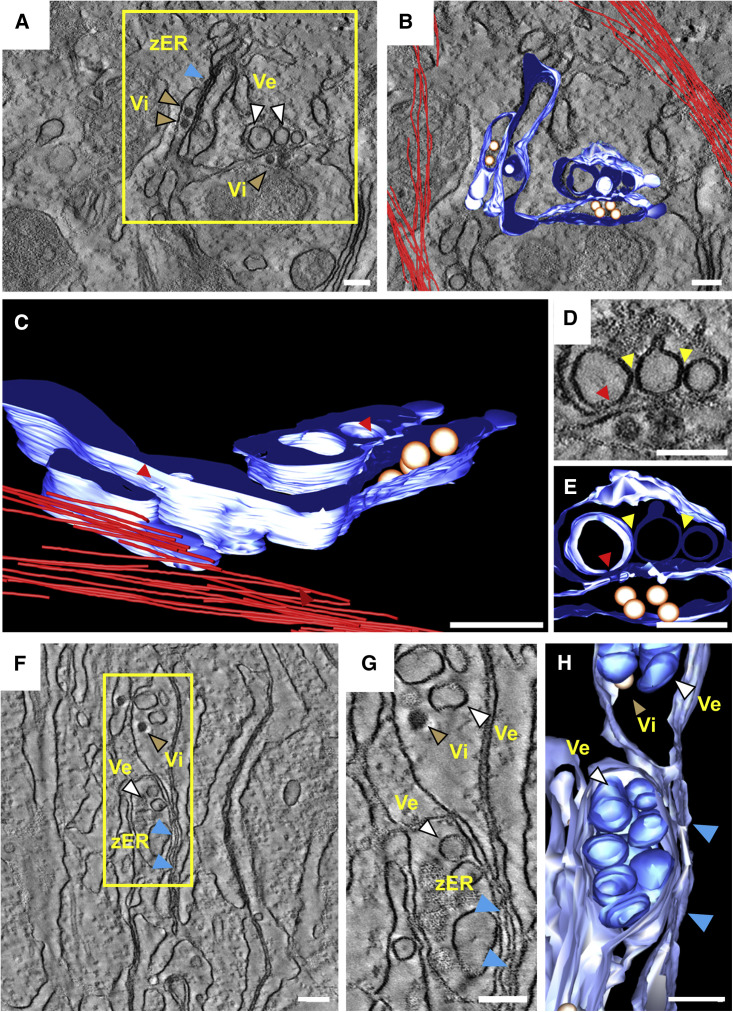
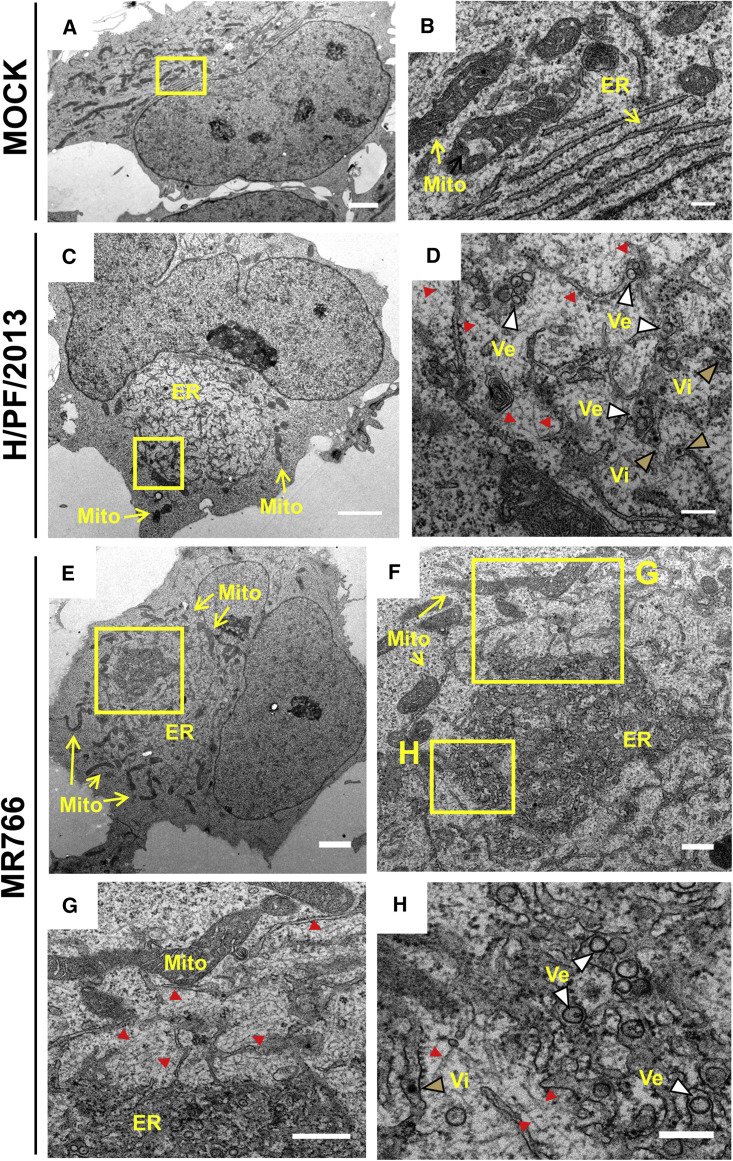
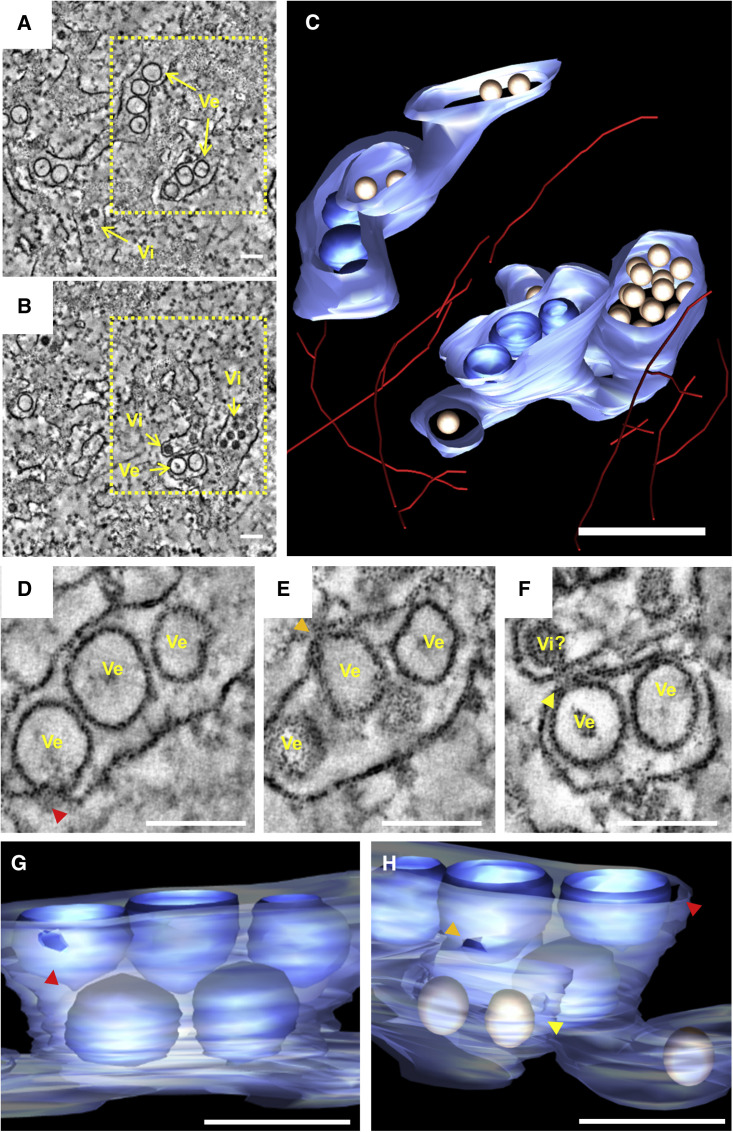
A global concern has emerged with the pandemic spread of Zika virus (ZIKV) infections that can cause severe neurological symptoms in adults and newborns. ZIKV is a positive-strand RNA virus replicating in virus-induced membranous replication factories (RFs). Here we used various imaging techniques to investigate the ultrastructural details of ZIKV RFs and their relationship with host cell organelles. Analyses of human hepatic cells and neural progenitor cells infected with ZIKV revealed endoplasmic reticulum (ER) membrane invaginations containing pore-like openings toward the cytosol, reminiscent to RFs in Dengue virus-infected cells. Both the MR766 African strain and the H/PF/2013 Asian strain, the latter linked to neurological diseases, induce RFs of similar architecture. Importantly, ZIKV infection causes a drastic reorganization of microtubules and intermediate filaments forming cage-like structures surrounding the viral RF. Consistently, ZIKV replication is suppressed by cytoskeleton-targeting drugs. Thus, ZIKV RFs are tightly linked to rearrangements of the host cell cytoskeleton.

Keywords: Zika virus; electron microscopy; electron tomography; flavivirus; human neural progenitor cells; intermediate filaments; live-cell imaging; microtubules; replication factories; replication organelles.


Figures

None
Graphical abstract
Figure 1
Figure 1
ZIKV Growth Kinetic in Huh7 Cells (A) Time course of the spread of ZIKV infection (MOI = 5) in Huh7 cells as detected by immunofluorescence using a dsRNA-specific antibody (green). Nuclear DNA was stained with DAPI (blue). Scale bars, 20 μm. (B) Quantification of the percentage of infected cells shown in (A). Means ± SD from two independent experiments (four fields of view each) are shown. (C) Titers of ZIKV released from infected Huh7 cells. Supernatants from infected cells (MOI = 5) were collected at the indicated time points and titers were determined by plaque assay. Means ± SD from two independent experiments are shown. (D) Huh7 cells were infected with ZIKV (MOI = 5) for 36 hr. Cells were fixed and cellular proteins specified in the left of each panel (red) as well as dsRNA (green) were detected by immunofluorescence microscopy. Colored images are merges of the corresponding individual panels on the left. hpi, hours post-infection; scale bars, 10 μm.
Figure 2
Figure 2
Rearrangement of the Cytoskeleton in ZIKV-Infected Huh7 Cells (A and B) Huh7 cells were mock infected or infected for 36 hr with the MR766 or the H/PF/21013 ZIKV strain (MOI = 5) prior to methanol fixation. ZIKV infection was visualized by immunostaining for dsRNA and Cytokeratin 8 or NS3 and α-tubulin (red), respectively. Nuclear DNA was stained with DAPI (blue). Naïve cells (mock) served as the control. Representative view fields are shown. Yellow squares in the left panels indicate the magnified area shown in the corresponding right color panel. Scale bars, 10 μm. (C) Dynamics of tubulin in Huh7 GFP-tubulin-expressing cells infected with ZIKV MR766 (MOI = 10). Cropped sections of the GFP-tubulin channel recorded 3, 10, 20, 30, and 40 hr post-infection (see Movie S1). A representative infected cell (α) is highlighted to facilitate tracking. Images were taken every 30 min. Scale bars, 20 μm. (D) Titers of ZIKV particles released from Huh7 cells pre-treated 2 hr prior to infection or 3 hr post-infection with bafilomycin A1 (Baf; 2.5 nM). DMSO was used as the control. Supernatants were collected 24 hr post-infection and titers were determined using the plaque assay. Histogram bars represent the fold difference to DMSO-treated cells. Means ± SD from two replicates are shown. (E) Viability of Huh7 cells as determined by measurement of ATP level after a 24-hr treatment with 12.5 μM paclitaxel. Treatment with DMSO was used as the control. Means ± SD from three independent experiments are shown. (F) Huh7 cells were treated for 24 hr with 12.5 μM paclitaxel or with equal amounts of DMSO. α-tubulin was detected by immunofluorescence microscopy. Scale bars, 20 μm. (G) Titer of extracellular virus released from ZIKV-infected Huh7 cells treated with 12.5 μM paclitaxel for 20 hr. Cells were treated with the drug 3 hr after infection with ZIKV (MOI = 5). Histogram bars represent the fold difference to DMSO-treated cells. Means ± SD from three independent experiments are shown.
Figure 3
Figure 3
Ultrastructural Analysis of ZIKV-Infected Cells (A) Huh7 YFP-Sec61β cells were infected with ZIKV MR766 (MOI = 5) for 24 hr and analyzed by FIB-scanning electron microscopy. Infected cells were identified by visual inspection for clusters of YFP-Sec61β corresponding to convoluted membranes (CMs; Chatel-Chaix et al., 2016) followed by correlative light and electron microscopy. Shown is a 3D-reconstruction of a representative infected cell: vesicle packets (Vp, yellow), cytoskeletal filaments (Fi, red), nucleus (NC, blue), convoluted membrane (green), and microtubule-organizing center (MTOC, pink). Scale bar, 2 μm. (B–F) Transmission electron microscopy (TEM) images of 70-nm-thin sections of resin-embedded Huh7 cells infected for 24 hr with ZIKV MR766 (B and C) or H/PF/2013 (D–F) (MOI = 5). (B and D) Virus-induced vesicles (Ve) clustering within the rough ER lumen. (B and E) Tightly juxtaposed and collapsed ER cisternae (zippered ER [zER]). (C and F) Microtubules (MTs) are often associated with convoluted membranes. Red scale bars, 200 nm; yellow scale bars, 500 nm. (G) Time course of accumulation of ZIKV-induced vesicles. Huh7 cells were infected with MR766 or H/PF/2013 prior to fixation at given time points and processed for TEM; 70-nm-thick sections were acquired. For quantification of vesicle numbers per cell, 10 cell profiles were randomly taken for each time point and the average number of vesicles per profile was plotted. Means ± SEM are shown. (H) Time course of accumulation of intracellular ZIKV RNA in infected Huh7 cells (MOI = 5) measured by two-step qRT-PCR. Values for each sample were normalized to glyceraldehyde 3-phosphate dehydrogenase (GAPDH) and are expressed relative to mock cells. Results from two independent experiments (three replicates each) are shown. Means ± SD are displayed.
Figure 4
Figure 4
Electron Tomography of ZIKV-Induced Vesicle Packets in Huh7 Cells (A) Huh7 cells were fixed 24 hr post-infection, embedded in epoxy resin, and analyzed by electron tomography. A tomographic slice showing zippered ER, ZIKV virions (Vi), and virus-induced invaginated vesicles (Ve) within the ER is displayed. The yellow square represents the cropped section shown in (B) which is a 3D surface model of the ER lumen containing vesicles and virions. ER membranes are depicted in blue, virions in gold, and cytoskeletal filaments in red. (C) Side view of the 3D model showing the pore-like openings (red arrowheads) in the ER membrane. (D) Slice through the tomogram showing ER cisternae containing virions opposing ZIKV-induced vesicles. A close apposition of adjacent vesicles is visible (yellow arrowheads), but direct connections are not visible. Red arrowhead, vesicle pore. (E) Reconstruction of the area shown in (D). (F) Slice through a tomogram showing vesicle packets and details of the zippered ER (zER) (blue arrowheads). (G) Magnification of the yellow squared area shown in (F). (H) 3D reconstruction of the area in (F). Regions of zippered ER are indicated with blue arrowheads. Vesicles sharing the same ER lumen as a virion can be observed. Scale bars, 100 nm.
Figure 5
Figure 5
Ultrastructural Analysis of ZIKV-Infected hNPCs (A–H) TEM images of 70-nm-thin sections of ZIKV-infected and resin-embedded hNPCs. Cells were mock infected (A and B) or infected (MOI = 5) with the H/PF/2013 (C and D) or MR766 (E–H) ZIKV strain for 24 hr. Yellow boxed areas are enlarged in the given panels. Overviews of ZIKV-infected cells (C and E) revealing incised nuclei and the ER inclusion. Mitochondria (mito) are located in the cell periphery adjacent to the outer rim of the ER (C and E). Virus-induced vesicles (Ve) and virions (Vi) are indicated in the magnified panels (D and H) and are marked with white and gold arrowheads, respectively. Red arrowheads, cytoskeletal filaments. Scale bars, 2 μm in (A), (C), and (E); 500 nm in (F) and (G); 200 nm in (B), (D), and (H).
Figure 6
Figure 6
Electron Tomography of ZIKV-Induced Vesicle Packets in hNPCs hNPCs were fixed 24 hr post-infection, embedded in epoxy resin, and analyzed by electron tomography. (A and B) A slice through a tomogram is shown depicting ZIKV-induced vesicles (Ve) within the rough ER as well as virions (Vi). (C) 3D surface model of the boxed area in (A), showing virus-induced vesicles, virions, and intermediate filaments. ER membranes are depicted in light blue, vesicles in dark blue, virus particles in gold, and filaments in red. ER tubules connected the virions with the invaginated vesicles. (D–F) Slice through the tomogram showing the pore-like openings (colored arrowheads) of ZIKV-induced vesicles toward the cytoplasm. A potential ZIKV budding event (Vi?) on the ER tubule opposing the vesicle pore can be observed in (F). (G and H) Reconstruction of the areas shown in (D) to (F). Colors of arrowheads refer to the vesicle pores marked in (D) and (E). Scale bars, 100 nm in (A), (B), and (D–H); 200 nm in (C).

Similar articles

Cited by

References

    1. Acosta E.G., Kumar A., Bartenschlager R. Revisiting dengue virus-host cell interaction: new insights into molecular and cellular virology. Adv. Virus Res. 2014;88:1–109. - PubMed
    1. Adams Waldorf K.M., Stencel-Baerenwald J.E., Kapur R.P., Studholme C., Boldenow E., Vornhagen J., Baldessari A., Dighe M.K., Thiel J., Merillat S. Fetal brain lesions after subcutaneous inoculation of Zika virus in a pregnant nonhuman primate. Nat. Med. 2016;22:1256–1259. - PMC - PubMed
    1. Bílý T., Palus M., Eyer L., Elsterová J., Vancová M., Růžek D. Electron tomography analysis of tick-borne encephalitis virus infection in human neurons. Sci. Rep. 2015;5:10745. - PMC - PubMed
    1. Cao-Lormeau V.M., Roche C., Teissier A., Robin E., Berry A.L., Mallet H.P., Sall A.A., Musso D. Zika virus, French Polynesia, South Pacific, 2013. Emerg. Infect. Dis. 2014;20:1085–1086. - PMC - PubMed
    1. Cauchemez S., Besnard M., Bompard P., Dub T., Guillemette-Artur P., Eyrolle-Guignot D., Salje H., Van Kerkhove M.D., Abadie V., Garel C. Association between Zika virus and microcephaly in French Polynesia, 2013-15: a retrospective study. Lancet. 2016;387:2125–2132. - PMC - PubMed

MeSH terms