. 2017 Mar 1:8:14684.
doi: 10.1038/ncomms14684.

Defining stem cell dynamics and migration during wound healing in mouse skin epidermis

Affiliations

Defining stem cell dynamics and migration during wound healing in mouse skin epidermis

Mariaceleste Aragona et al. Nat Commun. .

Abstract

Wound healing is essential to repair the skin after injury. In the epidermis, distinct stem cells (SCs) populations contribute to wound healing. However, how SCs balance proliferation, differentiation and migration to repair a wound remains poorly understood. Here, we show the cellular and molecular mechanisms that regulate wound healing in mouse tail epidermis. Using a combination of proliferation kinetics experiments and molecular profiling, we identify the gene signatures associated with proliferation, differentiation and migration in different regions surrounding the wound. Functional experiments show that SC proliferation, migration and differentiation can be uncoupled during wound healing. Lineage tracing and quantitative clonal analysis reveal that, following wounding, progenitors divide more rapidly, but conserve their homoeostatic mode of division, leading to their rapid depletion, whereas SCs become active, giving rise to new progenitors that expand and repair the wound. These results have important implications for tissue regeneration, acute and chronic wound disorders.


Conflict of interest statement

The authors declare no competing financial interests.

Figures

Figure 1
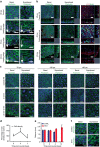
Figure 1. Respective contribution of cell proliferation and migration during WH.
(a) Representative immunostaining of K14 (red) and BrdU (green) in whole-mount skin epidermis of the wounded region at the different time points. Dashed lines limit the wounded area, the LE and the proliferative hub. Scale bar, 500 μm. (b) Quantification of the percentage of BrdU positive cells according to the distance from the wound centre (n=5,000 cells/region counted from three different mice). (c) Descriptive scheme showing the situation in the early days after wound and the localization of the two different areas around the wound between 2 and 7 days after wound. (d) Measure of the width of the LE (orange line) and the proliferative hub (green line) overtime. Five measures were taken per wound (n=3 mice). (e) Measure of the average wound radius overtime. Five different measures were taken per wound (n=3 mice). (f) Measure of the distance between the nearest HF and the LE (red line) and the distance between the HF and the wound centre (blue line). Five different measures were taken per wound (n=3 mice).
Figure 2
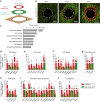
Figure 2. Modifications of cell polarity and cell shape during WH.
(a) Representative confocal analysis of whole-mount epidermis stained for F-actin with phalloidin (green) and β4-integrin (white) showing the different shape of basal (left) and suprabasal (right) cells at the LE 0, 1 and 2 days after wound compare to a control area. Arrows indicate the direction of the wound. Scale bar, 20 μm. (b) Left and middle panels: representative confocal analysis of whole-mounted epidermis stained for F-actin with phalloidin (green) and β4-integrin (white) showing the shape of the basal (left) and suprabasal (middle) cells in the different regions, 4 days after wound. Right panel: immunostaining for BrdU (green) and K14 (red) in the different regions 4 days after wound. (c) Representative confocal pictures of whole-mounted epidermis immunostained for F-actin with phalloidin (green) showing the shape of the basal and suprabasal keratinocytes in the control area, proliferative hub (2–3 mm) and LE (0–2 mm) 7, 10 and 14 days after wound. Nuclei are stained with Hoechst (blue). Scale bar, 20 μm. (d) Percentage of cell density at 0, 4 and 7 days post wound in the proliferative hub normalized by a control area. Five different measures were taken per wound (n=4 mice). (e) Measure of the wound radius after 5-FU topical treatment compared to control-untreated mice (n=3 mice). (f) Representative confocal pictures of whole-mounted epidermis stained for F-actin with phalloidin (green) showing the elongated cells at the LE in the untreated mice and the random orientation of the cells in the same area after 5-FU treatment. Nuclei are stained with Hoechst (blue). Scale bar, 20 μm. Wound centre is at the bottom edge of the pictures.
Figure 3
Figure 3. Molecular signature of the proliferative hub and the LE during WH.
(a) Scheme showing the strategy used to isolate the LE with a 4 mm punch biopsy and the proliferative hub with a 6-mm-punch biopsy. (b) Representative maximum intensity projection of confocal pictures showing the immunostaining of whole-mount epidermis with α5-integrin (red) and anti-BrdU (green) 0, 2 and 4 days after wound. Note the expression of the α5-integrin by the non-proliferative LE cells only. (c) Gene ontology enrichment in the LE 4 days after wound (n=3). (dj) LE signature. List of genes upregulated in the α5-integrin positive cells of the LE compared with the proliferative hub (n=3). These genes are implicated in cell migration (d), inflammation (e), cell adhesion (f), transcription (g), ECM composition (h), cytoskeleton and actin regulators (i) and cell signalling (j).
Figure 4
Figure 4. Spatiotemporal expression of the LE signature during WH.
(a) Representative immunofluorescence of α5-integrin (green) on skin section showing a strong and transient expression of Itgα5 in the basal cells of the LE at D1, D4 and D7 after wound. (b) Representative immunofluorescence of Flrt2/3(green) on skin section showing its expression in the proliferative hub and the LE in basal and suprabasal cells from 1 to 7 days after wound and progressively decreasing 10 and 14 days after wound. (c) Representative immunofluorescence of Gprc5a (green) on skin sections showing its overexpression in the basal and suprabasal cells at the LE at the different time points. (d) Representative immunofluorescence of Tubb2 (green) showing its higher expression in the suprabasal cells both in the proliferative hub and the LE after wound. (e) Representative immunofluorescence for Myo1b (green) showing positive signal in the cells of the LE from D1 to D7. In all the pictures from ae K14 is in red and the nuclei are stained with Hoechst (blue). Scale bar, 20 μm.
Figure 5
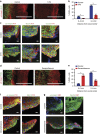
Figure 5. Mechanisms regulating the formation of the LE during WH.
(a) Maximum intensity projection of representative confocal pictures of untreated (control) and 5-FU-treated mice (right). Scale bar, 500 μm. (b) Quantification of the percentage of BrdU positive cells in the LE (0–2 mm) and the proliferative hub (2–3 mm) of untreated (control) and 5-FU-treated mice (**P=0.0079 by Mann–Whitney test, n=5 mice). (c) Representative immunostaining of skin sections showing the presence of the α5-integrin, Myo1b and Gprc5a (green), and K14 (red) at the LE in normal wound and after 5-FU treatment. Scale bar, 10 μm. (d) Maximum intensity projection of representative confocal pictures showing whole-mounted epidermis stained for α5-integrin (red) and BrdU (green) 4 days after wound under normal condition (left) and after anti-inflammatory treatment with dexamethasone (right). Scale bar, 500 μm. (e) Quantification of the percentage of BrdU positive cells in the LE (0–2 mm) and the proliferative hub (2–3 mm) of untreated and dexamethasone-treated mice (**P= 0.0079 by Mann–Whitney test, n=5 mice). (f,g) Representative immunostaining on skin sections showing the expression of the α5-integrin, Myo1b (green) and K14 (red) (f), and the expression of α5-integrin, Gprc5a (green) and Ki67 (red) (g) at the LE in untreated and dexamethasone-treated mice. Scale bar, 10 μm.
Figure 6
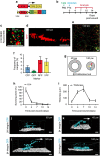
Figure 6. Clonal analysis of IFE SC and progenitors during WH.
(a) Genetic labelling strategy used to trace K14 IFE progenitors during WH. (b) Time line of the wound experiment. K14CREER/RosaConfetti mice were induced with Tamoxifen at 2 months of age and wounded 2 weeks after. The samples were collected 0, 4, 7, 10 and 14 days after wound. (c,d) Maximum intensity projection of representative confocal pictures showing K14CREER clones 0 days (c) and 14 days (d) after wound. (e) Maximum intensity projection of a representative confocal picture showing whole-mounted wounded epidermis from K14CREER RosaConfetti 14 days after wound. Scale bar, 500 μm. (f) Frequency of mergers calculated for each confetti colour. (g) Representative scheme showing the position of the clones (coloured dots) in the proliferative hub (grey area) 4 days after wound and the streaks they form 14 days after wound (coloured lines). (h) Quantification of the percentage of K14CREER surviving clones overtime after wound showing the massive loss of basally attached clones between day 0 and day 4 post wound. (i) Measure of the thickness of the epidermis in the proliferative hub 0, 4, 7, 10 and 14 days after wound. (jm) 3D reconstruction using Imaris software of representative K14CREER RosaConfetti CFP clones imaged by confocal microscopy during WH. To identify the basal cells attached to the basal lamina, samples were stained for b4 integrin (white). In the control unwounded area (j), suprabasal cells are found on the top of basal cells. The picture shows a clone composed of 11 cells, 4 basal and 7 suprabasal cells. In contrast, during healing, the newly produced suprabasal cells are migrating on the top of basal cells toward the wound centre (on the right) (km). In k, the clone has the same size as the control (11 cells) but has more suprabasal cells (9 suprabasal and only 2 basal cells). The clone at D14 shown in l has expanded to reach 39 cells in total (4 of them are basal cells). In m, another clone by contrast expanded basally (83 total cell size, 33 basal cells) at D14 post wound. Arrows indicate cell movement. Scale bar, 20 μm.
Figure 7
Figure 7. Clonal analysis of infundibulum SC during WH.
(a) Genetic labelling strategy used to trace Lrig1 upper HF cells during WH. (b,c) Maximum intensity projection of representative confocal pictures showing Lrig1CREER clones 0 days (b) and 14 days (c) after wound. (df) 3D reconstruction of RFP (red) positive Lrig1-targeted clones with Imaris software. The β4-integrin (white) is marking the basal side. Initially and in normal conditions, Lrig1-targeted clone is confined in the upper part of the HF/infundibulum (d). Upon wound, the progeny of the clone is moving outside of the HF/infundibulum and lines of cells can be seen in the IFE 7 days (e) and 14 days after wound (f). The white arrows show the direction of the wound. Scale bar, 50 μm.
Figure 8
Figure 8. Distinct epidermal stem cells present similar clonal dynamic during WH.
(a,b) Clone size distribution showing the number of basal cells (a) and the total number of cells (b) per clone counted in K14CREER and Lrig1CREER RosaConfetti mice. (c) Average number of basal cells per clone in K14CREER (red) and Lrig1CREER (blue) clones. Solid lines are model predictions. The linear growth of both populations suggests that the stem cells fate outcomes are balanced but Lrig1 SCs achieved at the beginning one more symmetric division initially than K14 SCs. (d,e) Cumulative frequencies of K14CREER (d) and Lrig1CREER (e) basal clone size at different days after wound (dots). Solid lines give the model prediction and shaded areas denote the uncertainty of the model given the experimental data (95% confidence intervals). (f) Model of SC and progenitors cell fate outcome in IFE for K14 (left) and Lrig1 (right) populations during WH. K14-targeted SCs (red, left panel) divide asymmetrically 1.8 (+0.6; −0.3) times per day and give rise to progenitors (grey, left panel) that divide 1.3 (+1.1; −0.6) times per day which then give rise to differentiated cells following a balanced cell fate outcome. Lrig1-targeted SCs (red, right panel) achieve initially one symmetrical division and then asymmetrical divisions giving rise to progenitors (left grey) which follows the same cell fate outcome as described for K14 SCs.
Figure 9
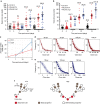
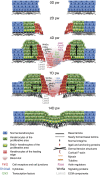
Figure 9. Model of WH in mice.
Cartoons representing the different steps occurring during re-epithelialization of WH. Important genes expressed preferentially during wounding are highlighted. The arrows represent the movement of cells from the basal to the suprabasal compartment including their suprabasal migration.

Similar articles

Cited by

References

    1. Arwert E. N., Hoste E. & Watt F. M. Epithelial stem cells, wound healing and cancer. Nat. Rev. Cancer. 12, 170–180 (2012). - PubMed
    1. Gurtner G. C., Werner S., Barrandon Y. & Longaker M. T. Wound repair and regeneration. Nature 453, 314–321 (2008). - PubMed
    1. Coulombe P. A. Wound epithelialization: accelerating the pace of discovery. J. Invest. Dermatol. 121, 219–230 (2003). - PubMed
    1. Plikus M. V. et al.. Epithelial stem cells and implications for wound repair. Semin. Cell Dev. Biol. 23, 946–953 (2012). - PMC - PubMed
    1. Tumbar T. et al.. Defining the epithelial stem cell niche in skin. Science 303, 359–363 (2004). - PMC - PubMed

Publication types