Meta-Analysis
. 2017 Apr;61(4):563-580.
doi: 10.1007/s12031-017-0898-9. Epub 2017 Feb 24.

Selection and Prioritization of Candidate Drug Targets for Amyotrophic Lateral Sclerosis Through a Meta-Analysis Approach

Affiliations
Meta-Analysis

Selection and Prioritization of Candidate Drug Targets for Amyotrophic Lateral Sclerosis Through a Meta-Analysis Approach

Giovanna Morello et al. J Mol Neurosci. 2017 Apr.

Abstract

Amyotrophic lateral sclerosis (ALS) is a progressive and incurable neurodegenerative disease. Although several compounds have shown promising results in preclinical studies, their translation into clinical trials has failed. This clinical failure is likely due to the inadequacy of the animal models that do not sufficiently reflect the human disease. Therefore, it is important to optimize drug target selection by identifying those that overlap in human and mouse pathology. We have recently characterized the transcriptional profiles of motor cortex samples from sporadic ALS (SALS) patients and differentiated these into two subgroups based on differentially expressed genes, which encode 70 potential therapeutic targets. To prioritize drug target selection, we investigated their degree of conservation in superoxide dismutase 1 (SOD1) G93A transgenic mice, the most widely used ALS animal model. Interspecies comparison of our human expression data with those of eight different SOD1G93A datasets present in public repositories revealed the presence of commonly deregulated targets and related biological processes. Moreover, deregulated expression of the majority of our candidate targets occurred at the onset of the disease, offering the possibility to use them for an early and more effective diagnosis and therapy. In addition to highlighting the existence of common key drivers in human and mouse pathology, our study represents the basis for a rational preclinical drug development.

Keywords: ALS; Meta-analysis; SOD1G93A mouse model; Transcriptomics.


Conflict of interest statement

The authors declare no competing financial interests.

Figures
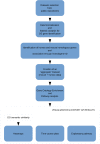
Fig. 1
Fig. 1
Schematic representation of proposed meta-analysis-based drug target selection and prioritization. The workflow depicts the steps performed in this study, from data acquisition to the visualization and export of results in various output formats. See “Methods” section for details. DE differentially expressed, GO Gene Ontology
Fig. 2
Fig. 2
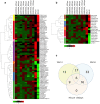
Meta-analysis of gene expression profiles of SOD1G93A mice and SALS patients reveals common candidate therapeutic targets. a Hierarchical clustering heat map visualization of the gene expression pattern for 70 promising therapeutic targets across different datasets of SOD1G93A mice (at different ages and stages of disease) and SALS patients. In this two-dimensional presentation, rows represent target genes and columns denote datasets used in our meta-analysis. From left to right, these datasets included expression profiles of motor neurons from spinal cord of SOD1G93A mice at 40, 60, 70, 80, 90, 100, and 120-day old and motor neurons from motor cortex of two SALS patients’ subgroups. Gene symbols for each human/mouse ortholog pair are shown on the right hand side of the picture. Genes were clustered using a hierarchical clustering based on Euclidean distances of average fold change values represented in linear scale and with complete linkage method as parameter. In the dendrograms shown (left), the length and the subdivision of the branches display the relatedness of the expression of the genes. Fold change values were calculated as the ratio between SALS patients versus individual controls for the human dataset and between SOD1G93A mice versus littermate control groups for each murine dataset. As shown in the color bar, red indicates upregulation, green downregulation, and black no change. Complete gene list and corresponding fold change values are found in Supplementary Table 1. b Hierarchical clustering of 19 statistically significant (P value <0.05) differentially expressed target genes commonly deregulated in both end-stage SOD1G93A mice and SALS patients. Genes corresponding to each row of the heat map are on the right hand side of the picture. Genes are arranged in a hierarchical cluster based on their expression patterns, combined with a dendrograms (left) whose branch lengths reflect the relatedness of expression patterns. As shown in the color bar, red indicates upregulation, green downregulation, and black no change. c Venn diagrams of statistically significant differentially expressed target genes in 120-day-old SOD1G93A mice and SALS patient subgroups compared to their corresponding controls (Table 2)
Fig. 3
Fig. 3
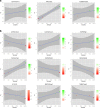
Time-course analysis of commonly deregulated genes in both SALS patients and SOD1G93A mice at different stages of disease. Plots illustrate the correlation of expression fold changes (y-axis) of target genes between SALS1 patients (a) and SALS2 patients (b) versus individual controls and SOD1G93A mice versus littermate controls at 40, 60, 100, and 120 days of age (x-axis). For generating time-course analysis of SOD1G93A mice, we referred to following datasets: GSE10953 for 60, 90, and 120 days old, GSE50642 for 40 days old, and GSE27933 for 100 days old, respectively. The expression pattern relative to SALS patients was reported to the far right of the graph. Each point represents the average fold change value of all probe sets representing the gene. As shown in the color bar, red indicates upregulation and green downregulation. The blue solid line represents the regression line and the surrounding gray area indicates the 95% confidence interval. Source data for this figure are available on Supplementary Table 1
Fig. 4
Fig. 4
Hierarchical clustering and GO functional enrichment analysis of candidate target genes. a Heat map with hierarchical clustering based on Gene Ontology (GO) semantic similarity score of the 19 most promising selected target genes is visualized along with their expression profiles. In this two-dimensional representation, each row represents a single target gene and each column a sample from SOD1G93A mouse models at different stages of disease and SALS patients. Gene symbols for each human/mouse ortholog pair are shown on the right hand side of the picture. Red blocks represent upregulation and green blocks downregulated expression of the relative transcripts, black no change. b–d Pie charts representing the top 10 enriched (P < 0.05) GO terms for the 12 commonly deregulated targets between SALS patients and SOD1G93A mice. The GO terms were subdivided into three GO categories: (b) biological processes, (c) molecular functions, and (d) cellular components. Enrichment analyses were performed using the Enrichment Analysis tool in MetaCore. GO terms or biological features of differently expressed target genes and the percentage of genes represented in each category are indicated. More detailed information are provided in Supplementary Tables 2, 3, and 4
Fig. 5
Fig. 5
Enrichment analysis for pathway map ontologies revealed significant biological processes associated with the most promising targets commonly deregulated in mouse and human ALS. a Representation of the top 10 most significantly enriched (P value <0.05) canonical pathway maps associated with the most promising target genes commonly differentially expressed in end-stage SOD1G93A mice and SALS patients when compared with their corresponding controls. A histogram of statistical significance (−log P value) is shown: the list is arranged in descending order with the most significant pathways at the top. The analysis was performed using the MetaCore™ pathway analysis suite. Detailed information about pathway map enrichment analysis is described in Supplementary Table 5. b Interaction pathway map representing the 12 most promising targets deregulated in the same direction in both end-stage SOD1G93A mice and at least one of the two subgroups of SALS patients, together with their corresponding pharmacological modulators. The map was created using the MetaCore Pathway Map Creator tool (GeneGo). Gene expression values are presented on the map as “thermometer-like” figures (red for upregulated, blue downregulated with thermometer height relative to fold change) with SALS1 patients data represented as thermometer no. 1, SALS2 patient no. 2, and 120-day old SOD1G93A mice no. 3. Pathway objects and links are described separately in the Supplementary Fig. 5

Similar articles

Cited by

References

    1. Achilli F, Boyle S, Kieran D, Chia R, Hafezparast M, Martin JE, Schiavo G, Greensmith L, Bickmore W, Fisher EM. The SOD1 transgene in the G93A mouse model of amyotrophic lateral sclerosis lies on distal mouse chromosome 12. Amyotrophic lateral sclerosis and other motor neuron disorders: official publication of the World Federation of Neurology, Research Group on Motor Neuron Diseases. 2005;6(2):111–114. doi: 10.1080/14660820510035351. - DOI - PubMed
    1. Aebischer J, Bernard-Marissal N, Pettmann B, Raoul C. Death receptors in the selective degeneration of motoneurons in amyotrophic lateral sclerosis. Journal of neurodegenerative diseases. 2013;2013:746845. doi: 10.1155/2013/746845. - DOI - PMC - PubMed
    1. Albo F, Pieri M, Zona C. Modulation of AMPA receptors in spinal motor neurons by the neuroprotective agent riluzole. J Neurosci Res. 2004;78(2):200–207. doi: 10.1002/jnr.20244. - DOI - PubMed
    1. Arnon R, Aharoni R. Mechanism of action of glatiramer acetate in multiple sclerosis and its potential for the development of new applications. Proc Natl Acad Sci U S A. 2004;101(Suppl 2):14593–14598. doi: 10.1073/pnas.0404887101. - DOI - PMC - PubMed
    1. Aronica E, Baas F, Iyer A, ten Asbroek AL, Morello G, Cavallaro S. Molecular classification of amyotrophic lateral sclerosis by unsupervised clustering of gene expression in motor cortex. Neurobiol Dis. 2015;74:359–376. doi: 10.1016/j.nbd.2014.12.002. - DOI - PubMed

Publication types

MeSH terms