. 2017 Feb 21:8:14258.
doi: 10.1038/ncomms14258.

C-edge loops of arrestin function as a membrane anchor

Affiliations

C-edge loops of arrestin function as a membrane anchor

Ciara C M Lally et al. Nat Commun. .

Abstract

G-protein-coupled receptors are membrane proteins that are regulated by a small family of arrestin proteins. During formation of the arrestin-receptor complex, arrestin first interacts with the phosphorylated receptor C terminus in a pre-complex, which activates arrestin for tight receptor binding. Currently, little is known about the structure of the pre-complex and its transition to a high-affinity complex. Here we present molecular dynamics simulations and site-directed fluorescence experiments on arrestin-1 interactions with rhodopsin, showing that loops within the C-edge of arrestin function as a membrane anchor. Activation of arrestin by receptor-attached phosphates is necessary for C-edge engagement of the membrane, and we show that these interactions are distinct in the pre-complex and high-affinity complex in regard to their conformation and orientation. Our results expand current knowledge of C-edge structure and further illuminate the conformational transitions that occur in arrestin along the pathway to tight receptor binding.


Conflict of interest statement

The authors declare no competing financial interests.

Figures

Figure 1
Figure 1. Crystal structure variants of arrestin-1 and schematic of receptor binding equilibrium.
(a) Structure of basal arrestin (PDB code 1CF1, molecule A). The N-domain is coloured blue, the C-domain is coloured green and the C-tail is orange. Important loops and regions referred to in this study are indicated. (b) Comparison of the β- and α-conformers of basal arrestin (1CF1), and the C-terminally truncated pre-active arrestin p44 (4J2Q). The interdomain rotation present in p44 is indicated by the rotation axis. (c) Unbound basal arrestin (grey) first interacts with the phosphorylated receptor C terminus in a low-affinity pre-complex. This initial interaction primes arrestin (orange) for the conformational transition required for full activation (red) and high-affinity coupling to the active receptor.
Figure 2
Figure 2. Dynamic properties of the C-edge of basal arrestin during biased and unbiased molecular dynamics simulation.
(a) All-atom simulation setup containing the isolated C-domain of basal arrestin (1CF1, molecule D), lipid bilayer (80 × 80 Å) composed of SDPC (1-stearoyl-2-docosahexaenoyl-sn-glycero-3-phosphocholine), water layer (not shown for simplicity) and solvated to 0.15 M NaCl, yielding a system of approximately 80,000 atoms. Inset: hydrophobic residues L338, L339 and T343 are buried between the 344-loop and the 197-loop, and polar residues E342 and S344 are directed toward the membrane. (b) Energetic bias of the basal conformation of the 344-loop along the z coordinate using a collective variable of the centre of mass (COM) of the C-alpha atoms of L338, L339, G340, E341 and L342 (344-loop; three replicates × 100 ns, metadynamics). The polar 344-loop is unable to penetrate the membrane and results instead in a membrane deformation. (c) Conformational rearrangement of the 344-loop from basal (C1) to pre-active (C2). Unbiased molecular dynamics simulation captured a structural rearrangement of the 344-loop from basal to pre-active during 100 ns (C3). Superposition (C4) of the crystal structure of pre-active arrestin p44 (yellow, 4J2Q, chain B) with the pre-active conformation obtained in simulation (blue) yields an average RMSD of 1.83 Å. The average RMSD was calculated for residues 335 to 345 and backbone atoms over the last 30 ns of the simulation MD2 (see also Supplementary Fig. 1).
Figure 3
Figure 3. C-edge of pre-active arrestin p44 spontaneously inserts into membrane bilayer.
(a) All-atom simulation setup containing the isolated C-domain of the pre-active arrestin p44 (4J2Q, chain B), lipid bilayer (80 × 80 Å) composed of SDPC (1-stearoyl-2-docosahexaenoyl-sn-glycero-3-phosphocholine), water layer (not shown for simplicity) and solvated to 0.15 M NaCl yielding a system of approximately 80,000 atoms. Inset: conformation of the 344-loop in pre-active arrestin p44 directs hydrophobic residues L338, L339 and L342 toward the lipid bilayer. (b) In an accumulated time of 1 μs (10 × 100 ns) of unbiased molecular dynamics simulation (MD 3), we observed one spontaneous penetration of the 344-loop into the lipid bilayer. After 40 ns simulation time, hydrophobic residues of the 344-loop (L338, L339, L342) as well as the 197-loop (F197 and M198) dip into the hydrophobic region of the lipid bilayer.
Figure 4
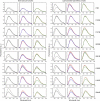
Figure 4. Example fluorescence spectra of bimane-labelled arrestin mutants in the presence of enriched ROS-P membranes.
The fluorescence (λex: 400 nm) of each bimane-labelled arrestin mutant (1 μM) was measured in the unbound state (grey spectra) or when bound to ROS-P (4 μM) control membranes (black spectra). The fluorescence in the presence of fatty-acid enriched ROS-P membranes is also shown: red, methyl palmitate; blue, N-tempoyl-palmitamide; orange, stearic acid; green, 5-doxyl-stearic acid. Note that fluorophores attached to sites on the membrane anchor (197, 339, 342, 344) display a spectral blue-shift upon complex formation with ROS-P (both dark-state and light-activated), indicating localization in a hydrophobic environment. Fluorescence spectra are normalized such that the fluorescence intensity of each mutant in the unbound state equals 1.
Figure 5
Figure 5. Summary of fluorescence quenching experiments.
The measured quenching efficiencies at each site on arrestin in the dark-state pre-complex and the light-activated high-affinity complex (see Table 2) is indicated by a colour spectrum ranging from 0 to 30% (spheres located at Cα). Black indicates instances where fluorescence was enhanced by the presence of spin-labelled fatty acid (that is, negative quenching). Arrestin models are based on the structure of arrestin-1 reported by Hirsch et al. (1CF1, molecule A), and the C-tail is omitted for clarity.
Figure 6
Figure 6. Comparison of simulation and fluorescence data with the crystal structure of the Ops*–arrestin-1 complex.
(Left) Superimposition of the Ops*–arrestin-1 fusion complex crystal structure (green, PDB ID: 4ZWJ) to a sampled C-edge conformation during MD simulation (grey). Coloured horizontal lines indicate the positions for individual lipid atoms: grey lines: C=O based on the OPM database, red line: carbon 5 (C5) based on MD, brown line: phosphate atoms based on MD. (Right) Distance and fluorescence maps, derived from all-atom simulation and site-directed fluorescence experiments, respectively. Distances are depicted for a sampled C-edge conformation which was selected based on the best fit to the arrestin in the Ops*–arrestin-1 fusion complex structure with a RMSDC-domain_arrestin of 1.54 Å (calculated over all backbone atoms). The colour spectrum (0 to 20 Å) corresponds to the distance of the C-alpha carbon (VdW representation) of residues on arrestin to phosphate atoms (relates to the position of the spin label in N-tempoyl-palmitamide) and C5 atoms (relates to the position of the spin label in 5-doxyl stearic acid). The quenching data are coloured according to the degree of quenching (0 to 30%). The white asterisk indicates instances of negative quenching (see text for details).
Figure 7
Figure 7. Different conformational states of the C-edge.
(a) Superposition of sampled MD frame obtained based on the best fitting to the crystallized Ops*arrestin-1 complex (PDB ID: 4ZWJ) to the ‘α-conformer' seen in the crystal structure of arrestin-1 reported by Hirsch et al. (PDB ID: 1CF1, molecule A). (b) Sampled MD frame alone. (c) Crystallized ‘α-conformer' alone. The averaged layer of phosphate atoms (P) and carbon 5 (C5) of lipids are simulation-based coordinates and are indicated by tan and red lines, respectively.

Similar articles

Cited by

References

    1. Manglik A. et al.. Structural insights into the dynamic process of beta2-adrenergic receptor signaling. Cell 161, 1101–1111 (2015). - PMC - PubMed
    1. Tobin A. B. G-protein-coupled receptor phosphorylation: where, when and by whom. Br. J. Pharmacol. 153, (Suppl 1): S167–S176 (2008). - PMC - PubMed
    1. Lefkowitz R. J. A brief history of G-protein coupled receptors (Nobel Lecture). Angew. Chem. Int. Ed. 52, 6366–6378 (2013). - PubMed
    1. Lohse M. J. & Hoffmann C. Arrestin interactions with g protein-coupled receptors. Handbook Exp. Pharmacol. 219, 15–56 (2014). - PubMed
    1. Gurevich V. V. & Gurevich E. V. Analyzing the roles of multi-functional proteins in cells: the case of arrestins and GRKs. Crit. Rev. Biochem. Mol. Biol. 50, 440–452 (2015). - PMC - PubMed

Publication types

LinkOut - more resources